 IST,
IST,


I. Output
In 2008-09, the growth rate of the Indian economy decelerated to 6.7 per cent from an average growth of 8.8 per cent in the preceding five years. India's GDP growth in 2008-09 was one of the highest in the world and reflected the resilience of the country's growth impulses to a severe external shock as well as the impact of the policy response to contain the adverse effects of the global economic crisis on domestic growth. The overall GDP growth in the fourth quarter of 2008-09 remained at the same level as in the previous quarter, primarily on account of a turnaround in growth in agriculture and allied activities, as industry and services continued to exhibit sustained deceleration over the four successive quarters of the year, with the rate of deceleration rising in the second half reflecting the contagion from the global synchronised recession. Available information on the growth of the core infrastructure sector during the first quarter of 2009-10 and the performance of the Index of Industrial Production (IIP) during April-May 2009, indicate signs of recovery, but the delay in the progress of monsoon in June 2009, which has affected kharif sowing, could operate as a drag on the growth prospects. I.1 India’s GDP growth in 2008-09 at 6.7 per cent was lower than the 9.0 per cent growth in 2007-08 as well as the average growth of 8.8 per cent during 2003-08. The slowdown in growth was largely due to the sharp decline in industrial growth and moderation in the growth of the agriculture and the services sectors. The deceleration in industrial growth was primarily an outcome of a moderate cyclical downturn, which got amplified by the global economic slowdown. In the second half of 2008-09, the synchronised global slowdown dampened the strong growth impulses of the high performance phase of the previous years. The pace of deceleration in economic growth was the sharpest in the third quarter of 2008-09, and the deceleration was halted in the fourth quarter only due to the growth turnaround in the agriculture sector, as the industrial sector exhibited modest negative growth and the deceleration in the services sector persisted. I.2 During the fourth quarter of 2008-09, the real GDP growth was estimated at 5.8 per cent as compared with 8.6 per cent in the corresponding period of the previous fiscal. All the sub-sectors except ‘agriculture and allied activities’ and ‘community, social and personal services’ recorded lower growth in the fourth quarter of 2008-09, compared to the corresponding period of 2007-08 (Table 1). The agriculture sector, which had exhibited contraction in the third quarter of 2008-09, witnessed recovery in the fourth quarter. Agricultural Situation I.3 According to the India Meteorological Department, rainfall during the South-West monsoon season of 2009 (June to September) is likely to be below normal at 93 per cent of the long period average (with a model error of ± 4.0 per cent), with the deficiency being the largest for the North-West region of the country.
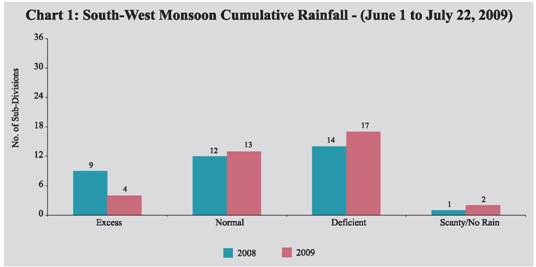
Even though the monsoon set over Kerala on May 23, 2009 (a week ahead of the normal date), its progress has been slow and irregular. The cumulative rainfall during the season so far (up to July 22, 2009) has been less than satisfactory, with rainfall over the entire country being 19.0 per cent below normal as against 2.0 per cent below normal during the corresponding period of the previous year. Of the 36 meteorological subdivisions, cumulative rainfall was excess/ normal in 17 sub-divisions (21 sub-divisions last year) (Chart 1). As on July 23, 2009, the total live water storage in the 81 major reservoirs of the country was 23.0 per cent of the Full Reservoir Level (29.0 per cent during the corresponding period last year). I.4 The delayed progress of the South-West monsoon and the associated deficient rainfall in June 2009 has dampened the prospects for agricultural production; however, the rainfall in July 2009 so far has been relatively good and the improved sowing position as on July 17, 2009 indicates that sowing of most pulses, oilseeds and coarse cereals are close to last year’s levels, though paddy sowing is still substantially below last year’s level (Table 2). I.5 Kharif production, which accounts for about 57 per cent of the overall agricultural production, could be affected, particularly with regard to major kharif crops such as rice, tur, urad, maize and soyabean which are monsoon-dependent. During 2008-09, the lower kharif output was made good by the rabi output and as a result the overall agricultural production exhibited a turnaround in the fourth quarter of the year. The fourth Advance Estimates place the total foodgrain production during 2008-09 at a record 233.9 million tonnes, 1.3 per cent higher than the previous year production of 230.8 million tonnes (Table 3).
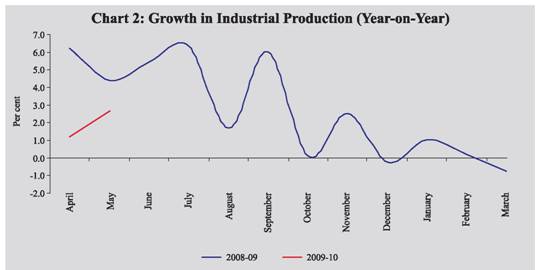
Food Management I.6 The procurement of foodgrain (rice and wheat) during 2009-10 (up to July 13) was higher than that in the corresponding period of the previous year (Table 4). The foodgrain offtake during 2009-10 (up to April 30) was higher compared to the previous year. The total stock of foodgrain with the Food Corporation of India (FCI) and other Government agencies increased to about 51.8 million tonnes as on May 1, 2009. The stocks of both rice and wheat, at 21.4 million tonnes and 29.8 million tonnes, respectively, as on May 1, 2009 were higher than their norms. (The minimum stocks of rice and wheat to be maintained as on April 1 of a year are 12.2 million tonnes and 4.0 million tonnes, respectively.) Industrial Performance I.7 In 2008-09, industrial performance, as measured by the growth in the Index of Industrial Production (IIP), peaked in July 2008. During the second half of the year, industry registered sharp deceleration in growth (year-on-year) with negative growth in December 2008 and March 2009. I.8 Industrial performance presented a mixed picture in April-May 2009. While the manufacturing and the mining sectors continued to decelerate and pulled down growth in the headline IIP to 1.9 per cent (as against 5.3 per cent during April-May 2008), the electricity sector registered appreciable increase during the period (Chart 2 and Table 5). The slowdown in manufacturing sector in April-May 2009 is reflected in the decline in ‘food products’, ‘jute and other vegetable fibre textiles’, ‘leather and fur products’, ‘beverages, tobacco and related products’, ‘cotton textiles’, ‘paper and paper products’ and ‘metal products and parts’. On the other hand, the electricity sector registered a higher growth than last year due to improved thermal and nuclear power generation. The overall industrial performance in April-May 2009 marked an improvement over that during the last quarter of 2008-09.
I.9 Out of the 17 two-digit manufacturing industry groups, 10 groups recorded positive growth during April-May 2009 as compared to 12 industry groups recording positive growth in the corresponding period of last year (Table 6).
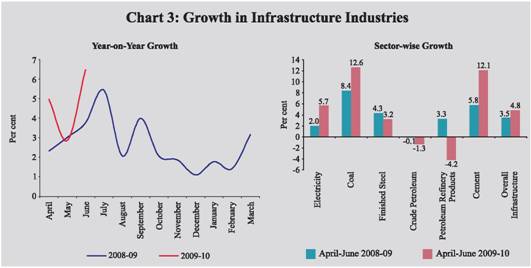
I.10 In terms of use-based classification, the basic, intermediate and consumer durables sectors recorded acceleration in growth, while the capital and the consumer non-durables sectors declined during April-May 2009. After registering a continuous decline for seven successive months, the intermediate goods sector recorded output growth in March 2009 followed by acceleration in growth in April-May 2009. The basic goods sector registered higher growth mainly on account of rise in electricity generation and improved performance of some ‘basic metal and alloy industries’. In contrast, the production of capital goods sector declined following weak performance in segments such as ‘machinery and equipment other than transport equipment’ and ‘transport equipment and parts’. Consumer goods sector also registered a decline primarily due to further contraction in the production of consumer non-durables, while the consumer durables segment gained momentum due to rise in the production of ‘metal products and parts’ and ‘transport equipment’. Decline in respect of consumer non-durables was on account of the decline in production of ‘beverages, tobacco and related products’, ‘paper and paper products’ and ‘basic chemicals and chemical products’. Infrastructure I.11 The core infrastructure sector grew by 4.8 per cent during the first quarter of 2009-10 as compared with 3.5 per cent growth during the corresponding quarter of the previous year, led by considerable growth in electricity, cement and coal (Chart 3). The cement sector recorded acceleration indicating revival of construction activity. I.12 The acceleration in growth of the core infrastructure sector was particularly significant in June 2009 with growth at 6.5 per cent (5.1 per cent in June 2008 and 2.8 per cent in May 2009). The turnaround in June over the previous two months in 2009-10 (i.e., April-May) was due to rise in crude petroleum output by 4.0 per cent (negative growth in April-May), stronger electricity and steel output growth, besides continued robustness in coal and cement output. During April-May 2009, natural gas production recorded a growth of 11.7 per cent to 6,345 million cubic metres.This was, however, 13.4 per cent lower than the target. Services Sector I.13 The services sector recorded a lower growth of 9.4 per cent in 2008-09 as compared with 10.8 per cent growth in 2007-08. Deceleration was observed in all the constituent sectors except ‘community, social and personal services’, which registered an increase reflecting the implementation of the Sixth Pay Commission awards. The construction sector was affected by moderation in residential and commercial real estate demand against the backdrop of slowdown in overall economic activity. Similarly, growth in ‘trade, hotels, transport and communication’ decelerated due to slowdown in trade, business activities and tourism, besides an overall decline in commercial activities. Growth in ‘financing, insurance, real estate and business services’ suffered due to the financial turmoil, subdued construction activities and lower growth in Information Technology – Business Process Outsourcing (IT-BPO) services during the year. In terms of relative contribution to real GDP growth, ‘community, social and personal services’ was the only sub-sector that registered an increase in 2008-09 (Table 7). I.14 The lead indicators of services sector activity for 2009-10 so far suggest decline in growth in respect of foreign tourist arrivals, production of commercial vehicles, cargo handled at major ports, cargo handled by civil aviation and passengers handled at domestic and international terminals. New cellphone connections have also registered sharp growth. The production of cement has shown considerable growth indicating early signs of revival in construction activity (Table 8).
I.15 The impact of the monsoon on the agriculture sector in 2009-10 as a whole, would depend on the behaviour of SouthWest monsoon during August-September 2009, the performance of rabi crops and growth in allied sector activities which account for about 60 per cent of the total agriculture and allied activities output. During April-May 2009, ten industry groups (accounting for 55.2 per cent weight in the IIP) recorded a positive growth as against nine industry groups (accounting for 49.5 per cent weight in the IIP) registering positive growth during the whole of 2008-09. During the first quarter of 2009-10, the core infrastructure sector performed better than the corresponding period of last year, with electricity, coal and cement recording notable acceleration in growth. The lead indicators for the services sector present a mixed picture, with some turnaround in June 2009 (tourist arrivals, railway freight traffic and steel production) after subdued/negative growth in the previous two months. Thus, information across the three major components of the GDP indicates that first quarter GDP growth for 2009-10 may not show a major recovery in relation to the second half of 2008-09.
|
|||||||||||||||||||||||||||||||||||||||||||||||||||||||||||||||||||||||||||||||||||||||||||||||||||||||||||||||||||||||||||||||||||||||||||||||||||||||||||||||||||||||||||||||||||||||||||||||||||||||||||||||||||||||||||||||||||||||||||||||||||||||||||||||||||||||||||||||||||||||||||||||||||||||||||||||||||||||||||||||||||||||||||||||||||||||||||||||||||||||||||||||||||||||||||||||||||||||||||||||||||||||||||||||||||||||||||||||||||||||||||||||||||||||||||||||||||||||||||||||||||||||||||||||||||||||||||||||||||||||||||||||||||||||||||||||||||||||||||||||||||||||||||||||||||||||||||||||||||||||||||||||||||||||||||||||||||||||||||||||||||||||||||||||||||||||||||||||||||||||||||||||||||||||||||||||||||||||||||||||||||||||||||||||||||||||||||||||||||||||||||||||||||||||||||||||||||||||||||||||||||||||||||||||||||||||||||||||||||||||||||||||||||||||||||||||||||||||||||||||||||||||||||||||||||||||||||||||||||||||||||||||||||||||||||||||||||||||||||||||||||||||||||||||||||||||||||||||||||||||

આ પેજ શેર કરો:


રિઝર્વ બેંક ઑફ ઇન્ડિયા મોબાઇલ એપ્લિકેશન ઇન્સ્ટૉલ કરો અને લેટેસ્ટ ન્યૂઝનો ઝડપી ઍક્સેસ મેળવો!
અમારી એપ ઇન્સ્ટોલ કરવા માટે QR કોડ સ્કેન કરો


પેજની છેલ્લી અપડેટની તારીખ:


