 IST,
IST,
I. Output
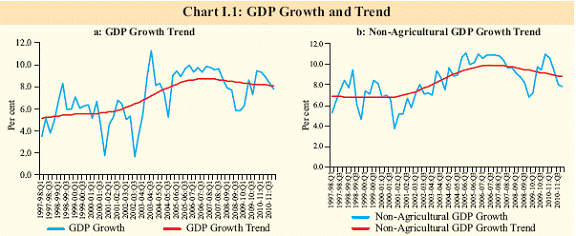
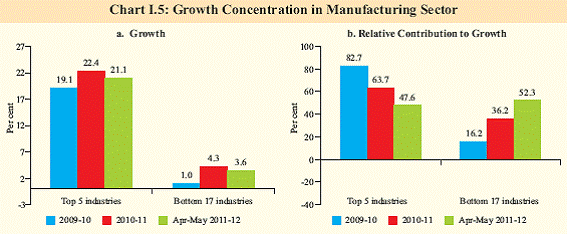
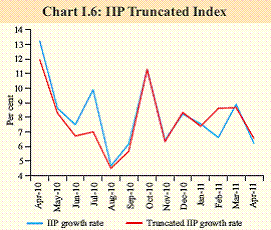
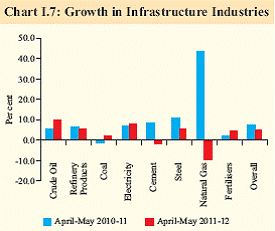
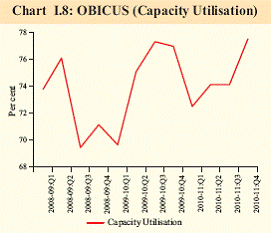
Growth showed signs of moderation in Q1 of 2011-12. Downside risks have increased as a result of forecast of sub-normal monsoon, global growth entering into a soft patch and persistence of high inflation. The new base IIP data confirms that industrial growth had not weakened during H2 of 2010-11, though it decelerated thereafter. The services sector had also maintained its momentum of growth, although its growth stayed below the pre-crisis rate. Going forward there could be some impact on growth from high input prices, high inflation and higher interest rates, but the economy is still likely to grow close to its trend. Growth shows signs of moderation I.1 Signs of moderation in growth have emerged lately. Sequentially, growth had decelerated in each quarter of 2010-11, though it still remained close to trend in the fourth quarter. The new base Index of Industrial Production (IIP) decelerated during April-May 2011. Core infrastructure industries growth also moderated, mainly on account of a decline in natural gas and cement production and subdued growth in coal production. Automobile sales witnessed moderation during Q1 of 2011-12. The manufacturing PMI has dipped to a ninemonth low in June 2011, but still suggests a strong month-on-month expansion in industrial output. The services PMI also indicates an expansionary mode but the readings in Q1 of 2011-12 were slightly lower than the preceding quarter. Cement dispatches and steel consumption were slack during Q1 of 2011-12. Notwithstanding some moderation, growth is likely to be near trend I.2 As indicated in the Monetary Policy Statement of May 2011, growth is likely to decelerate in 2011-12 but stay close to the trend. The Policy Statement had placed the baseline projection at around 8.0 per cent, with a 90 per cent probability of it falling in the 7.4-8.5 per cent range. Though the downside risks have since increased, growth is still likely to stay near the trend. Even as there is some evidence of deceleration in interest-rate sensitive sectors (viz., sales of automobiles and commercial vehicles), credit growth remains strong on a deseasonalised basis. House prices and transactions firmed up during Q4 of 2010-11. I.3 In 2010-11, the growth at 8.5 per cent was supported by a strong performance of the agriculture sector. While GDP growth in 2010-11 was near trend, non-agricultural GDP growth was below trend (Chart I.1). I.4 Year-on-year quarterly growth rates of GDP declined during successive quarters of 2010-11 (Table I.1). As the revised IIP index has not yet been incorporated in the quarterly GDP data, these numbers could see some upward revision. The sharp deceleration during Q4 of 2010-11 was mainly on account of the base effect as concomitantly the GDP estimate for Q4 of 2009-10 was revised upwards substantially. Notwithstanding the near-trend growth in 2010-11, some moderation in growth is expected in 2011-12. The downside risks emanate from slightly below normal monsoon forecast for the year, uncertain global economic environment, high inflation and the impact of past monetary actions to curb aggregate demand. Monsoon starts well, expected to weaken ahead I.5 The agricultural sector emerged as the key driver of growth in 2010-11. As per the Fourth Advance Estimates, there was record production of foodgrains in 2010-11 (Table I.2). During 2011-12, agricultural growth may be lower on account of high base and some monsoon-related concerns.
I.6 In June 2011, the India Meteorological Department (IMD) revised its earlier forecast of a normal South-West monsoon for 2011 from 98 per cent of the Long Period Average (LPA) to below normal at 95 per cent of the LPA. The downside risks have thus increased, but the downward revision is only marginally lower than the normal range of 96-104 per cent of LPA.Therefore, it may not have a dampening effect on the performance of the kharif crops provided the spatial distribution of rainfall continues to remain satisfactory.There has been timely arrival and advancement of the monsoon during the year so far and the IMD has forecast an equitable spatial distribution over the four homogeneous regions in the range of 94-97 per cent of the LPA.
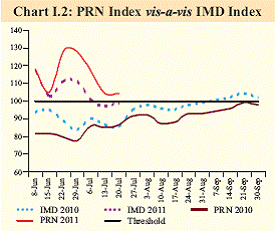
1.7 For the country as whole, rainfall during June 1-July 20, 2011 was 1 per cent below the LPA, compared with 14 per cent below the LPA in the corresponding period of the previous year. The Reserve Bank’s Production (foodgrains weighted) Rainfall Index (PRN) stood at 104 per cent for the period June 1, 2011 to July 20, 2011, compared with 87 per cent in the same period of the previous year, while the IMD rainfall index (area weighted) was 99 (Chart I.2). Kharif sowing with respect to rice, sugarcane, and jute and mesta as on July 22, 2011, was higher than the corresponding period of the previous year, while that for pulses, cereals and cotton was lower. The picture will become clearer in the weeks ahead.
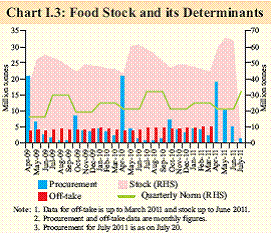
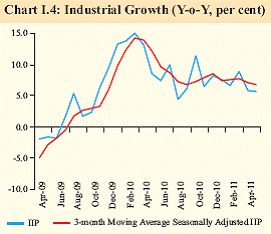
Storage augmentation, reform of food security strategy needed I.8 Against the backdrop of record procurement and food stocks, augmentation of storage capacity and reform of the food security strategy need urgent attention. Agricultural production has improved in recent years. However, certain structural bottlenecks such as inadequate storage capacity, inefficient supplychain and marketing infrastructure are constraining the sector. With a record rabi production in 2010-11, there was unprecedented level of procurement during April-July 2011 (Chart I.3). Food stocks reached a record high of 65.6 million tonnes on June 1, 2011, which is more than twice the buffer stock norm and food security reserve requirement. This also exceeds the existing storage capacity in the country. Pending the implementation of the proposed National Food Security Bill, which may further increase the procurement requirement, failure to fast-track the existing projects and initiate new projects on augmenting storage capacity will lead to continued and increasing wastage and losses. Need for improving post-harvest management of perishable crops I.9 With respect to fruit and vegetables, the country is estimated to be losing about 40 per cent of the yearly produce on an annual basis due to lack of storage, cold chain and transport infrastructure.The seasonality and perishability of these items further magnify the demandsupply gap, which manifests in erratic movements in prices.This underscores the need to strengthen the existing schemes of clusters, cold-chains and transportation facilities. Robust industrial growth in 2010-11, some moderation in early 2011-12 I.10 The new series of the IIP, with base 2004- 05 that was released in June 2011 reinforced the Reserve Bank’s view that the industrial growth had not significantly moderated in H2 of 2010-11.The new series gives better coverage and is more representative of the recent production structure based on 399 item groups as against 303 under the old base.The new series suggests that the recovery from the industrial downturn induced by the global financial crisis further consolidated in 2010-11, with IIP growth accelerating to 8.2 per cent from 5.3 per cent in the preceding year (Table I.3). I.11 Industrial growth, however, moderated in April and May 2011 and turned out to be the lowest since September 2010. The deceleration is particularly strong for mining and manufacturing sectors. While lower growth in mining reflects the shortages in coal production, 14 out of the 22 industry groups that comprise manufacturing witnessed a deceleration. The slowdown in IIP growth during April-May 2011 can be partly attributed to the high base. Seasonal factors do not seem to have contributed to this deceleration (Chart I.4). Manufacturing growth has turned more broad-based I.12 The acceleration in IIP growth in 2010-11 was accompanied by more broad-based growth.The bottom 17 industries registered improved growth performance in 2010-11 compared to the previous year and their contribution to growth more than doubled (Chart I.5). The IIP data for April-May 2011 indicates continuation of this trend. I.13 The Reserve Bank’s truncated measure of IIP1 (ex-volatile items) based on new series exhibits movements similar to the overall IIP in the recent months, suggesting broad-based industrial growth (Chart I.6). Subdued growth in some core industries a drag on overall industrial growth I.14 The core sector growth decelerated in 2010-11 led by decline in coal production, stagnation in fertiliser and deceleration in production of electricity, cement and natural gas.The deceleration has continued in 2011- 12, with lower growth during April-May 2011 compared to the corresponding period of the previous year (Chart I.7).Natural gas production declined mainly on account of lower production from the Krishna-Godavari basin.As a corollary of the revision in the base year of IIP, the base for computing the index of the core infrastructure sector has also been revised to 2004-05 from 1993-94. With the addition of natural gas and fertilisers, the core infrastructure sector now has eight industries with a combined weight of 37.9 in the IIP. Capacity utilisation firms up I.15 Capacity pressures are building up in the economy. Capacity utilisation, an indicator of demand pressure, was the highest in three years during the fourth quarter of 2010-11 (Chart I.8). Increase in capacity utilisation during Q4 of 2010-11 was observed in 17 out of 22 industries covered under the Order Book, Inventory and Capacity Utilisation Survey (OBICUS).The order books of machinery and equipment, basic metal, textiles and cement firms increased during the quarter. Services sector sustains momentum I.16 The services sector growth of 9.2 per cent in 2010-11 was only marginally lower than that in the previous year. This was largely due to deceleration in ‘community, social and personal services’ reflecting fiscal consolidation undertaken by the government. The main drivers of growth in the service sector during the year were ‘trade, hotels, transport, storage and communication’ and ‘financing, insurance, real estate and business services’.Most of the lead indicators of services sector such as growth in tourist arrivals, railway freight traffic, cargo handled at major ports and passengers handled at international terminals showed sustained momentum. The number of cell phone connections and cement production, however, declined (Table I.4).
Unemployment shows declining trend I.17 The 66th Round of Employment/ Unemployment Survey of the National Sample Survey Office (NSSO) shows that the overall unemployment rate, measured by current daily status, declined to 6.6 per cent in 2009-10 from 8.2 per cent in 2004-05.The quarterly quick surveys of employment situation conducted by the Labour Bureau to study the impact of the global economic slowdown on employment in the Indian economy indicate that employment has increased in the recent period in major industries. As per the quarterly surveys of employment situation in eight major industries, employment increased by 9.8 lakh in 2010-11 in the industries surveyed.The IT/BPO sector accounted for 68 per cent of the increase during the year, with the bulk of the increase occurring during the fourth quarter (Table 1.5).
Some moderation in growth expected in 2011-12 I.18 Growth in 2011-12 is likely to moderate compared with the growth in 2010-11. Despite the scaling down of the monsoon forecast to slightly below normal in 2011-12, agriculture growth is expected to stay broadly on track.Near-normal monsoon performance will, however, be an important factor for sustaining robustness of growth in 2011-12.There is evidence of continued strong growth in the services sector. Fiscal consolidation undertaken by the government is likely to further pull down growth in ‘community, social and personal services’.There is possibility of some softening in the industrial sector which is faced with high input cost pressures and escalating cost of capital. Given that non-agricultural GDP growth was below trend in 2010-11, a further softening poses downside risk to growth. 1Computed by excluding top 10 and bottom 10 volatile items in terms of growth (out of 399 sub-item groups of IIP) that may at times tend to undermine the overall momentum of IIP. |
||||||||||||||||||||||||||||||||||||||||||||||||||||||||||||||||||||||||||||||||||||||||||||||||||||||||||||||||||||||||||||||||||||||||||||||||||||||||||||||||||||||||||||||||||||||||||||||||||||||||||||||||||||||||||||||||||||||||||||||||||||||||||||||||||||||||||||||||||||||||||||||||||||||||||||||||||||||||||||||||||||||||||||||||||||||||||||||||||||||||||||||||||||||||||||||||||||||||||||||||||||||||||||||||||||||||||||||||||||||||||||||||||||||||||||||||||||||||||||||||||||||||||||||||||||||||||||||||||||||||||||||||||||
પેજની છેલ્લી અપડેટની તારીખ:


