|
Expansion in monetary and liquidity aggregates has remained strong during 2007-08 so far. Accretion to bank deposits, led by time deposits, remained buoyant. Year-on-year (y-o-y) growth of broad money (M3) as on January 4, 2008 was higher than that at end-March 2007, and was also above the indicative trajectory of 17.0-17.5 per cent for 2007-08 set out in the Annual Policy Statement (April 2007). Growth in bank credit moderated, consistent with policy projections. Banks' investments in SLR securities, as a proportion of their net demand and time liabilities (NDTL), were higher than at end-March. The Reserve Bank continued with the policy of active management of liquidity through increases in the cash reserve ratio (CRR), issuances of securities under the Market Stabilisation Scheme (MSS), operations under the liquidity adjustment facility (LAF) and conduct of open market operations (OMO).
Monetary Survey
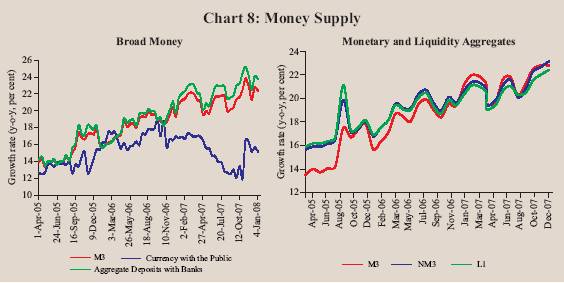
Broad money growth (M3), year-on-year (y-o-y), was higher at 22.4 per cent on January 4, 2008, as compared with 21.3 per cent at end-March 2007 and 20.8 per cent a year ago. This reflected a strong expansion in aggregate deposits, which on a year-on-year basis, remained higher than the projected trajectory of Rs.4,90,000 crore for 2007-08 set out in the Reserve Bank's Annual Policy Statement. Monetary expansion was mainly driven by sizeable accretion of net foreign exchange assets. The other major source of monetary expansion, i.e., bank credit to the commercial sector decelerated during the same period. Non-food credit (inclusive of non-SLR investments) decelerated and was close to the policy projection of 24.0-25.0 per cent. Expansion in the residency-based new monetary aggregate (NM3) - which does not directly reckon non- esident foreign currency deposits such as FCNR(B) deposits - also accelerated to 22.5 per cent on January 4, 2008 from 20.0 per cent a year ago, mainly reflecting the decline in non-resident foreign currency deposits during this period. Growth in liquidity aggregate, L1, at 22.4 per cent at end-December 2007 was also higher than that of 19.4 per cent a year ago (Table 19 and Chart 8).
Taking into consideration the trends in monetary aggregates and in order to absorb excess liquidity from the system, the Reserve Bank has increased the CRR by 250 basis points since December 2006. The ceiling on the outstanding amount under the Market Stabilisation Scheme (MSS) for the year 2007-08 was also successively raised on four occasions to Rs.2,50,000 crore.
Table 19 : Monetary Indicators |
(Amount in Rupees crore) |
Item |
Outstanding |
Variation (year-on-year) |
|
as on January 04, 2008 |
January 05,
2007 |
March 31,
2007 |
January 04,
2008 |
| |
|
Absolute |
Per cent |
Absolute |
Per cent |
Absolute |
Per cent |
1 |
2 |
3 |
4 |
5 |
6 |
7 |
8 |
I. |
Reserve Money* |
8,38,050 |
1,06,877 |
20.0 |
1,35,961 |
23.7 |
1,96,231 |
30.6 |
II. |
Narrow Money (M1) |
10,12,613 |
1,35,416 |
18.2 |
1,38,820 |
16.8 |
1,33,759 |
15.2 |
III. |
Broad Money (M3) |
37,50,334 |
5,26,566 |
20.8 |
5,80,733 |
21.3 |
6,86,925 |
22.4 |
|
a) Currency with the Public |
5,35,191 |
66,845 |
16.8 |
70,352 |
17.0 |
70,245 |
15.1 |
|
b) Aggregate Deposits |
32,10,170 |
4,59,021 |
21.5 |
5,09,754 |
22.1 |
6,17,035 |
23.8 |
|
|
i) Demand Deposits |
4,72,448 |
67,871 |
19.9 |
67,841 |
16.7 |
63,869 |
15.6 |
|
|
ii) Time Deposits |
27,37,721 |
3,91,150 |
21.8 |
4,41,913 |
23.2 |
5,53,166 |
25.3 |
|
|
of which: Non-Resident |
|
|
|
|
|
|
|
|
|
Foreign Currency Deposits |
58,143 |
10,341 |
18.7 |
7,833 |
13.2 |
-7,608 |
-11.6 |
IV. |
NM3 |
37,64,344 |
5,12,266 |
20.0 |
5,71,550 |
20.8 |
6,91,978 |
22.5 |
|
|
of which: Call Term Funding from FIs |
91,561 |
2,499 |
3.1 |
2,692 |
3.2 |
7,699 |
9.2 |
V. |
a) L1 |
38,37,283 |
5,08,857 |
19.4 |
5,83,181 |
20.5 |
7,01,133 |
22.4 |
|
|
of which: Postal Deposits |
1,16,994 |
13,166 |
13.0 |
11,631 |
11.2 |
2,629 |
2.3 |
|
b) L2 |
38,40,215 |
5,08,857 |
19.3 |
5,83,181 |
20.4 |
7,01,133 |
22.3 |
|
c) L3 |
38,66,183 |
5,10,771 |
19.3 |
5,85,255 |
20.3 |
7,02,478 |
22.2 |
VI. |
Major Sources of Broad Money |
|
|
|
|
|
|
|
|
a) |
Net Bank Credit to the Government (i+ii) |
8,46,043 |
25,976 |
3.3 |
71,582 |
9.3 |
39,069 |
4.8 |
|
|
i) Net Reserve Bank Credit to Government |
-1,49,592 |
-19,253 |
- |
-2,384 |
-29.3 |
-1,49,280 |
- |
|
|
of which: to the Centre |
-1,50,278 |
-19,845 |
- |
-3,024 |
-58.6 |
-1,49,358 |
- |
|
|
ii) Other Banks' Credit to Government |
9,95,635 |
45,228 |
5.9 |
73,967 |
9.8 |
1,88,349 |
23.3 |
|
b) |
Bank Credit to Commercial Sector |
23,55,379 |
4,28,305 |
28.0 |
4,30,358 |
25.4 |
3,95,215 |
20.2 |
|
c) |
Net Foreign Exchange Assets |
11,15,219 |
1,84,656 |
28.0 |
1,86,985 |
25.7 |
2,71,263 |
32.1 |
|
d) |
Government Currency Liability to Public |
8,851 |
-487 |
-5.6 |
-467 |
-5.3 |
697 |
8.5 |
|
e) |
Net Non-Monetary Liabilities |
|
|
|
|
|
|
|
|
|
of the Banking Sector |
5,75,158 |
1,11,883 |
25.2 |
1,07,725 |
23.2 |
19,319 |
3.5 |
|
Memo: |
|
|
|
|
|
|
|
|
Aggregate Deposits of SCBs |
29,88,207 |
4,44,241 |
22.9 |
4,99,260 |
23.7 |
6,00,761 |
25.2 |
|
Non-food Credit of SCBs |
21,05,235 |
4,16,418 |
31.9 |
4,16,006 |
28.4 |
3,82,155 |
22.2 |
* : Data pertain to January 18, 2008.
SCBs: Scheduled Commercial Banks.
FIs: Financial Institutions. NBFCs: Non-Banking Financial Companies.
NM3 is the residency-based broad money aggregate and L1, L2 and L3 are liquidity aggregates compiled on the recommendations of the Working Group on Money Supply (Chairman: Dr. Y.V. Reddy, 1998).
L 1 = NM3 + Select deposits with the post office saving banks.
L 2 = L1 +Term deposits with term lending institutions and refinancing institutions (FIs)+ Term borrowing by FIs + Certificates of deposit issued by FIs.
L 3 = L2 + Public deposits of NBFCs.
Note :
1. Data are provisional. Wherever data are not available the estimates for the last available month have been repeated.
2. Liquidity aggregates pertain to end-December 2007. |
On a year-on-year basis, currency with the public increased by 15.1 per cent, lower than the growth of 16.8 per cent in the corresponding period of the previous year. Growth in demand deposits was also lower than a year ago as well as that at end-March 2007. Growth in narrow money (M1), y-o-y, was
15.2 per cent as on January 4, 2008 as compared with 18.2 per cent a year ago and 16.8 per cent at end-March 2007. The growth in broad money was higher, reflecting buoyancy in time deposits which accelerated from 21.8 per cent on January 5, 2007 to 23.2 per cent at end-March 2007 and further to 25.3 per cent on January 4, 2008. Concomitantly, the accretion to postal deposits decelerated significantly during the year (Chart 9). The higher order of increase in time deposits can be attributed, inter alia, to robust economic activity, increase in interest rates on bank deposits, unchanged interest rates on postal deposits and extension of tax benefits under Section 80C for bank deposits. In order to
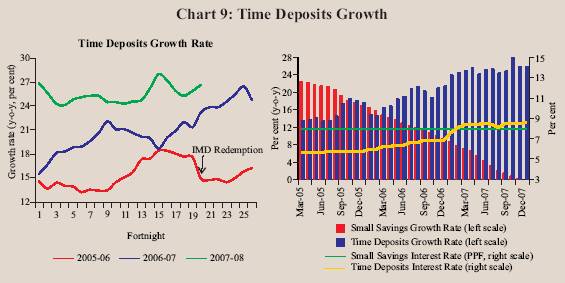
revive saving interest in postal deposits, the Government of India announced in December 2007, incentives including tax benefits for certain postal deposits.
Growth in M3, on a financial year basis, during 2007-08 (up to January 4, 2008) at 13.3 per cent was higher than that of 12.2 per cent in the corresponding period of the previous year. Notwithstanding a sharp accretion during the third quarter of 2007-08 on account of festive season currency demand in November, currency with the public decelerated during the current financial year so far (up to January 4, 2008) (Table 20).
Growth in bank credit to the commercial sector moderated somewhat during 2007-08 (up to January 4, 2008) from the strong pace of the previous
Table 20 : Monetary Aggregates - Variations |
(Rupees Crore) |
Item |
2006-07
up to |
2007-08
up to |
2006-07 |
2007-08 |
|
Jan. 05 |
Jan. 04 |
Q1 |
Q2 |
Q3 |
Q4 |
Q1 |
Q2 |
Q3 |
1 |
2 |
3 |
4 |
5 |
6 |
7 |
8 |
9 |
10 |
(1+2+3 = 4+5+6+7-8) |
3,33,864 |
4,40,056 |
55,411 |
1,68,401 |
62,951 |
2,93,970 |
76,191 |
1,97,025 |
1,19,300 |
M3 |
(12.2) |
(13.3) |
|
|
|
|
|
|
|
Components |
|
|
|
|
|
|
|
|
|
1. Currency with the Public |
51,828 |
51,721 |
23,797 |
-2,878 |
27,587 |
21,847 |
17,434 |
-14,231 |
47,535 |
|
(12.5) |
(10.7) |
|
|
|
|
|
|
|
2. Aggregates Deposits with Banks |
2,83,577 |
3,90,858 |
33,227 |
1,70,827 |
35,866 |
2,69,833 |
59,194 |
2,12,735 |
72,520 |
|
(12.3) |
(13.9) |
|
|
|
|
|
|
|
|
2.1 Demand Deposits with Banks |
2,192 |
-1,780 |
-42,399 |
43,794 |
-8,252 |
74,697 |
-42,505 |
58,255 |
-5,577 |
|
(0.5) |
(-0.4) |
|
|
|
|
|
|
|
|
2.2 Time Deposits with Banks |
2,81,385 |
3,92,638 |
75,626 |
1,27,033 |
44,118 |
1,95,136 |
1,01,698 |
1,54,480 |
78,098 |
|
(14.8) |
(16.7) |
|
|
|
|
|
|
|
3.'Other' Deposits with Banks |
-1,541 |
-2,523 |
-1,613 |
452 |
-502 |
2,291 |
-436 |
-1,479 |
-756 |
|
|
|
|
|
|
|
|
|
|
Sources |
|
|
|
|
|
|
|
|
|
4. Net Bank Credit to Government |
40,379 |
7,866 |
23,431 |
14,175 |
-13,204 |
47,180 |
24,833 |
16,479 |
-38,624 |
|
(5.3) |
(0.9) |
|
|
|
|
|
|
|
|
4.1 RBI's Net Credit to Government |
-8,448 |
-1,55,344 |
53 |
2,826 |
-12,754 |
7,490 |
-25,483 |
-54,695 |
-65,787 |
|
4.1.1 RBI's Net credit to Centre |
-6,079 |
-1,52,413 |
3,071 |
2,584 |
-12,568 |
3,889 |
-21,825 |
-55,588 |
-65,078 |
|
4.2 Other Banks' Credit to Government |
48,828 |
1,63,210 |
23,378 |
11,349 |
-451 |
39,690 |
50,315 |
71,174 |
27,164 |
5. Bank Credit to Commercial Sector |
2,67,159 |
2,32,017 |
14,930 |
1,44,204 |
78,099 |
1,93,125 |
-31,817 |
1,46,814 |
92,490 |
|
(15.8) |
(10.9) |
|
|
|
|
|
|
|
6. NFEA of Banking Sector |
1,17,762 |
2,02,040 |
58,087 |
20,197 |
43,160 |
65,542 |
-17,945 |
1,18,249 |
94,681 |
|
6.1 NFEA of RBI |
1,06,806 |
2,18,422 |
71,845 |
11,392 |
27,250 |
82,682 |
-2,745 |
1,19,430 |
94,681 |
7. Government's Currency Liabilities to the Public |
-600 |
564 |
-920 |
155 |
166 |
132 |
140 |
354 |
70 |
8. Net Non-Monetary liabilities of the |
|
|
|
|
|
|
|
|
|
|
Banking Sector |
90,837 |
2,431 |
40,117 |
10,330 |
45,269 |
12,009 |
-1,00,980 |
84,870 |
29,318 |
Memo : |
|
|
|
|
|
|
|
|
|
1 |
Non-resident Foreign Currency |
|
|
|
|
|
|
|
|
|
|
Deposits with SCBs |
6,476 |
-8,965 |
3,917 |
1,671 |
1,233 |
1,011 |
-3,849 |
-1,181 |
-3,392 |
2. |
SCB' Call-term Borrowing from |
|
|
|
|
|
|
|
|
|
|
Financial Institutions |
719 |
5,725 |
3,118 |
-1,576 |
-4,468 |
5,618 |
-2,984 |
5,756 |
6,943 |
3. Overseas Borrowing by SCBs |
-4,088 |
1,958 |
3,301 |
-3,685 |
-2,774 |
5,229 |
-6,928 |
7,830 |
3,366 |
SCBs: Scheduled Commercial Banks.
NFEA: Net Foreign Exchange Assets.
Note: 1. Figures in parentheses are percentage variations. |
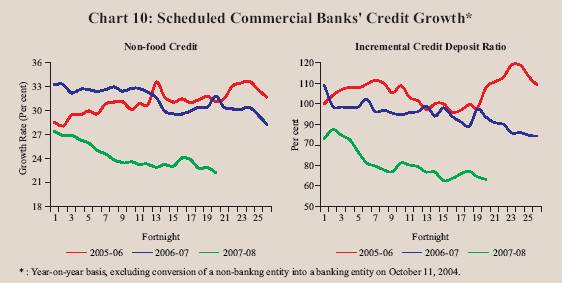
three years. Non-food credit by scheduled commercial banks (SCBs) expanded by 22.2 per cent, y-o-y, as on January 4, 2008 as compared with 28.4 per cent at end-March 2007 and 31.9 per cent a year ago. The deceleration in credit growth coupled with the acceleration in deposit growth led to a decline in the incremental credit-deposit ratio (y-o-y) of SCBs to 63.3 per cent as on January 4, 2008 from 93.7 per cent a year ago (Chart 10).
Disaggregated sectoral data available up to November 23, 2007 show that about 43 per cent of incremental non-food credit (y-o-y) was absorbed by industry, as compared with 34 per cent in the corresponding period of the previous year. The expansion of incremental non-food credit to industry during this period was led by infrastructure (power, port and telecommunication), iron and steel, textiles, engineering, food processing, vehicles, petroleum, chemicals and construction industries. The infrastructure sector alone accounted for over 28 per cent of the incremental credit to industry as compared with 18 per cent in the corresponding period of the previous year. The agricultural sector absorbed around 12 per cent of the incremental non-food bank credit expansion. Personal loans accounted for nearly 23 per cent of incremental non-food credit as compared with 29 per cent a year ago; within personal loans, the share of incremental housing loans stood at 40 per cent. Growth in loans to commercial real estate remained high, notwithstanding some moderation (Table 21).
Apart from bank credit, the corporate sector continued to meet its funding requirements from non-bank sources such as capital markets, external commercial borrowings and internal generation of funds. Resources raised through domestic equity issuances during the first nine months of 2007-08 (Rs.31,897 crore) were higher by 40 per cent than the corresponding period of
Table 21 : Deployment of Non-food Bank Credit |
(Amount in Rupees Crore) |
Sector/Industry |
Outstanding as on |
Year-on-Year Variation |
|
November |
November 24, 2006 |
November 23, 2007 |
|
23, 2007 |
Absolute |
Per cent |
Absolute |
Per cent |
1 |
2 |
3 |
4 |
5 |
6 |
Non-food Gross Bank Credit (1 to 4) |
19,26,550 |
3,66,638 |
30.4 |
3,52,287 |
22.4 |
1. |
Agriculture and Allied Activities |
2,32,124 |
45,788 |
31.5 |
40,863 |
21.4 |
2. |
Industry (Small, Medium and Large) |
7,55,440 |
1,22,984 |
25.6 |
1,52,346 |
25.3 |
|
Small Scale Industries |
1,30,284 |
16,850 |
21.1 |
33,259 |
34.3 |
3. |
Personal Loans |
4,88,413 |
1,05,034 |
35.0 |
81,451 |
20.0 |
|
Housing |
2,46,689 |
53,198 |
33.4 |
32,424 |
15.1 |
|
Advances against Fixed Deposits |
39,269 |
1,671 |
5.4 |
6,360 |
19.3 |
|
Credit Cards |
16,951 |
3,564 |
43.3 |
5,157 |
43.7 |
|
Education |
18,992 |
4,157 |
47.4 |
5,856 |
44.6 |
|
Consumer Durables |
9,081 |
957 |
11.2 |
-419 |
-4.4 |
4. |
Services |
4,50,573 |
92,832 |
33.3 |
77,627 |
20.8 |
|
Transport Operators |
29,614 |
9,676 |
81.4 |
7,903 |
36.4 |
|
Professional & Other Services |
24,861 |
6,480 |
52.8 |
5,941 |
31.4 |
|
Trade |
1,11,835 |
23,613 |
34.4 |
16,828 |
17.7 |
|
Real Estate Loans |
50,660 |
16,603 |
77.7 |
12,563 |
33.0 |
|
Non-Banking Financial Companies |
53,400 |
6,850 |
25.5 |
18,555 |
53.3 |
Memo: |
|
|
|
|
|
Priority Sector |
6,61,459 |
1,10,030 |
25.1 |
1,11,851 |
20.4 |
Industry (Small, Medium and Large) |
7,55,440 |
1,22,984 |
25.6 |
1,52,346 |
25.3 |
Food Processing |
42,966 |
6,493 |
24.4 |
9,916 |
30.0 |
Textiles |
83,478 |
15,602 |
30.3 |
16,376 |
24.4 |
Paper & Paper Products |
12,262 |
2,110 |
25.6 |
1,973 |
19.2 |
Petroleum, Coal Products & Nuclear Fuels |
34,936 |
9,368 |
46.2 |
5,277 |
17.8 |
Chemical and Chemical Products |
56,284 |
9,682 |
23.4 |
5,224 |
10.2 |
Rubber, Plastic & their Products |
9,266 |
1,438 |
23.6 |
1,740 |
23.1 |
Iron and Steel |
76,367 |
15,349 |
36.5 |
18,703 |
32.4 |
Other Metal & Metal Products |
21,149 |
5,110 |
36.5 |
2,100 |
11.0 |
Engineering |
48,500 |
4,950 |
15.1 |
10,734 |
28.4 |
Vehicles, Vehicle Parts and Transport Equipments |
26,091 |
2,079 |
12.4 |
7,248 |
38.5 |
Gems & Jewellery |
24,380 |
3,640 |
19.2 |
1,823 |
8.1 |
Construction |
21,754 |
4,549 |
39.3 |
5,880 |
37.0 |
Infrastructure |
1,63,754 |
22,034 |
22.2 |
42,030 |
34.5 |
Note : 1. Data are provisional and relate to select scheduled commercial banks.
2. Owing to change in classification of sectors/industries and coverage of banks, data for 2006 are not comparable with earlier data. |
the previous year. Mobilisation in the form of equity issuances through American depository receipts (ADRs) and global depository receipts (GDRs) during April-December 2007 (Rs.11,439 crore) were higher by 43 per cent than a year ago. Net mobilisation through external commercial borrowings (ECBs) during April-September 2007 increased by nearly 50 per cent over the corresponding period of the previous year. Internal generation of funds continued to provide strong support to the funding requirements of the corporate sector, with the profit
after tax of sample non-financial non-government companies during the first and second quarters of 2007-08 being higher than during the corresponding quarters of the previous year (Table 22).
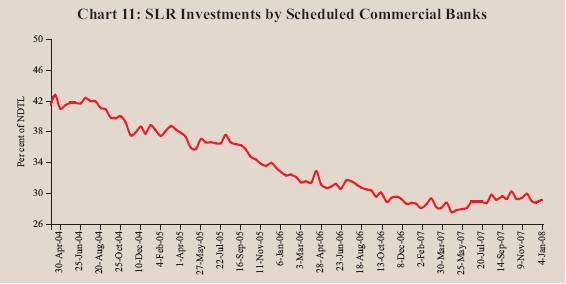
Growth in deposits, issuances of fresh capital and internal generation of funds by banks on the one hand, and moderation in credit growth on the other, enabled banks to deploy their funds in Government and other approved securities, which increased by 24.7 per cent, y-o-y, as on January 4, 2008 as compared with 5.9 per cent a year ago (Table 23). Commercial banks' holdings of such securities as on January 4, 2008 increased to 29.1 per cent of their NDTL from 28.0 per cent at end-March 2007 and 28.6 per cent a year ago (Chart 11). Excess SLR investments of SCBs, thus, increased to Rs.1,33,017 crore on January 4, 2008 from Rs.84,223 crore at end-March 2007 and Rs. 95,975 crore a year ago. Banks' balances with the Reserve Bank expanded, reflecting the impact of the increase in their NDTL as well as the increase in the CRR. Investments by SCBs in non-SLR securities (such as shares/bonds/commercial papers) increased substantially during the year. As regards banks' exposure to the external sector, while banks' overseas borrowings expanded, their holdings of foreign currency assets declined.
Table 22 : Select Sources of Funds to Industry |
(Rupees Crore) |
Item |
Variation During |
|
2005-06 |
2006-07 |
2006-07 |
2007-08 |
|
|
|
Q1 |
Q2 |
Q3 |
Q4 |
Q1 |
Q2 |
Q3 |
1 |
2 |
3 |
4 |
5 |
6 |
7 |
8 |
9 |
10 |
A. Bank Credit to Industry # |
1,26,804 |
1,41,543 |
-2,336 |
49,290 |
28,415 |
66,174 |
-15,603 |
59,776 |
13,933 * |
B. Flow from Non-banks to Corporates |
|
|
|
|
|
|
|
|
|
|
1. Capital Issues (i+ii) |
13,781 |
29,180 |
10,627 |
1,882 |
10,840 |
5,831 |
13,788 |
6,226 |
14,400 |
|
|
i) Non-Government Public Ltd. |
|
|
|
|
|
|
|
|
|
|
|
Companies (a+b) |
13,408 |
29,180 |
10,627 |
1,882 |
10,840 |
5,831 |
13,261 |
4,236 |
14,400 |
|
|
a) Bonds/Debentures |
245 |
585 |
0 |
0 |
491 |
94 |
0 |
0 |
0 |
|
|
b) Shares |
13,163 |
28,595 |
10,627 |
1,882 |
10,349 |
5,737 |
13,261 |
4,236 |
14,400 |
|
|
ii) PSUs and Government Companies |
373 |
0 |
0 |
0 |
0 |
0 |
527 |
1,990 |
0 |
|
2. |
ADR/GDR Issues |
7,263 |
16,184 |
4,965 |
2,130 |
924 |
8,165 |
1,251 |
9,899 |
289 |
|
3. |
External Commercial Borrowings (ECBs) |
52,877 |
1,04,046 |
24,063 |
20,867 |
26,036 |
33,080 |
37,321 |
29,604 |
- |
|
4. |
Issue of CPs |
-1,517 |
4,970 |
6,931 |
4,795 |
-908 |
-5,848 |
8,568 |
7,358 |
7,811 @ |
C. |
Depreciation Provision + |
28,961 |
37,095 |
8,449 |
8,892 |
9,172 |
10,338 |
10,173 |
10,576 |
- |
D. |
Profit after Tax + |
60,236 |
1,11,107 |
24,845 |
27,710 |
28,698 |
31,251 |
32,699 |
34,266 |
- |
- : Not Available. *: Up to November 23, 2007.
@: Up to December 15, 2007.
# : Data pertain to select scheduled commercial banks. Figures for 2005-06 are not comparable with those for the latter period due to increase in number of banks selected in the sample.
+ : Data for 2005-06 are based on audited balance sheet, while those for 2006-07 and 2007-08 are based on abridged finanicial result of the select non-Government non-financial public limited companies. The quaterly data may not add up to annual data due to differences in the number and composition of companies covered in each period.
Note:
1. Data are provisional.
2. Data on capital issues pertain to gross issuances excluding issues by banks and financial institutions and are not adjusted
for banks' investments in capital issues, which are not expected to be significant.
3. Data on ADR/GDR issues exclude issuances by banks and financial institutions.
4. Data on external commercial borrowings include short-term credit. Data for 2005-06 are exclusive of the IMD redemption. |
Table 23 : Scheduled Commercial Bank’s Survey |
(Amount in Rupees Crore) |
Item |
|
Variation (Year-on-Year) |
|
Outstanding as on Jan. |
As on Jan. 05, 2007 |
As on Jan.
04, 2008 |
|
04, 2008 |
Amount |
Per Cent |
Amount |
Per Cent |
1 |
2 |
3 |
4 |
5 |
6 |
Sources of Funds |
|
|
|
|
|
1. Aggregate Deposits |
29,88,207 |
4,44,241 |
22.9 |
6,00,761 |
25.2 |
2. Call/Term Funding from Financial |
|
|
|
|
|
Institutions |
91,561 |
2,499 |
3.1 |
7,699 |
9.2 |
3. Overseas Foreign Currency |
|
|
|
|
|
Borrowings |
33,863 |
-4,991 |
-16.2 |
8,116 |
31.5 |
4. Capital |
38,768 |
2,620 |
8.8 |
6,301 |
19.4 |
5. Reserves |
2,20,432 |
25,750 |
18.4 |
54,493 |
32.8 |
Uses of Funds |
|
|
|
|
|
1. Bank Credit |
21,46,518 |
4,16,401 |
30.8 |
3,80,356 |
21.5 |
of which: Non-food Credit |
21,05,235 |
4,16,418 |
31.9 |
3,82,155 |
22.2 |
2. Investments in Government and |
|
|
|
|
|
Other Approved Securities |
9,54,889 |
42,836 |
5.9 |
1,89,349 |
24.7 |
a) Investments in Government Securities |
9,35,579 |
45,379 |
6.4 |
1,85,524 |
24.7 |
b) Investments in Other Approved Securities |
19,310 |
-2,543 |
-14.1 |
3,825 |
24.7 |
3. Investments in non-SLR Securities |
1,73,749 |
10,650 |
8.4 |
35,623 |
25.8 |
4. Foreign Currency Assets |
31,243 |
12,122 |
30.8 |
-20,236 |
-39.3 |
5. Balances with the RBI |
2,29,581 |
29,223 |
28.9 |
99,241 |
76.1 |
Note: Data are provisional. |
Reserve Money Survey
Reserve money growth at 30.6 per cent, y-o-y, as on January 18, 2008 was higher than 20.0 per cent a year ago (Chart 12). Adjusted for first round effect1 of the hike in CRR, the reserve money growth was 21.5 per cent as
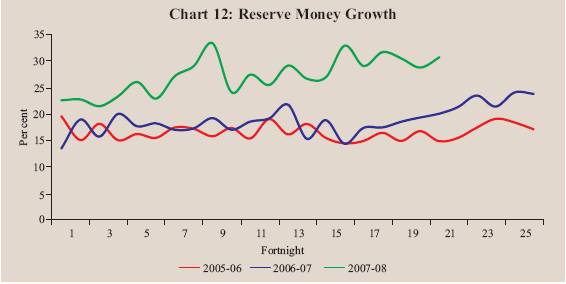
compared with 17.5 per cent a year ago. Intra-year movements in reserve money largely reflected the Reserve Bank's market operations and hikes in the CRR.
Growth in reserve money during the financial year 2007-08 (up to January 18, 2008) was 18.2 per cent (11.6 per cent adjusted for the first round effect of the hikes in the CRR) as compared with 12.0 per cent in the corresponding period of 2006-07. Bankers' deposits with the Reserve Bank expanded by 35.4 per cent during 2007-08 (up to January 18, 2008) as compared with 9.1 per cent during the corresponding period of 2006-07 mainly reflecting the hike in the CRR by 150 basis points during April-December, 2007. Currency in circulation expanded by 12.3 per cent as compared with 13.4 per cent during the corresponding period of the previous year (Table 24).
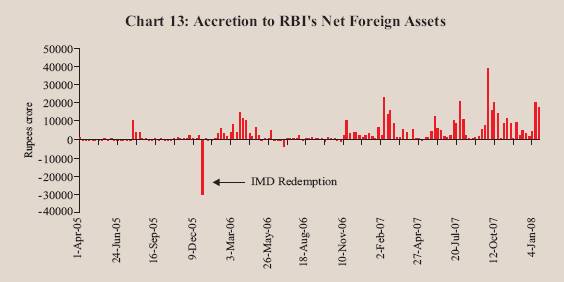
Expansion in reserve money during 2007-08 (up to January 18, 2008) continued to be driven largely by foreign currency assets (adjusted for revaluation), which rose by Rs.3,11,941 crore as compared with Rs.80,166 crore during the corresponding period of the previous year (Chart 13).
Movements in the Reserve Bank's net credit to the Central Government largely reflected the liquidity management operations by the Reserve Bank and movements in Government deposits with the Reserve Bank. Reserve Bank's holdings of Central Government dated securities declined on account of absorption of liquidity in recent period under the liquidity adjustment facility (LAF). The sterilisation operations of the Reserve Bank under the MSS led to an increase in Central Government deposits with the Reserve Bank. Surplus balances of the Central Government with the Reserve Bank also increased. Reflecting these developments, the Reserve Bank's net credit to the Centre declined by Rs.1,57,815 crore during 2007-08 (up to January 18, 2008) as against an increase of Rs. 6,963 crore during the corresponding period of the previous year.
Table 24 : Reserve Money - Variations |
(Amount in Rupees Crore) |
|
2006-07 |
2006-07 |
2007-08 |
Variation |
|
April- |
up to |
up to |
2006-07 |
2007-08 |
| |
March |
Jan. 19 |
Jan. 18 |
Q1 |
Q2 |
Q3 |
Q4 |
Q1 |
Q2 |
Q3 |
1 |
2 |
3 |
4 |
5 |
6 |
7 |
8 |
9 |
10 |
11 |
Reserve Money |
1,35,961 |
68,764 |
1,29,034 |
13,466 |
18,665 |
14,204 |
89,626 |
11,604 |
60,688 |
26,414 |
|
(23.7) |
(12.0) |
(18.2) |
|
|
|
|
|
|
|
Components (1+2+3) |
|
|
|
|
|
|
|
|
|
|
1. |
Currency in Circulation |
73,549 |
57,726 |
61,964 |
22,283 |
-2,011 |
26,871 |
26,405 |
16,840 |
-13,297 |
46,539 |
|
|
(17.1) |
(13.4) |
(12.3) |
|
|
|
|
|
|
|
2. |
Bankers' Deposits with RBI |
61,784 |
12,319 |
69,760 |
-7,204 |
20,224 |
-12,165 |
60,929 |
-4,800 |
75,464 |
-19,369 |
|
|
(45.6) |
(9.1) |
(35.4) |
|
|
|
|
|
|
|
3. |
'Other' Deposits with the RBI |
628 |
-1,280 |
-2,690 |
-1,613 |
452 |
-502 |
2,291 |
-436 |
-1,479 |
-756 |
|
|
(9.1) |
(-18.6) |
(-35.9) |
|
|
|
|
|
|
|
Sources (1+2+3+4-5) |
|
|
|
|
|
|
|
|
|
|
1. |
RBI's net credit to Government |
-2,384 |
4,106 |
-1,61,631 |
53 |
2,826 |
-12,754 |
7,490 |
-25,483 |
-54,695 |
-65,787 |
|
of which: to Centre (i+ii+iii+iv-v) |
-3,024 |
6,963 |
-1,57,815 |
3,071 |
2,584 |
-12,568 |
3,889 |
-21,825 |
-55,588 |
-65,078 |
|
i. Loans and Advances |
0 |
0 |
0 |
0 |
0 |
0 |
0 |
0 |
0 |
0 |
|
ii. Treasury Bills held by the RBI |
0 |
0 |
0 |
0 |
0 |
0 |
0 |
0 |
0 |
0 |
|
iii.RBI's Holdings of Dated |
|
|
|
|
|
|
|
|
|
|
|
Securities |
26,763 |
10,615 |
-52,149 |
-27,610 |
24,944 |
22,733 |
6,696 |
-34,284 |
4,019 |
20,874 |
|
iv. RBI's Holdings of Rupee coins |
-143 |
-37 |
93 |
9 |
-107 |
97 |
-142 |
128 |
20 |
3 |
|
v. Central Government Deposits |
29,644 |
3,615 |
1,05,759 |
-30,672 |
22,253 |
35,398 |
2,665 |
-12,330 |
59,627 |
85,956 |
2. |
RBI's credit to banks and |
|
|
|
|
|
|
|
|
|
|
|
commercial sector |
1,990 |
2,528 |
-3,282 |
-3,135 |
3,107 |
2,065 |
-47 |
-6,450 |
-1256 |
848 |
3. |
NFEA of RBI |
1,93,170 |
1,14,337 |
2,51,026 |
71,845 |
11,392 |
27,250 |
82,682 |
-2,745 |
1,19,430 |
94,681 |
|
|
(28.7) |
(17.0 ) |
(29.0) |
|
|
|
|
|
|
|
|
of which: |
|
|
|
|
|
|
|
|
|
|
|
FCA, adjusted for revaluation |
1,64,601 |
80,166 |
3,11,941 |
28,107 |
10,948 |
31,634 |
93,913 |
47,728 |
1,18,074 |
1,00,888 |
4. |
Governments' Currency Liabilities |
|
|
|
|
|
|
|
|
|
|
|
to the Public |
-467 |
-550 |
564 |
-920 |
155 |
166 |
132 |
140 |
354 |
70 |
5. |
Net Non-Monetary liabilities of RBI |
56,347 |
51,657 |
-42,357 |
54,376 |
-1,184 |
2,524 |
632 |
-46,142 |
3,145 |
3,398 |
Memo: |
|
|
|
|
|
|
|
|
|
|
LAF- Repos (+) / Reverse Repos (-) |
36,435 |
19,060 |
-41,120 |
-23,060 |
28,395 |
22,195 |
8,905 |
-32,182 |
9,067 |
16,300 |
Net Open Market Sales # * |
5,125 |
3,656 |
-1,793 |
1,536 |
1,176 |
389 |
2,024 |
1,246 |
1,560 |
-3,919 |
Centre's Surplus |
1,164 |
-400 |
9,658 |
-27,320 |
13,313 |
38,713 |
-23,542 |
-34,597 |
15,376 |
54,765 |
Mobilisation under MSS |
33,912 |
11,429 |
98,084 |
4,062 |
8,940 |
-3,315 |
24,225 |
19,643 |
48,856 |
31,192 |
Net Purchases(+)/Sales(-) |
|
|
|
|
|
|
|
|
|
|
from Authorised Dealers |
1,18,994 |
48,402 |
2,15,605 ^ |
21,545 |
0 |
19,776 |
77,673 |
38,873 |
1,01,814 |
74,918 ^ |
NFEA/Reserve Money @ |
122.2 |
122.7 |
133.3 |
127.0 |
125.0 |
126.5 |
122.2 |
119.8 |
125.8 |
133.4 |
NFEA/Currency @ |
171.8 |
161.2 |
197.3 |
164.4 |
167.7 |
164.0 |
171.8 |
165.7 |
193.6 |
194.4 |
NFEA: Net Foreign Exchange Assets.
FCA: Foreign Currency Assets.
LAF: Liquidity Adjustment Facility.
*: At face value.
# : Excludes Treasury Bills
@ : Per cent, end of period.
^ : Up to November 23, 2007
Note: 1. Data are based on March 31 for Q4 and last reporting Friday for all other quarters.
2. Figures in parentheses are percentage variations during the fiscal year. |
Liquidity Management
The Reserve Bank continued to ensure the maintenance of appropriate liquidity in the system during 2007-08 so far such that all legitimate requirements of credit were met, particularly for productive purposes, consistent with the objective of price and financial stability. In order to achieve this objective, the Reserve Bank used the various policy instruments at its disposal
in a flexible manner to manage liquidity. Capital flows and variation in cash balances of the Central Government remained the key drivers of liquidity conditions.
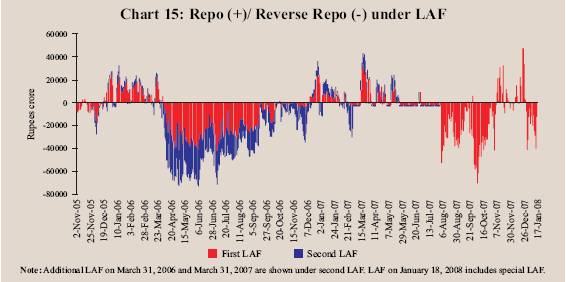
The first quarter of 2007-08 was generally characterised by easy liquidity conditions interspersed with transient periods of tightness (Table 25). The LAF operations shifted gradually from an injection mode to an absorption mode. However, as the liquidity absorption through reverse repos had been capped at Rs. 3,000 crore under the modified arrangement of LAF between March 5 and August 5, 2007, the Reserve Bank predominantly managed liquidity through the two-stage 50 basis points increase in CRR in April 2007 and increased issuances of government securities under the MSS. The ceiling for outstandings under the MSS was raised from Rs.80,000 crore to Rs.1,10,000 crore on April 27, 2007 (Chart 14). The brief periods of liquidity tightness witnessed during this quarter were assuaged through repos under LAF (Chart 15).
In the second quarter, consequent upon the withdrawal of the ceiling on daily reverse repos under the LAF with effect from August 6, 2007, the Reserve Bank absorbed liquidity through large daily reverse repos under LAF in addition to sizeable absorptions under MSS. The ceiling for outstandings under the MSS was raised to Rs.1,50,000 crore in August 2007. The cumulative impact of the hike in CRR by 50 basis points to 7.0 per cent in August 2007 and also market operations under the MSS moderated the daily reverse repos bids by the close of the quarter. The liquidity conditions mostly remained easy in early September 2007 due to decline in Government cash balances. Some tightness was, however, observed during the end of the month mainly on account of quarterly advance tax outflows and there were liquidity injections through repo window on September 21 and 28, 2007.
Table 25 : Reserve Banks’ Liquidity Management Operations |
(Amount in Rupees Crore) |
|
Variation |
|
2006-07April- |
2006-07 |
2007-08 |
| |
March |
Q1 |
Q2 |
Q3 |
Q4 |
Q1 |
Q2 |
Q3 |
Oct. |
Nov. |
Dec. |
1 |
2 |
3 |
4 |
5 |
6 |
7 |
8 |
9 |
10 |
11 |
12 |
A. Drivers of
Liquidity (1+2+3+4+5) |
61,739 |
36,247 |
-16,896 |
-25,641 |
68,028 |
51,924 |
1,10,645 |
- |
37,306 |
3,531 |
- |
|
1.RBI's net Purchases
from |
|
|
|
|
|
|
|
|
|
|
|
|
Authorised Dealers |
1,18,994 |
21,545 |
0 |
22,461 |
74,988 |
39,791 |
1,00,896 |
- |
48,795 |
31,583 |
- |
|
2.Currency with
the Public |
-70,352 |
-19,648 |
-1,270 |
-27,033 |
-22,400 |
-12,143 |
8,940 |
-46,944 |
-19,187 |
-17,041 |
-10,715 |
|
3.Surplus Cash
balances of the |
|
|
|
|
|
|
|
|
|
|
|
|
Centre with the
Reserve Bank |
-1,164 |
40,207 |
-26,199 |
-30,761 |
15,590 |
49,992 |
-30,771 |
-49,820 |
7,036 |
-12,933 |
-43,923 |
|
4.WMA and OD |
0 |
0 |
0 |
0 |
0 |
15,159 |
-15,159 |
0 |
0 |
0 |
0 |
|
5.Others (residual) |
14,260 |
-5,856 |
10,574 |
9,693 |
-150 |
-40,876 |
46,739 |
- |
663 |
1,922 |
- |
B. Management of |
|
|
|
|
|
|
|
|
|
|
|
|
Liquidity (6+7+8+9) |
-24,257 |
-39,003 |
32,026 |
31,625 |
-48,905 |
-53,943 |
-68,621 |
-11,189 |
-67,009 |
6,264 |
49,556 |
|
6.Liquidity impact
of LAF Repos |
36,435 |
-35,315 |
40,650 |
33,600 |
-2,500 |
-20,290 |
-2,825 |
27,795 |
-24,205 |
19,455 |
32,545 |
|
7.Liquidity impact of OMO(Net)* |
720 |
545 |
145 |
25 |
5 |
10 |
40 |
5,260 |
0 |
0 |
5,260 |
|
8.Liquidity impact
of MSS |
-33,912 |
-4,233 |
-8,769 |
4,750 |
-25,660 |
-18,163 |
-50,336 |
-28,244 |
-42,804 |
2,809 |
11,751 |
|
9.First round liquidity
impact |
|
|
|
|
|
|
|
|
|
|
|
|
due to CRR change |
-27,500 |
0 |
0 |
-6,750 |
-20,750 |
-15,500 |
-15,500 |
-16,000 |
0 |
-16,000 |
0 |
|
|
|
|
|
|
|
|
|
|
|
|
|
C. Bank Reserves (A+B) # |
37,482 |
-2,756 |
15,130 |
5,984 |
19,123 |
-2,019 |
42,024 |
-12,937 |
-29,703 |
9,795 |
6,971 |
- :Not Available. WMA: Ways and means advances
OD: Overdraft
(+) :Indicates injection of liquidity into the banking system.
(-): Indicates absorption of liquidity from the banking system.
# :Includes vault cash with banks and adjusted for first round liquidity impact due to CRR change.
* :Adjusted for Consolidated Sinking Funds (CSF)
and including private placement.
@ :Excludes minimum cash balances withthe Reserve Bank in case of surplus.
Note :For end-March, data pertain to March 31; for all othermonths data pertain to last Friday. |
he third quarter commenced with surplus liquidity due to a decline in surplus balances of the Central Government and net purchase of foreign exchange by the Reserve Bank. Daily absorption under the LAF averaged Rs.36,665 crore in October 2007. The continued inflow of foreign capital

necessitated an upward revision in the ceiling for outstandings under MSS to Rs.2,00,000 crore on October 4, 2007 and further to Rs.2,50,000 crore on November 7, 2007.
Liquidity conditions came under some stress towards the end of October and early part of November 2007 on account of festive season currency demand and increase in Central Government balances with the Reserve Bank. Liquidity absorption under the reverse repo window of the LAF, therefore, declined to Rs.10,384 crore during November 1-11, 2007. Liquidity conditions tightened from November 12, 2007 due to impact of CRR hike of 50 basis points to 7.5 per cent with effect from the fortnight beginning November 10, 2007 and the increase in surplus balances of the Central Government. The Reserve Bank, therefore, had to inject liquidity; the average daily net liquidity injection under LAF was at Rs.10,341 crore during November 12-30, 2007. The investment of Central government surplus cash balances in dated securities (up to Rs.20,000 crore) which was temporarily suspended between October 4, 2007 and November 19, 2007 was restored with a tightening of liquidity conditions. The tight liquidity conditions continued in December 2007 on account of quarterly advance tax outflows. Average daily net injection under the LAF amounted to Rs.10,804 crore in December 2007.
Liquidity conditions started easing from the beginning of January 2008 partly on account of reduction in surplus balances of the Central Government with the Reserve Bank. The average liquidity absorption under the reverse repo was Rs.18,057 crore during January 1-23, 2008. The steady increase in MSS outstandings is reflected in the significant build up of liquidity overhang since August 2007. The outstandings under the MSS amounted to Rs.1,61,058 crore as on January 18, 2008 (Table 26).
During the course of 2007-08, the stock of Government securities in Reserve Bank's portfolio got reduced by Rs. 12,485 crore (up to January 18, 2008) mainly on account of periodic redemptions. In order to replenish its stock of Government securities the Reserve Bank resorted to purchases of government securities through open market operations, beginning December 2007. During 2007-08 (up to January 18, 2008) the total amount of Government securities purchased under open market operations was Rs. 8,070 crore. Such operations are liquidity neutral up to the amount of redemption of Government securities in the portfolio of the Reserve Bank.
Table 26 : Liquidity Management |
(Rupees crore) |
Outstanding as on
Last Friday |
LAF |
MSS |
Centre’s Surplus
with the RBI @ |
Total (2 to 4) |
1 |
2 |
3 |
4 |
5 |
2006 |
January |
-20,555 |
37,280 |
39,080 |
55,805 |
February |
-12,715 |
31,958 |
37,013 |
56,256 |
March* |
7,250 |
29,062 |
48,828 |
85,140 |
April |
47,805 |
24,276 |
5,611 |
77,692 |
May |
57,245 |
27,817 |
-1,203 |
83,859 |
June |
42,565 |
33,295 |
8,621 |
84,481 |
July |
44,155 |
38,995 |
8,770 |
91,920 |
August |
23,985 |
42,364 |
26,791 |
93,140 |
September |
1,915 |
42,064 |
34,821 |
78,800 |
October |
12,270 |
40,091 |
25,868 |
78,229 |
November |
15,995 |
37,917 |
31,305 |
85,217 |
December |
-31,685 |
37,314 |
65,582 |
71,211 |
2007 |
January |
-11,445 |
39,375 |
42,494 |
70,424 |
February |
6,940 |
42,807 |
53,115 |
1,02,862 |
March * |
-29,185 |
62,974 |
49,992 |
83,781 |
April |
-9,996 |
75,924 |
-980 |
64,948 |
May |
-4,690 |
87,319 |
-7,753 |
74,876 |
June |
-8,895 |
81,137 |
-15,159 |
57,083 |
July |
2992 |
88,010 |
-20,199 |
70,803 |
August |
16,855 |
1,06,434 |
20,807 |
1,44,096 |
September |
-6,070 |
1,31,473 |
30,771 |
1,56,174 |
October |
18,135 |
1,74,277 |
23,735 |
2,16,147 |
November |
-1,320 |
1,71,468 |
36,668 |
2,06,816 |
December |
-33,865 |
1,59,717 |
80,591 |
2,06,443 |
2008 |
January (up to Jan. 18) |
11,935 |
1,61,058 |
59,650 |
2,32,643 |
@ : Excludes minimum cash balances with the Reserve Bank in case of surplus.
* : Data pertain to March 31.
Note :
1. Negative sign in column 2 indicates injection of liquidity through LAF repo.
2. Between March 5 and August 5, 2007, daily reverse repo absorptions were restricted to a maximum of Rs.3,000 crore comprising Rs.2,000 crore in the First LAF and Rs.1,000 crore in the Second LAF.
3. Negative sign in column 4 indicates injection of liquidity through WMA/overdraft. |
1The CRR was increased by 250 basis points in stages between December 2006 and November 2007. The first round impact of the increase in CRR is estimated to have impounded banks' resources of Rs.74,500 crore.
|
 IST,
IST,


