RbiSearchHeader

Press escape key to go back

Past Searches

Theme
Theme
Text Size
Text Size
ODC_S2

RbiAnnouncementWeb

RBI Announcements
RBI Announcements

Asset Publisher

133490095

Industrial Outlook Survey of the Manufacturing Sector for Q1:2025-26

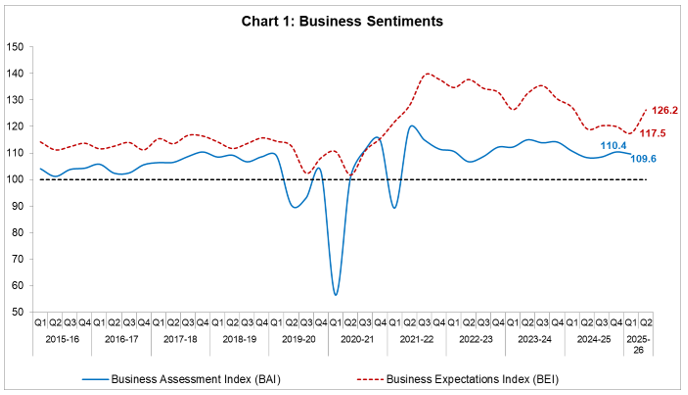
Today, the Reserve Bank released the results of 110th round of its quarterly industrial outlook survey (IOS). The survey 1 encapsulates qualitative assessment of the business climate by Indian manufacturing companies for Q1:2025-26 and their expectations for Q2:2025-26 as well as outlook on select parameters for the subsequent two quarters. A total of 1,315 companies responded in this round of the survey2 conducted during April-June 2025.

Highlights:

A. Assessment for Q1:2025-26

  • Manufacturers reported seasonal moderation in demand conditions as compared to the previous quarter, as reflected in their assessment on production, order books and capacity utilisation (Table A).
  • Input cost pressures eased marginally; however, majority of the respondents polled for increase in input costs.
  • Overall, business sentiment in the manufacturing sector as measured through business assessment index moderated during Q1:2025-26 (Chart 1).

B. Expectations for Q2:2025-26

  • Manufacturers anticipate an improvement in demand conditions as reflected in their improved expectations on production, order books, capacity utilisation and exports.
  • Pressures from input costs are expected to remain elevated, while pressures from finance cost and salary outgo are likely to ease.
  • Selling prices and profit margin are expected to improve, supported by optimistic demand conditions.
  • Business expectations index improved to 126.2 in Q2:2025-26 from its level of 117.5 in Q1:2025-26 (Chart 1).
Chart_1

C. Expectations for Q3:2025-26 and Q4:2025-26

  • Manufacturers remain highly optimistic on production, order books, capacity utilisation and overall business situation during Q3 and Q4:2025-26 (Table B).
  • Input cost pressures are likely to persist for manufacturers, they also expect pricing power to pass on the rise in selling prices.

Table A: Summary of Net responses3 on Survey Parameters

(per cent)

Parameters

Assessment period

Expectation period

Q4:2024-25*

Q1:2025-26

Q1:2025-26*

Q2:2025-26

Production

27.9

21.4

36.9

53.3

Order Books

24.4

19.9

35.6

52.1

Pending Orders

6.2

12.3

2.5

1.7

Capacity Utilisation

18.7

16.0

31.0

43.8

Inventory of Raw Materials

-6.4

3.0

-8.7

-12.1

Inventory of Finished Goods

-7.9

2.6

-9.1

-12.5

Exports

13.5

10.9

18.4

34.7

Imports

12.3

10.7

16.1

33.2

Employment

12.0

10.6

12.9

23.7

Financial Situation (Overall)

27.0

21.0

36.3

53.9

Availability of Finance
(from internal accruals)

22.3

20.1

30.4

46.5

Availability of Finance
(from banks & other sources)

15.1

16.4

21.7

40.7

Availability of Finance
(from overseas, if applicable)

3.8

7.6

9.7

32.4

Cost of Raw Material

-47.2

-46.6

-40.1

-54.9

Cost of Finance

-10.8

-7.2

-12.8

-12.5

Salary/ Other Remuneration

-18.0

-27.1

-36.8

-31.6

Selling Price

4.4

6.8

12.5

23.8

Profit Margin

-9.5

-5.0

7.0

20.1

Overall Business Situation

28.4

18.0

38.8

51.5


Table B: Business Expectations on Select Parameters for extended period – Net response

(per cent)

Parameters

Round 109

Round 110

Q1:2025-26

Q2:2025-26

Q3:2025-26

Q4:2025-26

Overall Business Situation

38.8

51.5

60.8

62.0

Production

36.9

53.3

60.2

62.2

Order Books

35.6

52.1

58.7

59.6

Capacity Utilisation

31.0

43.8

56.3

57.2

Employment

12.9

23.7

27.0

27.9

Cost of Raw Materials

-40.1

-54.9

-57.1

-55.8

Selling Prices

12.5

23.8

26.8

27.6

Note: Please see the excel file for time series data

Table 1: Assessment and Expectations for Production
(Percentage responses)@

Quarter

Assessment

Expectations

Increase

Decrease

No change

Net response

Increase

Decrease

No change

Net response

Q1:2024-25

41.4

13.6

45.0

27.9

60.0

6.0

34.0

54.0

Q2:2024-25

37.6

14.7

47.7

22.9

40.7

4.3

55.0

36.3

Q3:2024-25

42.4

16.2

41.5

26.2

40.5

4.3

55.2

36.3

Q4:2024-25

40.9

13.0

46.1

27.9

42.8

4.2

52.9

38.6

Q1:2025-26

33.6

12.1

54.3

21.4

41.4

4.6

54.0

36.9

Q2:2025-26


56.8

3.6

39.6

53.3

‘Increase’ in production is optimistic.    

@:Due to rounding off Percentage may not add up to 100.

 
Table 2: Assessment and Expectations for Order Books
(Percentage responses)
Quarter Assessment Expectations
Increase Decrease No change Net response Increase Decrease No change Net response

Q1:2024-25

39.9

14.3

45.9

25.6

57.1

6.0

36.9

51.1

Q2:2024-25

35.3

15.8

48.9

19.5

39.4

4.2

56.3

35.2

Q3:2024-25

40.0

18.1

41.8

21.9

38.1

4.8

57.0

33.3

Q4:2024-25

38.2

13.8

48.0

24.4

41.6

4.7

53.7

36.8

Q1:2025-26

32.3

12.4

55.3

19.9

40.7

5.1

54.2

35.6

Q2:2025-26


56.1

3.9

40.0

52.1

‘Increase’ in order books is optimistic. Footnote ‘@’ given in Table 1 is applicable here.   

 
Table 3: Assessment and Expectations for Pending Orders
(Percentage responses)
Quarter Assessment Expectations
Above Normal Below Normal Normal Net response Above Normal Below Normal Normal Net response

Q1:2024-25

5.7

11.6

82.7

5.9

6.4

8.1

85.5

1.8

Q2:2024-25

3.1

11.1

85.8

8.0

4.2

6.0

89.8

1.8

Q3:2024-25

4.4

14.8

80.8

10.4

3.8

5.6

90.5

1.8

Q4:2024-25

4.9

11.1

84.0

6.2

4.5

11.6

83.9

7.1

Q1:2025-26

4.4

16.8

78.8

12.3

4.3

6.8

88.9

2.5

Q2:2025-26


3.5

5.2

91.4

1.7

Pending orders ‘Below Normal’ is optimistic. Footnote ‘@’ given in Table 1 is applicable here.

 
Table 4: Assessment and Expectations for Capacity Utilisation (Main Product)
(Percentage responses)
Quarter Assessment Expectations
Increase Decrease No change Net response Increase Decrease No change Net response
Q1:2024-25 30.1 11.4 58.6 18.7 48.4 4.8 46.8 43.6
Q2:2024-25 25.1 10.0 65.0 15.1 33.2 4.0 62.9 29.2
Q3:2024-25 29.9 12.5 57.6 17.4 33.4 3.9 62.6 29.5
Q4:2024-25 29.1 10.3 60.6 18.7 36.2 4.1 59.6 32.1
Q1:2025-26 27.4 11.4 61.2 16.0 35.4 4.4 60.1 31.0
Q2:2025-26         49.0 5.1 45.9 43.8
  ‘Increase’ in capacity utilisation is optimistic. Footnote ‘@’ given in Table 1 is applicable here.
 
Table 5: Level of capacity utilisation (compared to the average in preceding 4 quarters)
(Percentage responses)
Quarter Assessment Expectations
Above Normal Below Normal Normal Net response Above Normal Below Normal Normal Net response

Q1:2024-25

16.2

11.7

72.1

4.6

22.5

7.1

70.4

15.4

Q2:2024-25

14.9

8.1

77.0

6.8

13.1

4.7

82.2

8.4

Q3:2024-25

12.0

11.2

76.7

0.8

14.4

3.8

81.8

10.5

Q4:2024-25

10.9

8.5

80.6

2.3

12.5

4.4

83.0

8.1

Q1:2025-26

18.2

14.0

67.8

4.2

9.7

4.6

85.6

5.1

Q2:2025-26


18.8

5.1

76.1

13.7

‘Above Normal’ in Level of capacity utilisation is optimistic. Footnote ‘@’ given in Table 1 is applicable here.

 
Table 6: Assessment and Expectations for Assessment of Production Capacity (with regard to expected demand in next 6 months)
(Percentage responses)
Quarter Assessment Expectations
More than adequate Less than adequate Adequate Net response More than adequate Less than adequate Adequate Net response

Q1:2024-25

9.8

3.2

87.0

6.6

27.2

4.7

68.1

22.5

Q2:2024-25

6.9

2.1

90.9

4.8

14.7

2.5

82.8

12.3

Q3:2024-25

8.8

3.7

87.5

5.0

12.8

1.5

85.7

11.3

Q4:2024-25

9.1

2.4

88.5

6.7

11.1

2.8

86.1

8.3

Q1:2025-26

9.0

10.2

80.8

-1.1

12.1

1.7

86.2

10.4

Q2:2025-26


18.6

2.7

78.8

15.9

More than adequate’ in Assessment of Production Capacity is optimistic. Footnote ‘@’ given in Table 1 is applicable here.

 
Table 7: Assessment and Expectations for Exports
(Percentage responses)
Quarter Assessment Expectations
Increase Decrease No change Net response Increase Decrease No change Net response

Q1:2024-25

23.7

12.8

63.4

10.9

41.6

5.5

52.9

36.1

Q2:2024-25

18.4

13.2

68.4

5.3

29.2

4.4

66.4

24.8

Q3:2024-25

22.1

14.5

63.4

7.6

31.2

5.0

63.9

26.2

Q4:2024-25

23.0

9.5

67.6

13.5

29.2

4.9

65.9

24.2

Q1:2025-26

22.5

11.6

65.9

10.9

23.4

5.0

71.6

18.4

Q2:2025-26


38.8

4.0

57.2

34.7

‘Increase’ in exports is optimistic. Footnote ‘@’ given in Table 1 is applicable here.

 
Table 8: Assessment and Expectations for Imports
(Percentage responses)
Quarter Assessment Expectations
Increase Decrease No change Net response Increase Decrease No change Net response

Q1:2024-25

23.7

12.8

63.4

10.9

41.6

5.5

52.9

36.1

Q2:2024-25

18.4

13.2

68.4

5.3

29.2

4.4

66.4

24.8

Q3:2024-25

22.1

14.5

63.4

7.6

31.2

5.0

63.9

26.2

Q4:2024-25

23.0

9.5

67.6

13.5

29.2

4.9

65.9

24.2

Q1:2025-26

22.5

11.6

65.9

10.9

23.4

5.0

71.6

18.4

Q2:2025-26


38.8

4.0

57.2

34.7

‘Increase’ in exports is optimistic. Footnote ‘@’ given in Table 1 is applicable here.

 
Table 9: Assessment and Expectations for level of Raw Materials Inventory
(Percentage responses)
Quarter Assessment Expectations
Above average Below average average Net response Above average Below average average Net response

Q1:2024-25

11.9

6.0

82.1

-5.9

20.2

3.9

75.9

-16.3

Q2:2024-25

8.8

6.1

85.1

-2.7

10.7

2.3

87.0

-8.3

Q3:2024-25

11.0

5.0

84.0

-6.0

11.9

2.3

85.8

-9.6

Q4:2024-25

11.3

4.9

83.8

-6.4

9.8

2.3

88.0

-7.5

Q1:2025-26

7.9

10.9

81.2

3.0

11.0

2.3

86.7

-8.7

Q2:2025-26


14.9

2.9

82.2

-12.1

‘Below average’ Inventory of raw materials is optimistic. Footnote ‘@’ given in Table 1 is applicable here.

 
Table 10: Assessment and Expectations for level of Finished Goods Inventory
(Percentage responses)
Quarter Assessment Expectations
Above average Below average average Net response Above average Below average average Net response

Q1:2024-25

11.9

6.4

81.7

-5.5

20.1

3.9

75.9

-16.2

Q2:2024-25

9.5

6.5

84.0

-3.0

10.3

2.6

87.1

-7.7

Q3:2024-25

11.9

5.1

83.0

-6.8

12.1

2.2

85.8

-9.9

Q4:2024-25

12.6

4.7

82.7

-7.9

11.1

2.2

86.8

-8.9

Q1:2025-26

8.5

11.1

80.4

2.6

10.9

1.7

87.4

-9.1

Q2:2025-26


15.3

2.9

81.8

-12.5

‘Below average’ Inventory of finished goods is optimistic. Footnote ‘@’ given in Table 1 is applicable here.

 
Table 11: Assessment and Expectations for Employment Outlook
(Percentage responses)
Quarter Assessment Expectations
Increase Decrease No change Net response Increase Decrease No change Net response

Q1:2024-25

18.5

7.3

74.1

11.2

31.3

2.2

66.5

29.1

Q2:2024-25

15.9

6.2

77.9

9.7

17.7

2.1

80.2

15.6

Q3:2024-25

17.3

7.2

75.5

10.2

19.3

1.6

79.1

17.6

Q4:2024-25

17.4

5.4

77.2

12.0

18.0

1.2

80.8

16.7

Q1:2025-26

16.8

6.3

76.9

10.6

14.6

1.7

83.7

12.9

Q2:2025-26


25.4

1.8

72.8

23.7

‘Increase’ in employment is optimistic. Footnote ‘@’ given in Table 1 is applicable here.

 
Table 12: Assessment and Expectations for Overall Financial Situation
(Percentage responses)
Quarter Assessment Expectations
Better Worsen No change Net response Better Worsen No change Net response

Q1:2024-25

40.9

12.4

46.7

28.5

59.2

5.2

35.6

54.0

Q2:2024-25

37.5

11.9

50.6

25.6

44.7

2.5

52.8

42.2

Q3:2024-25

38.0

13.1

49.0

24.9

49.1

2.7

48.1

46.4

Q4:2024-25

37.0

10.1

52.9

27.0

44.8

3.0

52.2

41.9

Q1:2025-26

31.8

10.8

57.4

21.0

39.0

2.6

58.4

36.3

Q2:2025-26


57.0

3.0

40.0

53.9

‘Better’ overall financial situation is optimistic. Footnote ‘@’ given in Table 1 is applicable here.

 
Table 13: Assessment and Expectations for Working Capital Finance Requirement
(Percentage responses)
Quarter Assessment Expectations
Increase Decrease No change Net response Increase Decrease No change Net response

Q1:2024-25

31.6

6.5

61.9

25.1

46.6

3.0

50.4

43.6

Q2:2024-25

24.1

4.7

71.2

19.4

32.0

2.1

66.0

29.9

Q3:2024-25

26.9

6.5

66.6

20.3

32.4

1.2

66.5

31.2

Q4:2024-25

24.3

5.1

70.6

19.2

30.9

2.3

66.8

28.6

Q1:2025-26

21.0

4.5

74.5

16.4

25.5

2.7

71.8

22.9

Q2:2025-26


33.4

1.9

64.6

31.5

‘Increase’ in working capital finance is optimistic. Footnote ‘@’ given in Table 1 is applicable here.

 
Table 14: Assessment and Expectations for Availability of Finance (from Internal Accruals)
(Percentage responses)
Quarter Assessment Expectations
Improve Worsen No change Net response Improve Worsen No change Net response

Q1:2024-25

29.5

6.5

64.0

23.0

47.7

2.9

49.4

44.8

Q2:2024-25

23.5

5.4

71.1

18.1

33.0

1.2

65.9

31.8

Q3:2024-25

31.1

6.4

62.4

24.7

32.9

0.8

66.3

32.1

Q4:2024-25

27.8

5.5

66.6

22.3

35.8

1.3

62.9

34.6

Q1:2025-26

25.5

5.4

69.1

20.1

31.7

1.3

67.0

30.4

Q2:2025-26


47.8

1.3

50.8

46.5

‘Improvement’ in availability of finance is optimistic. Footnote ‘@’ given in Table 1 is applicable here.

 
Table 15: Assessment and Expectations for Availability of Finance (from banks and other sources)
(Percentage responses)
Quarter Assessment Expectations
Improve Worsen No change Net response Improve Worsen No change Net response

Q1:2024-25

25.9

5.9

68.3

20.0

43.2

2.8

54.0

40.5

Q2:2024-25

18.7

4.3

77.0

14.4

28.7

1.4

69.9

27.2

Q3:2024-25

23.5

4.5

72.0

18.9

27.4

0.7

72.0

26.7

Q4:2024-25

19.8

4.7

75.5

15.1

27.9

0.8

71.3

27.1

Q1:2025-26

20.3

3.9

75.8

16.4

23.0

1.3

75.7

21.7

Q2:2025-26


41.2

0.5

58.3

40.7

‘Improvement’ in availability of finance is optimistic. Footnote ‘@’ given in Table 1 is applicable here.

 
Table 16: Assessment and Expectations for Availability of Finance (from overseas, if applicable)
(Percentage responses)
Quarter Assessment Expectations
Improve Worsen No change Net response Improve Worsen No change Net response

Q1:2024-25

16.2

6.5

77.3

9.8

35.9

2.7

61.5

33.2

Q2:2024-25

9.4

4.3

86.4

5.1

18.1

1.2

80.7

16.9

Q3:2024-25

13.9

5.9

80.3

8.0

20.6

0.4

79.0

20.2

Q4:2024-25

8.5

4.7

86.8

3.8

19.0

1.0

79.9

18.0

Q1:2025-26

11.6

3.9

84.5

7.6

10.7

1.0

88.3

9.7

Q2:2025-26


32.9

0.5

66.5

32.4

‘Improvement’ in availability of finance is optimistic. Footnote ‘@’ given in Table 1 is applicable here.

 
Table 17: Assessment and Expectations for Cost of Finance
(Percentage responses)
Quarter Assessment Expectations
Increase Decrease No change Net response Increase Decrease No change Net response

Q1:2024-25

23.3

6.7

70.0

-16.6

40.3

4.1

55.6

-36.3

Q2:2024-25

14.3

4.1

81.6

-10.2

22.1

2.9

75.0

-19.2

Q3:2024-25

17.9

5.3

76.8

-12.6

22.2

2.0

75.8

-20.2

Q4:2024-25

14.3

3.6

82.1

-10.8

21.8

1.9

76.3

-19.9

Q1:2025-26

16.5

9.2

74.3

-7.2

15.5

2.7

81.8

-12.8

Q2:2025-26


26.1

13.6

60.2

-12.5

‘Decrease’ in cost of finance is optimistic. Footnote ‘@’ given in Table 1 is applicable here.

 
Table 18: Assessment and Expectations for Cost of Raw Materials
(Percentage responses)
Quarter Assessment Expectations
Increase Decrease No change Net response Increase Decrease No change Net response

Q1:2024-25

53.9

4.6

41.5

-49.3

55.9

3.1

40.9

-52.8

Q2:2024-25

44.5

5.8

49.8

-38.7

52.1

1.1

46.9

-51.0

Q3:2024-25

51.9

5.4

42.7

-46.5

49.2

1.6

49.3

-47.6

Q4:2024-25

50.7

3.5

45.8

-47.2

51.7

2.5

45.8

-49.2

Q1:2025-26

50.8

4.2

44.9

-46.6

41.6

1.6

56.8

-40.1

Q2:2025-26


56.2

1.2

42.6

-54.9

‘Decrease’ in cost of raw materials is optimistic. Footnote ‘@’ given in Table 1 is applicable here.

 
Table 19: Assessment and Expectations for Salary/Other Remuneration
(Percentage responses)
Quarter Assessment Expectations
Increase Decrease No change Net response Increase Decrease No change Net response

Q1:2024-25

42.9

1.2

55.9

-41.7

52.9

0.9

46.2

-51.9

Q2:2024-25

18.8

1.4

79.8

-17.4

26.7

0.6

72.7

-26.1

Q3:2024-25

18.8

1.3

79.9

-17.5

27.8

0.3

71.9

-27.4

Q4:2024-25

19.2

1.2

79.6

-18.0

23.4

0.4

76.3

-23.0

Q1:2025-26

29.3

2.2

68.5

-27.1

37.7

0.9

61.5

-36.8

Q2:2025-26


32.1

0.5

67.3

-31.6

‘Decrease’ in Salary / other remuneration is optimistic. Footnote ‘@’ given in Table 1 is applicable here.

 
Table 20: Assessment and Expectations for Selling Price
(Percentage responses)
Quarter Assessment Expectations
Increase Decrease No change Net response Increase Decrease No change Net response

Q1:2024-25

18.5

10.5

71.0

8.0

30.5

5.7

63.8

24.7

Q2:2024-25

10.9

10.7

78.4

0.2

20.3

3.1

76.5

17.2

Q3:2024-25

15.0

12.4

72.6

2.6

19.3

2.2

78.5

17.1

Q4:2024-25

14.1

9.6

76.3

4.4

19.0

3.9

77.0

15.1

Q1:2025-26

15.7

8.8

75.5

6.8

15.7

3.2

81.2

12.5

Q2:2025-26


26.4

2.6

71.1

23.8

‘Increase’ in selling price is optimistic. Footnote ‘@’ given in Table 1 is applicable here.

 
Table 21: Assessment and Expectations for Profit Margin
(Percentage responses)
Quarter Assessment Expectations
Increase Decrease No change Net response Increase Decrease No change Net response

Q1:2024-25

13.0

25.3

61.7

-12.3

30.4

10.4

59.2

20.0

Q2:2024-25

12.2

22.4

65.4

-10.2

16.7

6.8

76.4

9.9

Q3:2024-25

12.4

25.2

62.4

-12.8

19.4

5.8

74.9

13.6

Q4:2024-25

10.8

20.3

69.0

-9.5

19.0

7.3

73.7

11.7

Q1:2025-26

12.0

17.0

70.9

-5.0

14.5

7.5

78.0

7.0

Q2:2025-26


26.2

6.2

67.6

20.1

‘Increase’ in profit margin is optimistic. Footnote ‘@’ given in Table 1 is applicable here.

 
Table 22: Assessment and Expectations for Overall Business Situation
(Percentage responses)
Quarter Assessment Expectations
Better Worsen No change Net response Better Worsen No change Net response

Q1:2024-25

42.7

13.1

44.2

29.6

62.0

5.5

32.5

56.5

Q2:2024-25

39.7

13.3

47.0

26.3

47.4

2.5

50.1

45.0

Q3:2024-25

40.4

14.5

45.1

25.9

51.2

3.9

44.9

47.4

Q4:2024-25

40.7

12.3

46.9

28.4

48.6

3.1

48.3

45.4

Q1:2025-26

31.7

13.7

54.6

18.0

42.3

3.5

54.3

38.8

Q2:2025-26


56.7

5.2

38.2

51.5

‘Better’ Overall Business Situation is optimistic. Footnote ‘@’ given in Table 1 is applicable here.

 
Table 23: Business Sentiments4
(Percentage responses)
Quarter Business Assessment Index (BAI) Business Expectations Index (BEI)

Q1:2024-25

110.8

127.2

Q2:2024-25

108.3

119.1

Q3:2024-25

108.5

120.3

Q4:2024-25

110.4

120.0

Q1:2025-26

109.6

117.5

Q2:2025-26


126.2


1The survey results reflect the respondents’ views, which are not necessarily shared by the Reserve Bank.

2 Results of the previous survey round were released on the Bank’s website on April 09, 2025.

3 Net Response (NR) is the difference between the percentage of respondents reporting optimism and those reporting pessimism. It ranges between -100 to 100. Any value greater than zero indicates expansion/optimism and any value less than zero indicates contraction/pessimism. In other words, NR = (I – D), where I is the percentage response of ‘Increase/optimism’, and D is the percentage response of ‘Decrease/pessimism’ and E is the percentage response as ‘no change/equal’ (i.e., I+D+E=100).  For example, increase in production is optimism whereas decrease in cost of raw material is optimism.

4 For each survey round, two summary indices are computed – one based on assessment [viz., Business Assessment Index (BAI)] and another based on expectations [viz., Business Expectations Index (BEI)]. Each index is a composite indicator calculated as a simple average of nine business parameters, where each parameter is derived as a weighted net response, weights being the share of industry groups in gross value added (GVA). The nine parameters considered are: (1) overall business situation; (2) production; (3) order books; (4) inventory of raw material; (5) inventory of finished goods; (6) profit margins; (7) employment; (8) exports; and (9) capacity utilisation. BAI/BEI gives a snapshot of the business outlook in every quarter and takes values between 0 and 200, with 100 being the threshold separating expansion from contraction.

RbiTtsCommonUtility

प्ले हो रहा है
સાંભળો

Related Assets

RBI-Install-RBI-Content-Global

RbiSocialMediaUtility

રિઝર્વ બેંક ઑફ ઇન્ડિયા મોબાઇલ એપ્લિકેશન ઇન્સ્ટૉલ કરો અને લેટેસ્ટ ન્યૂઝનો ઝડપી ઍક્સેસ મેળવો!

Scan Your QR code to Install our app

RbiWasItHelpfulUtility

શું આ પેજ ઉપયોગી હતું?