 IST,
IST,


IV. Monetary Policy In An Open Economy (Part 3 of 3)
4.56 The third phase - 1996-2001- witnessed return of capital inflows. Although each of the year in this period was characterised by an overall surplus in the balance of payments, the phase was also marked with a few episodes, albeit brief, of heightened volatility in capital flows. The volatility was on account of both international and domestic factors - the Asian financial crisis, the spread of contagion to other markets such as Russia and Brazil, border tensions and sanctions imposed after the nuclear tests. This necessitated policy initiatives to manage the volatility in capital inflows, including monetary measures (such as increases in the Bank Rate, the repo rate and the cash reserve ratio), sales of foreign currency in the market to meet temporary demand-supply mismatches and administrative measures (Annex IV.2). Monetary measures were temporary, often reversed within a period of 2-3 months, consistent with the policy objective of ensuring orderly conditions. Recourse was four distinct phases are clearly discernible in terms of the underlying balance of payments conditions, shifts in monetary conditions and the policy responses. These are briefly discussed in the following paragraphs.
4.53 The first phase - the period 1993-95 - was characterised by strong capital inflows accompanied with stability in the exchange rate. During this period, foreign investment inflows - in particular, portfolio investment inflows in the form of foreign institutional investors’ (FII) inflows and global depository receipts (GDRs) - increased sharply. Net portfolio inflows increased from negligible levels to more than US $ 3 billion in each of the two years (Chart IV.10). Coupled with curtailment of the current account deficit, there were large overall surpluses in the balance of payments and this led to a significant increase in foreign exchange reserves from their extremely low levels of the crisis period. During this period, the rupee witnessed a remarkable stability vis-a-vis the US dollar. The Reserve Bank’s passive intervention was motivated by the need to protect expor t competitiveness by preventing an appreciation of the rupee which would in any case have been against fundamentals (RBI,1994).
4.54 Large accretions to the foreign exchange reserves led to a transformation in the composition of the Reserve Bank’s balance sheet and, hence the dynamics of the money supply process. In contrast to the trend of the 1980s, net foreign exchange assets emerged as a key driver of reserve money. As capital flows continued, a number of steps were undertaken
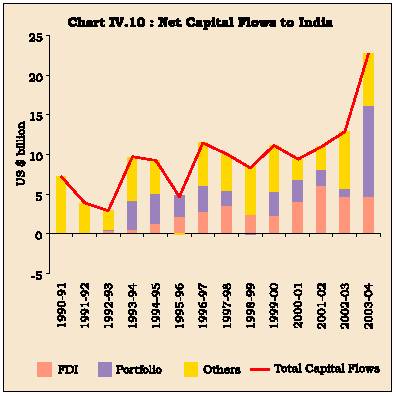
4.55 The second phase - the year 1995-96 - was characterised by a deceleration in capital inflows and a widening of the current account deficit. There was a turnaround in the foreign exchange market and the prolonged stability in the exchange rate of the rupee witnessed from March 1993 came under stress in the second half of 1995-96. In response to the upheavals, the Reserve Bank intervened in the market to signal that the fundamentals are in place and to ensure that market correction of the overvalued exchange rate was orderly and calibrated. Exchange market intervention by the Reserve Bank in the spot market was initially supported by a withdrawal of liquidity from the money market to prevent speculative attacks on the exchange rate. These measures were successful in ensuring an orderly correction in the overvaluation of the rupee.
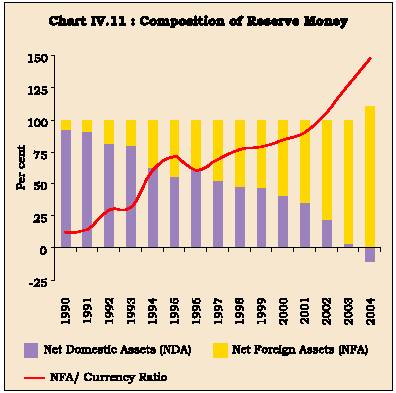
4.56 The third phase - 1996-2001- witnessed return of capital inflows. Although each of the year in this period was characterised by an overall surplus in the balance of payments, the phase was also marked with a few episodes, albeit brief, of heightened volatility in capital flows. The volatility was on account of both international and domestic factors - the Asian financial crisis, the spread of contagion to other markets such as Russia and Brazil, border tensions and sanctions imposed after the nuclear tests. This necessitated policy initiatives to manage the volatility in capital inflows, including monetary measures (such as increases in the Bank Rate, the repo rate and the cash reserve ratio), sales of foreign currency in the market to meet temporary demand-supply mismatches and administrative measures (Annex IV.2). Monetary measures were temporary, often reversed within a period of 2-3 months, consistent with the policy objective of ensuring orderly conditions. Recourse wasalso taken to mobilise deposits from non-residents through special schemes such as Resurgent India Bonds and India Millennium Deposits. Notwithstanding brief episodes of volatility, capital flows remained vastly in excess of current account deficits - which remained moderate in the face of low domestic absorption. As a result, the foreign exchange reserves increased, on an average, by nearly US $ 4.1 billion per year. During this phase, changes in reserve money were, therefore, largely dominated by the accretions to net foreign exchange assets of the Reserve Bank. As a result, the ratio of net foreign assets to reserve money increased from 38 per cent at end-March 1996 to 65 per cent by end-March 2001 (Chart IV.11).
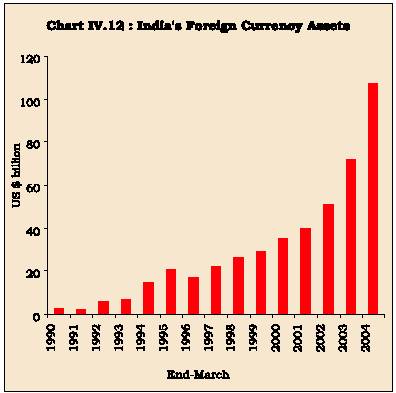
4.57 The fourth phase - 2001-02 onwards - posed new challenges for the conduct of monetary policy. This period has been marked by sustained surges in capital inflows coupled with surpluses in current account in the balance of payments. The turnaround in the current account balance was mainly due to a higher invisible surplus. On the capital account, there was unprecedented volume of net inflows. Even as debt creating flows ebbed in response to policy changes such as prepayment of high cost official debt and rationalisation of interest rates on NRI deposits, non-debt creating flows, par ticularly por tfolio investments surged ahead. With both current and capital accounts in surplus, foreign exchange markets were marked by persistent excess supply conditions. These excess supplies were absorbed by the Reserve Bank and, as a result,
its foreign exchange reserves more than doubled during the 3-year period from US$ 42.3 billion at end-March 2001 to US $ 113.0 billion at end-March 2004 - an average increase of US $ 23.6 billion per annum (Chart IV.12). Concomitantly, the ratio of net foreign assets to reserve money increased from 65 per cent at end-March 2001 to more than 100 per cent by end-March 2004. The concomitant excess supply in the foreign exchange market - reflected in the overall balance of payments surpluses - was absorbed by the Reserve Bank in line with its exchange rate and foreign exchange reserves policies. The level of reserves held by any country is, of course, really a consequence of the exchange rate policy being pursued (RBI, 2004a). The overall approach to the management of India’s foreign exchange reserves in recent years has reflected the changing composition of capital account of the balance of payments and the liquidity risks associated with different types of flows within the parameters of reserve adequacy. The policy for reserve management is built upon factors and contingencies such as the size of the current account deficit, the size of short term liabilities (including current repayment obligations on long term loans), the potential variability in portfolio investment and other types of capital flows and unanticipated external shocks. The policy objective is to ensure that excluding short-term variations in response to market movements, the quantum of reserves in the long run is in line with the growth in the economy and the size of risk adjusted capital flows. With the changing profile of capital flows, the traditional approach of assessing reserve adequacy in terms of import cover has been broadened to include a
4.58 A number of steps have been taken to offset the expansionary impact of external flows on domestic money supply. These include:
- Increase in the minimum maturity of non-resident deposits to one year to attract stable flows as also to minimise the country’s short-term external debt.
- LIBOR-linked interest rate ceilings on foreign currency denominated deposits since 1997.
- LIBOR-linked interest rate ceilings on non-resident rupee deposits effective July 2003 to provide consistency in the interest rates offered to nonresident Indians. The ceiling was initially fixed at 250 basis points above LIBOR. It was tightened and reduced to only 100 basis points above LIBOR effective September 15, 2003 and to 25 basis points above LIBOR effective October 18, 2003. The ceiling was tightened further to the LIBOR itself, effective April 17, 2004. More recently, the ceiling has been relaxed to 50 basis points above LIBOR, effective October 26, 2004. Available empirical evidence suggests that non-resident deposits are influenced by standard risk and return variables. In particular, these deposits respond favourably to changes in relative interest rates (Gordon and Gupta, 2004; Mohanty, Kapur and Sahoo, 2000).
- Substantial expansion of the automatic route of FDI abroad by Indian residents.
- Greater flexibility to corporates on pre-payment of their external commercial borrowings.
- Liberalisation of surrender requirements for exporters enabling them to hold up to 100 per cent of their proceeds in foreign currency accounts.
- Extension of foreign currency account facilities to other residents.
- Allowing banks to liberally invest abroad in high quality instruments.
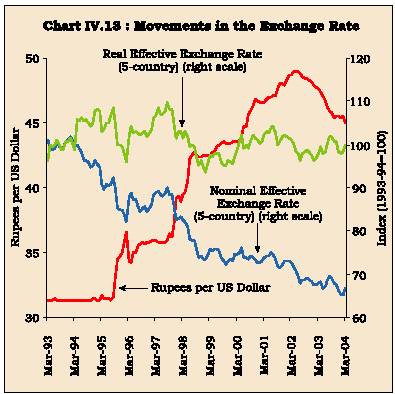
- Pre-payment of US $ 6.9 billion of debt owed to multilateral and bilateral agencies by the Government of India during 2002-03 and 2003-04. l An increase of 50 basis points in the cash reserve ratio (CRR) from 4.5 per cent to 5.0 per cent, effective October 2004. l Finally, appreciation of the nominal exchange rate of the rupee vis-à-vis the US dollar (Chart IV.13).
4.59 Notwithstanding these measures, the overall balance of payments surpluses not only persisted but also widened in each of the years since 2001-02. Accordingly, a key instrument of managing capital flows has been sterilisation through outright open market sales of Government of India securities by the Reserve Bank from its portfolio. In recent years, these have been supported by sucking of liquidity through operations under the Liquidity Adjustment Facility. The scale of sterilisation operations - in particular, in the fourth phase (2001-02 onwards) - can be gauged from movements in the outstanding net Reserve Bank credit to the Central Government (NRBICG). Although balance of payments had been recording an overall surplus in each of the years since 1993-94 (with exception of one year, 1995-96), outstanding NRBICG also increased in all years except one even as open market operations were undertaken. In contrast, in the most recent phase, NRBICG has recorded sharp declines. Illustratively, the NRBICG declined from Rs.1,67,308 crore at end-May 2001 to Rs.4,626 crore by December 10, 2004 (Table 4.12).
|
Table 4.12: Sterilisation Operations of the Reserve Bank of India |
||||||
|
(Rupees crore) |
||||||
|
Year |
Increase in Foreign |
Net Open |
Outsatanding Amount |
Balances under |
Outstanding Net |
|
|
Currency Assets |
Market Sales @ |
Absorbed under |
Market Stabilisation |
Reserve Bank |
||
|
Liquidity Adjustment |
Scheme # |
Credit to Centre |
||||
|
Facility (end-period) |
(end-period) |
(end-period) |
||||
|
1 |
2 |
3 |
4 |
5 |
6 |
|
|
1996-97 |
21,922 |
6,885 |
– |
– |
1,20,702 |
|
|
1997-98 |
22,139 |
-5,414 |
240 |
– |
1,33,617 |
|
|
1998-99 |
22,905 |
-11,857 |
200 |
– |
1,45,416 |
|
|
1999-2000 |
27,512 |
8,370 |
325 |
– |
1,39,829 |
|
|
2000-01 |
31,558 |
-11,827 |
400 |
– |
1,46,534 |
|
|
2001-02 |
64,636 |
1,443 |
3,510 |
– |
1,41,384 |
|
|
2002-03 |
92,358 |
17,605 |
2,415 |
– |
1,12,985 |
|
|
2003-04 |
1,24,739 |
20,349 |
34,645 |
– |
36,920 |
|
|
2004-05 |
(up to December 10) |
85,836 |
603 |
15,820 |
51,334 |
4,626 |
|
@ Net of devolvement/private placement on the Reserve Bank. Minus sign indicates purchases. # Market Stabilisation Scheme came in to operation effective April 2004. Source : Reserve Bank of India. |
||||||
4.60 The finite stock of the Government of India securities with the Reserve Bank brought into sharp focus the limitations on the Reserve Bank’s ability to sterilise capital flows in future and its implications for liquidity management and inflation. For instance, the Reserve Bank’s Annual Policy Statement for the year 2004-05 observed: 'the lagged effect of persistence of excess liquidity on aggregate demand cannot be ignored as it could have some potential inflationary impact'. At the same time, the challenge of sterilisation, in the Indian case, is not very acute, per se, because the large order of fiscal deficit allows the banking system to park the surplus liquidity emanating from capital flows in gilt-edged paper (Jadhav, 2003).
4.61 Against this backdrop, the Reserve Bank constituted an Internal Working Group on Instruments for Sterilisation (RBI, 2003d). The Group recommended, inter alia, that use of CRR as an instrument of sterilisation, under extreme conditions of excess liquidity and when other options are exhausted, should not be ruled out altogether by a prudent monetary authority ready to meet all eventualities2 . The Group stressed the need to take into account the consolidated balance sheet of the Government and the Reserve Bank as it is immaterial as to whether sterilisation costs are borne by the Reserve Bank or the Government since, in the consolidated balance sheet framework, the net cost is the same. Accordingly, the Group strongly recommended against the introduction of central bank bills/bonds, in the context of current fiscal situation and considerations of market fragmentation. A key recommendation of the Group was the introduction of Market Stabilisation Bills/Bonds (MSBs) for mopping up liquidity from the system. The Group also recommended that surplus balances of the Government may be maintained with the Reserve Bank without any payment of interest so as to release securities for open market operations.
4.62 Following these recommendations, a Market Stabilisation Scheme (MSS) was introduced in April 2004 wherein Government of India dated securities/Treasury Bills are being issued to absorb liquidity. These dated securities/Treasury Bills are the same as those issued for normal market borrowings and this avoids segmentation of the market. By December 10, 2004, the outstanding issuances under MSS were Rs.51,334 crore (see Chapter II). The issuance of securities under the MSS is expected to enable the Reserve Bank to improve liquidity management in the system, to maintain stability in the foreign exchange market and to conduct monetary policy in accordance with the stated objectives (Reddy, 2004b). Moreover, the MSS scheme will bring transparency in regard to costs associated with sterilisation operations. Hitherto, the costs of sterilisation were fully borne by the Reserve Bank in the first instance and its impact was transmitted to the Government in the form of lower profit transfers. With the introduction of the MSS, the cost in terms of interest payments would be borne by the Government itself in a transparent manner.
4.63 Sterilisation operations, as discussed above, have been a key instrument of managing capital flows. Reflecting these operations, the net Reserve Bank credit to the Central Government has declined in the
2 As noted earlier, effective October 2004, the CRR was raised from 4.5 per cent to 5.0 per cent, based on a review of current liquidity conditions. The medium-term policy objective of the Reserve Bank is to reduce CRR to its statutory minimum of 3.0 per cent while retaining the option to use CRR in both directions for liquidity management, as and when essential, in addition to other instruments.
recent years while net foreign assets have been increasing. In this context, a critical issue is: whether it is the reduction in net domestic assets (NDA) that caused subsequent capital inflows or whether the reduction in NDA offset the previous capital inflows. The former view would suggest that capital inflows reflect higher money demand by residents and, if so, sterilisation operations are ineffective. This would occur if sterilisation operations place upward pressure on interest rates and the assets are perfect substitutes. In this case, even a small rise in domestic interest rates would attract large capital inflows rendering sterilisation operations ineffective (Kouri and Porter, 1974; Schadler et al., 1993). For India, evidence suggests that sterilisation operations have been effective. Over the period 1995-2004, close to two-thirds of capital flows were sterilised by the Reserve Bank through open market sales/repo operations3 (Box IV.6). This enabled the Reserve Bank to keep base money growth close to the desired trajectory (Box IV.7).
Box IV.6
Capital Flows and Sterilisation
Following Kouri and Porter (1974), the ability of a central bank to carry out sterilisation operations effectively can be examined by analysing the relationship between a central bank’s net domestic assets (NDA) and its net foreign assets (NFA). The 'offset' coefficient - the response of net foreign assets to net domestic assets - measures the degree to which capital inflows offset the effect of a change in NDA on money supply. An offset coefficient close to unity would imply that the efforts of the monetary authority to tighten monetary policy would induce equal and offsetting foreign inflows leaving no scope for independent monetary policy. In contrast, an offset coefficient of zero would provide the monetary authority with complete discretion in the conduct of monetary policy. A number of studies have, therefore, attempted to estimate offset coefficients (Table 4.13). In most of the studies, offset coefficients are less than (-) 0.5 which suggests that monetary authorities have some scope for sterilisation. Moreover, consistent with the hypothesis of increasing capital mobility in the 1990s and the consequent declining monetary policy independence, there is evidence that the (absolute) offset coefficients have increased. For India, the estimated offset coefficient [(-) 0.3 during 1993-97] suggests that sterilisation operations conducted during this period enabled sufficient independence for monetary policy to pursue domestic goals (Pattanaik, 1997).
For India, available evidence indicates a uni-directional causality from NFA to NDA, i.e., capital inflows were not induced by domestic monetary conditions. The sterilisation coefficient - the response of change in NDA to that in NFA - is found to be (-) 0.92, i.e., an increase of Rs.100 in NFA induced a policy response of sterilisation that drained away NDA worth Rs.92 from the system (RBI, 2004a). All accretions to NFA do not have a monetary impact; for instance, aid receipts, revaluation and the Reserve Bank’s income on its foreign assets contribute to NFA but have no monetary impact, obviating the need for sterilisation to that extent. As such, following RBI (2004a), sterilisation efforts can be gauged by examining the impact of the Reserve Bank’s net market purchases/sales of foreign currency from/to authorised dealers (ADPURC) on the net Reserve Bank credit to the Centre (NRBICC), and not the entire NDA. For India, data on market sales/ purchases are available effective October 1995. As in the previous case, Granger causality tests indicate a unidirectional causality from changes in foreign exchange purchases to reduction in NRBICC4 . The sterilisation coefficient is 0.63, i.e., Rs.100 increase in foreign currency purchases from ADs induces sterilisation operations involving sales of Government securities worth Rs.63 from the Reserve Bank5 .
3 Such open market sales transferred the Government securities from the balance sheet of the Reserve Bank to that of the commercial banks. In an environment of softening interest rates, investment in government securities turned out to be relatively attractive and profitable for the commercial banks. At the same time, investments in government securities are subject to market risks arising from fluctuations in market rates of interest. With the upturn of the interest rate cycle, there could be an adverse impact on banks’ profitability. In this context, it is relevant to observe that the Reserve Bank had advised banks to build-up Investment Fluctuation Reserves to meet such eventualities (see Chapter VI).
4 In a bivariate VAR of net monthly sales/purchases of foreign exchange from ADs (ADPURC) and monthly variations in net Reserve Bank credit to Centre (DRBICCG) over the period October 1995 to March 2004, the null hypothesis of Granger non-causality of DRBICCG can not be rejected (chi-square of 0.03 at p-value of 0.87). On the other hand, the null hypothesis of Granger non-causality of ADPURC can be easily rejected (chi-square of 5.90 at p-value of 0.02). The VAR was estimated with one lag based on Schwarz Bayesian Information Criterion (SBIC).
|
5 |
The estimated equation, using monthly data over October 1995 to March 2004, is: |
||||
|
DRBICCG = 1233 |
- |
0.63 ADPURC - 230.1 DIIP(-1) + 5437 DCRRAVG. |
|||
|
(1.8)* |
(6.1)*** |
(2.2)* |
(6.6)*** |
||
|
– |
|||||
|
R2 = 0.55 |
DW = 2.46 |
||||
The figures in brackets are t-values; *, ** and *** denote significance at 10, 5 and 1 per cent level, respectively. DRBICCG and ADPURC are defined as before. DIIP and DCRRAVG are monthly variations in the index of industrial production and average CRR, respectively. In addition, monthly dummies for April, May, August, September and November turned out to be significant and were included in the estimated equation.
|
Table 4.13: Offset Coefficients - A Cross-Country Survey |
||
|
Study |
Country |
Offset Coefficient |
|
1 |
2 |
3 |
|
Schadler et al (1993) |
Chile |
-0.14 |
|
Colombia |
-0.5 |
|
|
Egypt |
-0.1 |
|
|
Mexico |
-0.3 |
|
|
Spain |
-0.0 |
|
|
Thailand |
-0.8 |
|
|
Kim (1995) |
Korea |
-0.37 to -0.44 |
|
(1980-94) |
||
|
Lee (1996) |
Indonesia |
-0.31 (1982-92) |
|
Korea |
-0.16 (1983-93) |
|
|
Spain |
-0.35 (1983-91) |
|
|
Thailand |
-0.94 (1982-91) |
|
|
Bond (1999) |
Indonesia |
- 0.21 (1984-89) |
|
- 0.33 (1990-95) |
||
|
Thailand |
-0.21 (1984-87) |
|
|
-0.41 (1988-95) |
||
|
Pattanaik (1997) |
India |
(-) 0.3 (1993-97) |
|
Note : Figures in brackets are the sample period. |
||
Exchange Rate Management
4.64 As noted earlier, the day-to-day movements in exchange rates have been largely market-determined. The objective of exchange rate management has been to ensure that the external value of the rupee is realistic and credible as evidenced by a sustainable current account deficit and manageable foreign exchange situation. Subject to this predominant objective, the exchange rate policy is guided by the need to reduce excess volatility, prevent the emergence of destabilising speculative activities, help maintain adequate level of reserves, and develop an orderly foreign exchange market. However, the foreign exchange market in India, like other developing countries, is not yet very deep and broad and is characterised by uneven flow of demand and supply over different periods. The market is also characterised
Box IV.7
Capital Flows and Reserve Money Dynamics
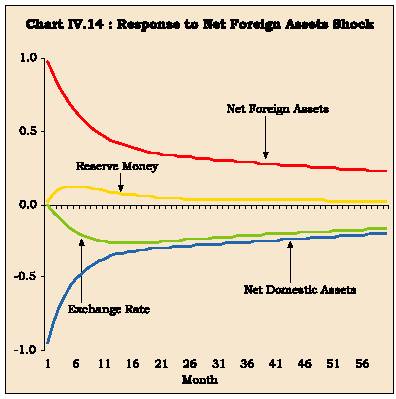
Given the large volume of capital flows and their sterilisation by the Reserve Bank, it would also be interesting to know the dynamics of the adjustment process through which shocks to exchange rate, net foreign assets and net domestic assets impinge upon each other. Following Moreno (1996), these dynamics can be examined in a vector autoregression (VAR) framework. Moreno (op cit.) undertook his analysis for Korea and Taiwan and found that sterilisation is an important element of the response to shocks to foreign assets, i.e., monetary authorities try to neutralise the effect of net foreign assets on base money. On the other hand, monetary authorities are ready to accept fluctuations in exchange rate and domestic money supply from changes in their domestic assets. This Box follows a similar methodology to examine the dynamics in the Indian context. A four-variable VAR is estimated over the period April 1994 to March 2004 using monthly data. The variables included were (in the following order): (i) exchange rate of the Indian rupee vis-a-vis the US dollar, (ii) wholesale prices, (iii) net foreign assets (NFA) of the Reserve Bank and (iv) net domestic assets (NDA) of the Reserve Bank. As noted in Box IV.6 causality runs from NFA to NDA. Accordingly, the ordering of NFA before NDA in the VAR can be considered appropriate. All the variables are in logarithmic form6 and the VAR was estimated with a trend term. Monthly dummies were included as exogenous variables to account for seasonality.
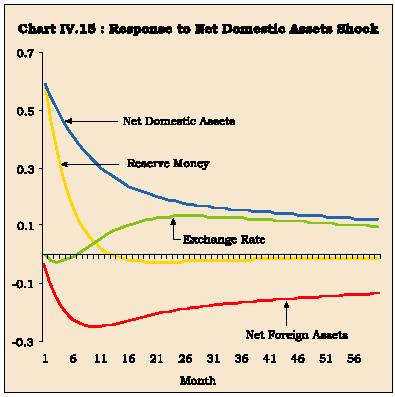
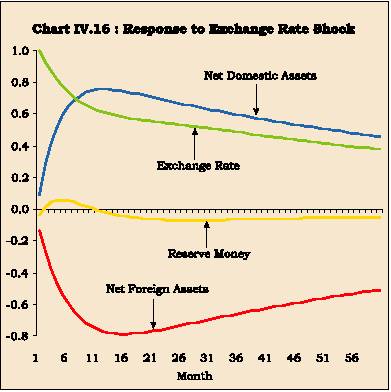
Analysis of impulse responses is undertaken to study the dynamics. A positive shock to (i.e., an increase in) net foreign assets leads to an immediate policy response that tends to sterilise these capital flows. This is reflected in a decline in net domestic assets of the Reserve Bank. The OMO sales are able to almost fully offset the increase in net foreign assets. In contrast to a large increase in NFA, reserve money movements are fairly muted 7 . Reserve money shows a marginal increasing trend for the first six months after the shock and gradually returns to its baseline (Chart IV.14). As regards exchange rate, a shock to NFA has the expected effect. Exchange rate appreciates immediately after the shock and the peak appreciation occurs nearly a year after the initial shock. A positive shock to net domestic assets leads to a commensurate increase in reserve money. In subsequent months, net foreign assets decline and offset the increase in NDA. As a result, reserve money remains above the baseline for almost one year. Reflecting the expansionary effect of the base money, exchange rate depreciates with a lag of about six months. Depreciation reaches its peak around two years after the shock and the exchange rate stabilises at its new level (Chart IV.15). Finally, a positive shock to the exchange rate (i.e., a depreciation of the rupee) leads to a fall in net foreign assets of the Reserve Bank. The decline in NFA reflects market sales of foreign currency by the Reserve Bank consistent with its stated policy objective of meeting temporary demand-supply gaps in order to ensure orderly conditions in the foreign exchange market. In the process, the Reserve Bank acquires domestic securities against sales of foreign currency and this leads to an increase in net domestic assets. The impulse responses indicate that the increase in NDA more or less offsets the decline in NFA. As a result of almost complete sterilisation, the reserve money is broadly unchanged. Thus, in response to volatility in foreign exchange market, the Reserve Bank makes sales of foreign currency to ensure orderly correction while trying to insulate domestic monetary conditions (Chart IV.16).
Taken together, the empirical evidence suggests that the Reserve Bank was able to offset the expansionary effect of foreign capital flows on domestic money supply, consistent with its macroeconomic objectives.
6 As net domestic assets (NDA) have turned negative over the latter part of the sample, following Moreno (1996), these have been proxied by the difference between log of reserve money and log of net foreign assets.
7 Although reserve money is not a part of the VAR, the response of reserve money to various shocks is computed as the sum of the responses of NDA and NFA to various shocks.
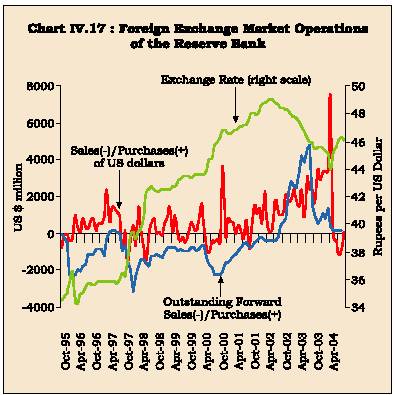
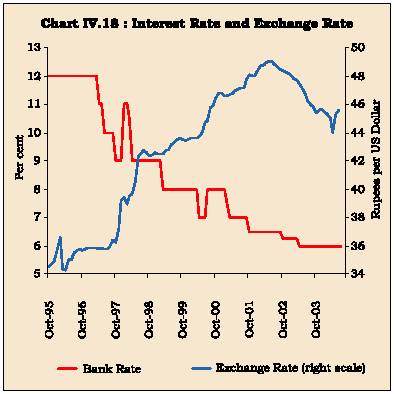
4.65 It is essential to recognise that the capacity of economic agents in developing economies, particularly poorer segments, to manage volatility in all prices, goods or foreign exchange is highly constrained and there is a legitimate role for non-volatility as a public good (Reddy, 2004a). After the liberalisation of the exchange rate regime in the mid-1990s, the Reserve Bank had, therefore, to chart its own course of exchange rate management, learning from the contemporary experiences. There is now a well-laid out policy response to sudden changes in capital flows so as to stabilise markets: on demand-side, including monetary tightening and changes in the cost of import finance as well as on supply-side, including the Reserve Bank’s operations in the foreign exchange market and changes in the cost of delaying export proceeds (Jadhav, 2003) (Charts IV.17 and IV.18). The Reserve Bank has been prepared to make sales and purchases of foreign currency in order to even out lumpy demand and supply in the relatively thin forex market and to smoothen jerky movements. However, such intervention is not governed by a predetermined target or band around the exchange rate (Jalan, 1999).
4.66 The broad principles that have guided India after the Asian crisis of 1997 are: (i) careful monitoring and management of the exchange rate without a fixed
4.67 India’s exchange rate policy of focusing on managing volatility with no fixed rate target while allowing the underlying demand and supply conditions to determine the exchange rate movements over a
4.68 A key part of the policy package, as noted earlier, is the use of monetary measures to ensure orderly conditions in the foreign exchange market. This Section briefly addresses the efficacy of such measures in influencing the exchange rate. According to the uncovered interest parity (UIP) condition, an increase in the domestic interest rate should be associated with a depreciation of the domestic currency to equalise returns on domestic and foreign assets. However, cross-country empirical evidence strongly rejects UIP. The failure of UIP provides a rationale for monetary measures to influence exchange rates in the short-run. Econometric evidence suggests that positive monetary policy shocks, inter alia, induce an appreciation of the domestic currency (Christianio et al. 1999; Peersman and Smets, 2001). In the Indian context, existing studies also indicate that monetary policy tightening measures have been successful in restoring orderly conditions in the foreign exchange market (Pattanaik and Mitra, 2001; Pattnaik, Kapur and Dhal, 2003). Both these studies find that increase in interest rates has the expected effect of strengthening the exchange rate in the short-run; over time, however, the effect peters out, consistent with the theory.
4.69 These results are re-confirmed by analysis presented in Chapter VII. Impulse responses based on a 5-variable VAR - industrial production, wholesale price index, Bank Rate, broad money and exchange rate - show that interest rate increases temporarily in response to an exogenous positive exchange rate shock. Similarly, impulse responses indicate that exchange rate appreciates in response to a positive interest rate shock. The results, thus, suggest that monetary policy measures taken to ensure orderly conditions in the foreign exchange market have the desired impact.
4.70 In brief, in the face of sustained capital flows and, in the recent years, surpluses on the current account, the foreign exchange market has been characterised by excess supply conditions. Authorities in India have responded to these excess supplies through a multi-pronged approach. In the context of large forex inflows, an ongoing view is taken for operational purposes on: (a) the extent of forex market intervention and consequent build-up of reserves; and (b) whether to sterilise or not and if so, to what extent. Operations involving sterilisation are undertaken in the context of a policy response which has to be viewed as a package encompassing exchange rate policy, level of reserves, interest rate policy along with considerations related to domestic liquidity, financial market conditions as a whole, and degree of openness of the economy. The policy response depends on several considerations involving trade-offs between the short term and the long term; judgement on whether capital flows are temporary or enduring; as well as on the operation of self-correcting mechanisms in the market and market responses in terms of sentiments. Whereas the distinction between short term and long term flows is conceptually clear, in practice, it is not always easy to distinguish between the two for operational purposes. Moreover, at any given time, some flows could be of an enduring nature whereas others could be short term and, hence, reversible. More important, what appears to be short-term, could tend to last longer and vice versa, imparting a dynamic dimension to judgment about their relative composition (RBI, 2003d). In a scenario of uncertainty facing the authorities in determining temporary or permanent nature of inflows, it is prudent to presume that such flows are temporary till such time that they are firmly established to be of a permanent nature (RBI, 2004c).
4.71 Notwithstanding the large scale capital inflows, sterilisation operations coupled with other measures to manage the capital account have been largely able to keep money supply in line with desired trajectory. Furthermore, in contrast to experiences and fears often expressed with sterilisation, interest rates in India softened over the period across the spectrum. Illustratively, the Bank Rate has halved from 12 per cent to six per cent between March 1997 and March 2004. The yields on Government of India securities (10-year paper) fell from 13.4 per cent to 5.2 per cent over the same period although these have increased somewhat in the subsequent months (see Chapter II).
Business Cycle Synchronisation
4.72 Apart from influences operating through movement of capital inflows and outflows, external demand and supply shocks can impact upon the domestic economy, especially in view of the growing openness of the economy. Illustratively, domestic prices of key commodities/groups such as iron and steel exhibited co-movements with international prices during 2003-04. Inflation, therefore, in the short-run can be influenced by external developments. Variations in external demand conditions coupled with exchange rate movements affect exports and imports and therefore, domestic demand and output. In view of the growing openness, there has been a renewed interest to assess the degree of synchronisation of output in India with that in its major trading partners.
4.73 Business cycles abroad have a relatively larger influence on the Indian economy than was the case during the 1980s and exports and industrial production have started exhibiting co-movement with global business cycles (RBI, 2002). Mall (2001) finds that the Indian output cycles are positively correlated with the UK and the US cycles, especially during the post-1980s. Exogenous oil shocks were found to be more important than non-oil global shocks, which, in turn, were stronger than country-specific shocks. Moreover, correlation between investment and private consumption cycles of India and those from each of the select countries - US, UK, Japan and Germany –turned from negative to positive, albeit small in magnitude, in the post-1980 period. Cyclical output of advanced economies has a unidirectional causal effect on India’s cyclical output (Chitre, 2003). According to Dua and Banerji (2001a, 2001b), business cycles in India are more similar in character to those of the market economies in the post-1991 liberalisation phase. The cycles were, however, driven more by endogenous factors than by exogenous shocks. As regards co-movement with ASEAN countries, although there is evidence of synchronisation of growth cycles, similarity seemed to be purely coincidental and driven by domestic factors rather than greater inter-linkages with the ASEAN countries. The cyclical downturn of the Indian economy in synchrony with the East Asian crisis of 1997 is thus to be seen in this light (Mukherjee, 2003).
4.74 This Section updates the analysis undertaken in RBI (2004a) to examine the degree of synchronicity of the Indian business cycle with world output as well as its major trading partners - developed as well as emerging economies. The empirical analysis covers the period 1980-2003. Apart from using overall GDP, non-agricultural GDP and industrial GDP are also used to capture co-movement, since agricultural sector - largely weather driven - still has a significant share in the Indian GDP.
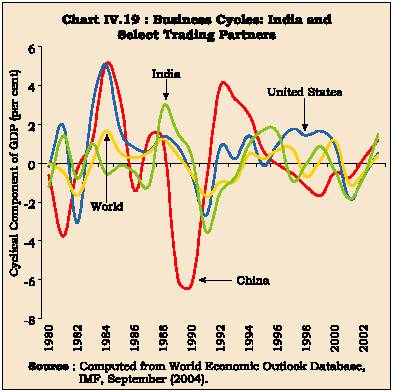
4.75 Results show that the synchronicity of the business cycles in India with the world, as a whole, has increased in the post-opening phase (1991-2003) vis-à-vis the pre-opening phase (1980-90) (Table 4.14). Amongst major trading partners, cyclical synchronicity of India appears to have strengthened with most of the advanced economies during the post-1990 period vis-à-vis the pre-1990 period. Amongst developing country partners, synchronicity was lower with the East Asian partners during the 1990s. This decline in synchronicity with the East Asian trading partners could perhaps be reflecting the aftermath of the Asian financial crisis. While these economies were severely affected by the crisis, India was relatively unaffected, in large part due to prudent macroeconomic policies adopted by India since the early 1990s. Amongst other major economies, there is evidence of co-movement with China during the 1990s vis-à-vis negative correlation in the 1980s (Chart IV.19).
4.76 In addition to analysis of correlation of business cycles, an examination of their amplitude is useful as it is indicative of the severity of expansion and contraction of activities. Amplitude is influenced,
|
Table 4.14: Bilateral Correlation of India's Business Cycles with its Major Trading Partners |
||||||||||
|
1980-2003 |
1980-1990 |
1991-2003 |
||||||||
|
GDP |
Non- |
Industrial |
GDP |
Non- |
Industrial |
GDP |
Non- |
Industrial |
||
|
Agricultural |
Agricultural |
Agricultural |
||||||||
|
GDP |
GDP |
GDP |
GDP |
GDP |
GDP |
|||||
|
1 |
2 |
3 |
4 |
5 |
6 |
7 |
8 |
9 |
10 |
|
|
Australia |
0.42 |
0.45 |
0.29 |
0.15 |
0.26 |
-0.05 |
0.72 |
0.67 |
0.60 |
|
|
Belgium |
0.19 |
0.21 |
0.01 |
0.12 |
0.09 |
-0.25 |
0.21 |
0.24 |
0.11 |
|
|
Brazil |
-0.23 |
0.08 |
-0.07 |
-0.54 |
-0.12 |
-0.59 |
0.26 |
0.40 |
0.59 |
|
|
Canada |
0.41 |
0.44 |
0.27 |
0.26 |
0.26 |
-0.05 |
0.53 |
0.59 |
0.49 |
|
|
China |
-0.16 |
-0.13 |
-0.08 |
-0.29 |
-0.33 |
-0.41 |
0.06 |
0.06 |
0.30 |
|
|
Germany |
-0.02 |
-0.20 |
-0.21 |
0.31 |
0.04 |
-0.05 |
-0.28 |
-0.35 |
-0.33 |
|
|
Hong Kong |
-0.04 |
-0.05 |
0.10 |
-0.09 |
-0.11 |
-0.01 |
0.02 |
-0.02 |
0.20 |
|
|
Indonesia |
0.07 |
0.11 |
0.26 |
0.10 |
0.08 |
-0.03 |
0.07 |
0.13 |
0.35 |
|
|
Japan |
0.40 |
0.20 |
0.19 |
0.54 |
0.37 |
0.11 |
0.27 |
0.08 |
0.20 |
|
|
Korea |
0.17 |
0.17 |
0.36 |
0.25 |
0.09 |
0.53 |
0.12 |
0.18 |
0.30 |
|
|
Malaysia |
0.21 |
0.12 |
0.30 |
0.39 |
0.10 |
0.35 |
0.15 |
0.14 |
0.30 |
|
|
New Zealand |
0.17 |
0.34 |
0.44 |
-0.40 |
-0.23 |
-0.15 |
0.62 |
0.65 |
0.80 |
|
|
Philippines |
0.40 |
0.39 |
0.48 |
0.31 |
0.30 |
0.46 |
0.65 |
0.65 |
0.69 |
|
|
Singapore |
0.31 |
0.20 |
0.39 |
0.39 |
0.15 |
0.48 |
0.26 |
0.26 |
0.37 |
|
|
Thailand |
0.33 |
0.28 |
0.47 |
0.58 |
0.38 |
0.41 |
0.25 |
0.24 |
0.48 |
|
|
U.K. |
0.43 |
0.49 |
0.49 |
0.13 |
0.24 |
0.23 |
0.69 |
0.67 |
0.69 |
|
|
U.S.A. |
0.43 |
0.35 |
0.24 |
0.23 |
0.21 |
0.10 |
0.63 |
0.48 |
0.35 |
|
|
World |
0.52 |
0.50 |
0.40 |
0.22 |
0.29 |
-0.01 |
0.72 |
0.60 |
0.61 |
|
|
Memo: |
||||||||||
|
Advanced Economies |
0.51 |
0.42 |
0.30 |
0.39 |
0.38 |
0.12 |
0.59 |
0.45 |
0.40 |
|
|
Middle East |
-0.36 |
-0.31 |
-0.26 |
-0.40 |
-0.17 |
-0.10 |
-0.37 |
-0.50 |
-0.46 |
|
|
Newly industrialised |
0.14 |
0.16 |
0.32 |
0.05 |
0.05 |
0.35 |
0.19 |
0.20 |
0.31 |
|
|
Asian economies |
||||||||||
|
Other emerging market and |
0.37 |
0.45 |
0.40 |
-0.19 |
0.01 |
-0.31 |
0.67 |
0.61 |
0.70 |
|
|
developing countries |
||||||||||
|
Note:Bilateral
correlation coefficients indicate the correlation between the cyclical
components of growth Source:Computed from World Economic Outlook Database, IMF, September (2004). |
||||||||||
4.77 The evidence on business cycles thus indicates that co-movement of output in India with the world output has increased in the 1990s. Domestic macroeconomic policies have, therefore, to take into account impact of such developments abroad on the domestic economy. As the Reserve Bank’s Monetary and Credit Policy Statement of 2001-02 noted: '…Monetary management has now become much more complex than was the case even a few years ago. This is because of several factors, such as, the on-going integration of financial markets across the world, the phenomenal increase in financial turnover, liberalisation of the economy, and the rapidity with which unanticipated domestic and international tremors get transmitted to financial markets across the world because of the new technology…The need to quickly change the policy stance in the light of emerging situation has also been the experience of other monetary authorities including the US and European central
|
Table 4.15: Amplitude of Business Cycles: India and Major Trading Partners |
|||
|
(Per cent) |
|||
|
1980-2003 |
1980-90 |
1991-2003 |
|
|
1 |
2 |
3 |
4 |
|
Australia |
1.7 |
2.1 |
1.4 |
|
Belgium |
1.3 |
1.4 |
1.3 |
|
Brazil |
3.5 |
4.8 |
1.9 |
|
Canada |
2.1 |
2.4 |
1.8 |
|
China |
2.8 |
3.6 |
1.8 |
|
Germany |
1.3 |
1.3 |
1.4 |
|
Hong Kong SAR |
3.8 |
4.4 |
3.3 |
|
India (GDP) |
1.4 |
1.3 |
1.5 |
|
India (Non-agricultural GDP) |
1.5 |
1.0 |
1.9 |
|
India (Industrial GDP) |
3.1 |
2.3 |
3.7 |
|
Indonesia |
3.9 |
2.2 |
5.1 |
|
Japan |
1.4 |
1.4 |
1.5 |
|
Korea |
3.5 |
2.8 |
4.2 |
|
Malaysia |
3.8 |
3.0 |
4.4 |
|
New Zealand |
2.1 |
2.3 |
2.1 |
|
Philippines |
3.3 |
4.5 |
2.0 |
|
Singapore |
3.4 |
3.6 |
3.5 |
|
Thailand |
3.8 |
2.4 |
4.7 |
|
United Kingdom |
1.6 |
1.8 |
1.5 |
|
United States |
1.7 |
2.0 |
1.4 |
|
World |
0.9 |
0.9 |
0.9 |
|
Memo: |
|||
|
Advanced economies |
1.0 |
1.1 |
0.9 |
|
Middle East |
1.9 |
2.3 |
1.5 |
|
Newly industrialised |
2.4 |
2.3 |
2.7 |
|
Asian economies |
|||
|
Other emerging market and |
1.0 |
0.9 |
1.1 |
|
developing countries |
|||
|
Note : Amplitude
refers to standard deviation of the cyclical |
|||
banks… Keeping these realities in view, it is par ticularly important for banks and financial institutions to make adequate allowances for unforeseen contingencies in their business plans, and fully take into account the implications of changes in the monetary and external environment on their operations...' (RBI, 2001).
III. CONCLUDING OBSERVATIONS
4.78 The decade of the 1990s has witnessed a further spread of globalisation. World trade has continued to expand at a rate higher than that of the world output. A more striking phenomenon during the 1990s was the increased financial openness which has led to a sharp surge in capital flows but with concomitant elevated volatility. Greater trade and financial openness can increase cross-linkages and interdependence between economies. Monetary policy authorities are, therefore, required to make an assessment of these developments on domestic output and inflation in formulation of their policies. As it is, monetary policy operates in an uncertain environment. These uncertainties are exacerbated in an environment of greater trade and financial integration.
4.79 A particular aspect of globalisation that has heavily dominated the conduct of monetary policy in the emerging market economies (EMEs) in recent years has emanated from the behaviour of capital flows. Boom-bust pattern of capital flows to the EMEs has brought into sharp focus the constraints imposed by the ‘impossible trinity’. The EMEs have been juggling to prevent excessive monetary expansion even as they pursue an open capital account and attempt to modulate the speed of change in the value of the local currency. In the process, the central banks in these economies have mainly relied on sterilisation as the policy response and build-up substantial reserves in episodes of punitive capital flows. Foreign exchange reserves reflect a precautionary demand and self-insurance necessitated by volatility of capital flows. This response of EMEs may be all the more appropriate since capital flows in the past 3-4 years are believed, in a large part, due to 'push' factors. Another cause of concern for monetary authorities, at the present juncture, emanates from global imbalances, in particular, the US twin deficits. At some stage, the large US current account deficit would have to undergo correction. The concern mainly arises from the consequences for the global economy that may follow from the adjustment dynamics as the US current account adjusts towards sustainable levels.
4.80 Like other EMEs, India too has attracted large capital flows, the effect of which has been augmented, in recent years, by surpluses in the current account. Capital flows have been largely stable, reflecting a cautious approach to capital account liberalisation. Nonetheless, there have been a few episodes of volatility in capital flows. Overall, however, the period since 1993-94 has witnessed persistent surpluses in balance of payments. External sector developments, have, therefore, come to influence dynamics of monetary base and monetary aggregates. A multi-pronged approach has been followed to manage the external flows to ensure domestic economic and financial stability. The key features of the package of measures include: liberalisation of policies in regard to capital account outflows; encouraging pre-payment of external borrowings; alignment of interest rates on non-resident deposits; and, greater flexibility in exchange rate. These measures have been supplemented with sterilisation operations to minimise the inflationary impact of the flows and to ensure domestic financial stability.
4.81 Operations involving sterilisation are undertaken in the context of a policy response which has to be viewed as a package encompassing exchange rate policy, level of reserves, interest rate policy along with considerations related to domestic liquidity, financial market conditions as a whole, and degree of openness of the economy. Notwithstanding the large scale of sterilisation operations, interest rates in India have softened across the spectrum.
4.82 The recent experience with exchange rates has highlighted the need for developing countries to allow greater flexibility in exchange rates but the authorities should also have the capacity to intervene in foreign exchange markets in view of herd behaviour. With progressive opening of the emerging markets to financial flows, capital flows are playing an increased role in exchange rate determination and often reflected in higher exchange rate volatility. Against this background, India’s exchange rate policy of focusing on managing volatility with no fixed rate target while allowing the underlying demand and supply conditions to determine the exchange rate movements over a period in an orderly way has stood the test of time. A key lesson of the Indian approach is that flexibility and pragmatism are required in the management of exchange rate in developing countries, rather than adherence to strict theoretical rules.
4.83 In retrospect, thus, the opening up of the Indian economy to external flows had a significant impact on the conduct of monetary policy. First, apart from price stability and credit availability, financial stability has gradually emerged as a key consideration in the conduct of monetary policy. Second, the instruments and operating procedures of monetary policy had to be constantly refined to meet the challenges thrown up by the vicissitudes of capital flows and a market-determined exchange rate. Existing arrangements to modulate liquidity had to be supplemented with innovations such as Market Stabilisation Scheme to absorb liquidity. These refinements coupled with prudential external sector management have indeed helped India to maintain monetary as well as financial stability even as the 1990s witnessed severe financial crises in many developing and emerging economies.

આ પેજ શેર કરો:


રિઝર્વ બેંક ઑફ ઇન્ડિયા મોબાઇલ એપ્લિકેશન ઇન્સ્ટૉલ કરો અને લેટેસ્ટ ન્યૂઝનો ઝડપી ઍક્સેસ મેળવો!
અમારી એપ ઇન્સ્ટોલ કરવા માટે QR કોડ સ્કેન કરો


પેજની છેલ્લી અપડેટની તારીખ:


