Non-Banking Financial Institutions
5.1 Non-banking financial institutions (NBFIs) play a crucial role in broadening the access to financial services, enhancement of competition and diversification of the financial sector. However, NBFIs are heterogeneous as a group, functionally as well as in terms of size and nature of incorporation. The flexibility with which they have been able to innovate strategies and evolve a responsive mechanism has allowed them to market themselves successfully. Development finance institutions (DFIs), in particular, have played an important role in rapid industrialisation in several countries, particularly, in Europe and Japan at a time when the capital market had not developed sufficiently. Having attained their developmental goals, at a later period, DFIs in several countries were either restructured or repositioned.
5.2 Apart from commercial banks and cooperative institutions (urban and rural), the financial system in India consists of a wide variety of NBFIs such as financial institutions, insurance companies, non-bank financial companies, primary dealers and capital market intermediaries such as mutual funds. Although commonly grouped as ‘NBFIs’, the nature of operations of different types of NBFIs is quite distinct from one another. In this Chapter, the focus is on NBFIs under the regulatory/supervisory purview of the Reserve Bank. These comprise all-India financial institutions (AIFIs or FIs), non-banking financial companies (NBFCs) and primary dealers (PDs).
5.3 Although AIFIs have played a key role in extending development finance in India, the Government’s fiscal imperatives and market dynamics forced a reappraisal of the policies and strategy with regard to the role of AIFIs in the economy. A major restructuring in the financial sector occurred when two major DFIs, viz., ICICI and IDBI converted into banks. NBFCs, incorporated under the Companies Act, 1956 are actively engaged in lease finance, hire purchase finance, investments in securities, grants of loans in any manner, including bills discounting, insurance, stock broking, merchant banking and housing finance. PDs have played an important role in developing the Government securities market. Business operations and financial performance of different types of NBFIs are driven mainly by sector-specific factors.
5.4 Keeping in view the contribution that NBFIs make to the financial sector as financial intermediaries, the Reserve Bank has endeavoured to create a conducive atmosphere for NBFIs so that they are able to carve a niche for themselves. With several policy initiatives, the Reserve Bank has been able to strengthen many NBFIs, while weak and unhealthy players have been weeded out of the system. The objective of reforms in this sector is to ensure that NBFIs function on healthy lines, in tandem with other counterparts of the financial system, and that their existence does not engender any systemic risk.
5.5 Regulatory initiatives in respect of FIs during 2005-06 focussed mainly on strengthening the prudential guidelines relating to provisioning of assets, securitisation of standard assets and introduction of one-time settlement scheme for SMEs. Operations of FIs expanded during 2005-06 while a shift in asset portfolio away from investments to loans and advances was observed. Sharp growth in net interest income as well as non-interest income resulted in higher profits for FIs. Asset quality of FIs improved significantly during the year. The capital adequacy ratio, in general, continued to be significantly higher than the minimum prescribed.
5.6 The focus of regulatory measures with respect to NBFCs was on expanding the coverage of the reporting arrangements, fair practice codes for credit card operations, merger/amalgamation of NBFCs with banks, securitisation of standard assets, increase in the directed investments by RNBCs and priorpublic notice about change in control/management. The business of NBFCs contracted marginally during 2005-06. A sharp increase in expenditure resulted in a sharp fall in the profitability of NBFCs during the year. However, asset quality improved significantly. While the proportion of NBFCs with the capital to risk-weighted assets ratio (CRAR) above 30 per cent increased, the proportion of NBFCs with CRAR of less than 12 per cent declined over the year.
5.7 In terms of provisions of the Fiscal Responsibility and Budget Management (FRBM) Act, 2003, the Reserve Bank is precluded from participating in the primary issuance of Central Government securities from April 1, 2006. Consequently, the responsibility of ensuring full subscription to the primary issues rests on PDs. With the objective of imparting greater efficiency, transparency and flexibility in the conduct of Government securities transactions and strengthening the PD system, the Reserve Bank took several initiatives during 2005-06. Banks were allowed to undertake PD business departmentally. The system of bidding commitment was revamped with a mandatory underwriting commitment for PDs. Income earned by PDs increased sharply during 2005-06. As a result, PDs were able to earn a sizeable net profit. The number of PDs posting net profit rose to 14 during 2005-06 from 10 in the previous year. The CRAR of PDs was much in excess of the stipulated minimum norm of 15 per cent of aggregate risk-weighted assets.
5.8 Against the above backdrop, this Chapter sets out the policy developments, business operations and financial performance of financial institutions, non-banking financial companies and primary dealers in sections 2, 3 and 4, respectively.
2. Financial Institutions
5.9 Financial institutions owed their origin to the objective of State driven planned economic development, when the capital markets were relatively underdeveloped and incapable of meeting the long-term requirements of the economy adequately. Over the years, a wide range of FIs came into existence to cater to the medium to long-term financing requirements of different sectors of the economy. While most of them extend direct finance, some others only undertake refinance. Based on their major activity undertaken, all India financial institutions can be classified as (i) term-lending institutions (IFCI Ltd., IIBI Ltd., EXIM Bank and TFCI), which extend long-term finance to different industrial sectors; (ii) refinance institutions [National Bank for Agriculture and Rural Development (NABARD), Small Industries Development Bank of India (SIDBI) and National Housing Bank (NHB)], which extend refinance to banks as well as non-banking financial intermediaries for on-lending to agriculture, small scale industries (SSIs) and the housing sector, respectively; and (iii) investment institutions (LIC), which deploy their assets largely in marketable securities. State/regional level institutions are a distinct group and comprise various State Financial Corporations (SFCs), State Industrial and Development Corporations (SIDCs) and North Eastern Development Finance Corporation Limited (NEDFi). Some of these FIs have been notified as Public Financial Institutions by the Government of India under Section 4A of the Companies Act, 1956.
5.10 At end-March 2006, four FIs, viz., NABARD, SIDBI, NHB and EXIM Bank were under the full-fledged regulation and supervision of the Reserve Bank. However, FIs not accepting public deposits, but having an asset size of Rs.500 crore and above, are subjected to only limited off-site supervision by the Reserve Bank. In addition, NABARD, SIDBI and NHB also shoulder the responsibilities of regulating and/or supervising financial intermediaries in varying degrees. The regulatory/supervisory domain of NHB covers housing finance companies. SIDBI supervises State Finance Corporations and State Industrial Development Corporations, and NABARD supervises co-operative banks and regional rural banks. The focus of the analysis in this section is, however, limited to the seven institutions currently being regulated by the Reserve Bank. These institutions include IFCI, IIBI, EXIM Bank, TFCI, SIDBI, NABARD and NHB.
Regulatory Initiatives for Financial Institutions
5.11 With a view to moving closer to international best practices and ensuring alignment of regulatory norms for the financial institutions with those applicable to the banking sector, several regulatory measures were initiated during 2005-06.
5.12 In pursuance of the announcement in the Mid-term Review of Annual Policy Statement for 2005-06, the general provisioning requirement for ‘standard advances’ in the case of banks was raised from 0.25 per cent to 0.40 per cent of outstandings in November 2005. Consequently, in December 2005, it was announced that the standard assets of FIs, with the exception of direct advances to the agricultural and the SME sectors, would attract a uniform provisioning requirement of 0.40 per cent of the outstandings on a portfolio basis.
5.13 Guidelines relating to one-time settlement scheme for recovery of NPAs below Rs.10 crore for SME accounts issued to public sector banks were also made applicable to FIs in November 2005. The revised guidelines covered all NPAs in the SME sector, classified as ‘doubtful’ or ‘loss’ as on March 31, 2004 and also those NPAs classified as ‘sub-standard’ as on March 31, 2004, which subsequently became ‘doubtful’ or ‘loss’ with outstanding balance of Rs.10 crore and below on the date on which the account was classified as ‘doubtful’. Further, cases on which the banks had initiated action under the Securitisation and Reconstruction of Financial Assets and Enforcement of Security Interest Act (SARFAESI), 2002 are also covered under the scheme. However, cases of wilful default, fraud and malfeasance were not covered. The minimum amount that is required to be recovered in respect of one-time settlement is 100 per cent of the outstanding balance in the account in the case of NPAs classified as ‘doubtful’ or ‘loss’ as on March 31, 2004.
5.14 Guidelines on securitisation of standard assets were issued for FIs along with banks and NBFCs (including RNBCs) in February 2006. The guidelines mainly include definitions and norms relating to true sale, criteria to be met by SPVs, special features including representations and warranties and re-purchase of assets from SPVs, policy on provision of credit enhancement, liquidity and underwriting facilities, policy on provision of services, prudential norms for investment in the securities issued by SPVs and accounting treatment of securitisation transactions.
5.15 An Internal Working Group on Future Role of Refinance Institutions (Convenor: Shri P. Vijaya Bhaskar) was constituted in December 2005 with the following terms of reference: (i) to evaluate the performance of RFIs vis-à-vis the objectives for which these were set up; (ii) toexamine the relevance of their objectives in the present context of developments in the financial sector; (iii) to suggest their future role in view of (ii) above; (iv) to explore the possibilities of alternative avenues for the deployment of surplus funds; (v) to evaluate the modes of raising of resources by the RFIs; and (vi) to examine the issues having a bearing on mortgage credit guarantee companies, including Indian Mortgage Guarantee Company (IMGC). The report of the Group is expected to be submitted shortly.
Operations of Financial Institutions
5.16 Financial assistance sanctioned and disbursed by AIFIs registered a sharp increase during 2005-06, in contrast to the sharp decline in the previous year. The increase was accounted for mainly by all-India term-lending institutions (SIDBI) and investment institutions (LIC) (Table V.1 and Appendix Table V.1). Although IFCI did not sanction any fresh financial assistance, the amount disbursed by it increased sharply by 104.9 per cent during 2005-06.
Table V.1: Financial Assistance Sanctioned and Disbursed by Financial Institutions |
(As at end-March) |
(Amount in Rs. crore) |
Item |
Amount |
Percentage Variation |
|
2004-05 |
2005-06 |
2004-05 |
2005-06 |
|
S |
D |
S |
D |
S |
D |
S |
D |
1 |
2 |
3 |
4 |
5 |
6 |
7 |
8 |
9 |
i) |
All-India Term-lending Institutions* |
9,091 |
6,279 |
11,942 |
9,237 |
-24.6 |
-9.6 |
31.4 |
47.1 |
ii) |
Specialised Financial Institutions# |
111 |
72 |
132 |
86 |
-74.8 |
-81.8 |
18.9 |
19.4 |
iii) |
Investment Institutions@ |
10,404 |
8,972 |
15,165 |
11,200 |
-55.2 |
-47.2 |
45.8 |
24.8 |
Total Assistance by FIs (i to iii) |
19,606 |
15,323 |
27,239 |
20,522 |
-45.1 |
-37.0 |
38.9 |
33.9 |
S : Sanctions. D : Disbursements.
* : Relating to IFCI, SIDBI and IIBI.
# : Relating to IVCF, ICICI Venture and TFCI.
@ : Relating to LIC and GIC. Data for 2005-06 pertain only to LIC.
Note : All data are provisional.
Source : Respective FIs. |
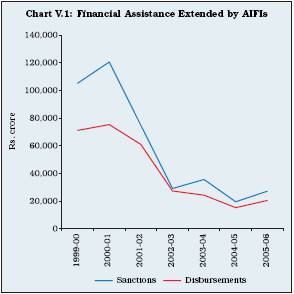
5.17 Financial assistance sanctioned and disbursed by AIFIs, which declined sharply between 2000-01 and 2002-03, exhibited a steady trend thereafter. The gap between sanctioned and disbursed amounts narrowed down significantly in recent years (Chart V.1).
Assets and Liabilities of FIs
5.18 Assets/liabilities of FIs during 2005-06 expanded more or less at the same rate as in 2004-05. On the liabilities side, the resources raised by way of bonds and debentures increased sharply during 2005-06. On the assets side, loans and advances portfolio increased sharply in sync with the sharp credit growth by the banking sector. Like banks, FIs also liquidated their investment portfolio significantly to accommodate the sharp increase in the loan portfolio (Table V.2).
Table V.2: Liabilities and Assets of Financial Institutions |
(As at end-March) |
(Amount in Rs. crore) |
Item |
Amount |
Percentage Variation |
|
2005 |
2006 |
2004-05 |
2005-06 |
1 |
2 |
3 |
4 |
5 |
Liabilities (1 to 6) |
|
|
|
|
1. |
Capital* |
5,331 |
5,431 |
3.3 |
1.9 |
|
|
(4.0) |
(3.7) |
|
|
2. |
Reserves* |
14,074 |
15,211 |
10.8 |
8.1 |
|
|
(10.5) |
(10.5) |
|
|
3. |
Bonds and Debentures |
60,150 |
67,145 |
20.3 |
11.6 |
|
|
(44.7) |
(46.2) |
|
|
4. |
Deposits |
13,355 |
14,520 |
-24.0 |
8.7 |
|
|
(9.9) |
(10.0) |
|
|
5. |
Borrowings |
17,421 |
18,950 |
25.4 |
8.8 |
|
|
(13.0) |
(13.0) |
|
|
6. |
Other Liabilities |
24,105 |
24,217 |
1.9 |
0.5 |
|
|
(17.9) |
(16.6) |
|
|
Total Liabilities/ Assets |
|
1,34,436 |
1,45,474 |
9.8 |
8.2 |
|
|
(100.0) |
(100.0) |
|
|
Assets (1 to 6) |
|
|
|
|
1. |
Cash and Bank Balances |
16,490 |
9,915 |
39.9 |
-39.9 |
|
|
(12.3) |
(6.8) |
|
|
2. |
Investments |
13,617 |
10,423 |
0.6 |
-23.5 |
|
|
(10.1) |
(7.2) |
|
|
3. |
Loans and Advances |
91,874 |
1,11,441 |
8.0 |
21.3 |
|
|
(68.3) |
(76.6) |
|
|
4. |
Bills Discounted/Rediscounted |
1,048 |
1,810 |
-14.0 |
72.7 |
|
|
(0.8) |
(1.2) |
|
|
5. |
Fixed Assets |
1,145 |
1,088 |
-1.8 |
-5.0 |
|
|
(0.9) |
(0.7) |
|
|
6. |
Other Assets |
10,262 |
10,797 |
7.0 |
5.2 |
|
|
(7.6) |
(7.4) |
|
|
* : Without taking into account accumulated losses of IFCI and IIBI.
Note
: 1. Data include IFCI, TFCI, IIBI, EXIM Bank, NABARD, NHB and SIDBI.
2. Figures in brackets are percentages to total liabilities/assets.
Source : Balance sheets of respective FIs. |
Resources Mobilised by FIs
5.19 AIFIs raised resources during 2005-06 in both rupee and foreign currency. Rupee resources include both long-term and short-term funds. While long-term rupee resources consist of borrowings by way of bonds and debentures, short-term resources comprise commercial papers (CPs), term deposits, inter-corporate deposits (ICDs), certificate of deposits (CDs) and borrowings from the term money market. Foreign currency resources mainly include bonds and borrowings.
5.20 Resources raised by FIs during 2005-06 were marginally lower than those raised during 2004-05. While short-term rupee resources declined, long-term rupee resources increased marginally. Resources raised in foreign currency increased significantly. NABARD mobilised the largest amount of resources, followed by EXIM Bank, NHB and SIDBI (Table V.3 and Appendix Table V.2). IFCI and IIBI continued to be barred from mobilising fresh resources on account of their poor financial performance.
5.21 Resources raised by FIs from the money market declined during 2005-06. FIs utilised 13.1 per cent of the total umbrella limit allowed to them for raising resources in the money market during the year as compared with 25.7 per cent during the previous year (Table V.4).
5.22 The practice of extending loans by the Reserve Bank to industrial financial institutions from the National Industrial Credit Long Term Operations (NIC-LTO) Fund was discontinued subsequent to an announcement to this effect made in the Union Budget for 1992-93. Accordingly, the Reserve Bank has been making only token contribution to this fund from 1992-93. There were no outstanding borrowings by any institution under the NIC-LTO Fund at end-June 2006. The outstanding credit to NHB under the National Housing Credit (NHC-LTO) Fund amounted to Rs.50 crore at end-June 2006.
Sources and Uses of Funds
5.23 Total sources/deployment of funds of FIs increased to Rs.1,00,456 crore in 2005-06, registering a growth of 17.9 per cent. Significantly, 63.3 per cent of the funds by FIs were raised from internal sources and 33.3 per cent from external sources. A large part of the funds raised were used for fresh deployments (71.9 per cent), enabled by a decline in the repayment of past borrowings. Interest payments declined marginally during the year (Table V.5 and Appendix Table V.3).
Table V.3: Resources Mobilised by Financial Institutions |
(Amount in Rs. crore) |
Institution |
Total Resources Raised |
Total Outstanding |
|
Long-term |
Short-term |
Foreign Currency |
Total |
as at end-March |
|
2004-05 |
2005-06 |
2004-05 |
2005-06 |
2004-05 |
2005-06 |
2004-05 |
2005-06 |
2005 |
2006 |
1 |
2 |
3 |
4 |
5 |
6 |
7 |
8 |
9 |
10 |
11 |
1. |
IIBI |
– |
– |
– |
– |
– |
– |
– |
– |
2,008 |
1,576 |
2. |
IFCI |
– |
– |
– |
– |
– |
– |
– |
– |
15,025 |
13,678 |
3. |
TFCI |
23 |
71 |
– |
– |
– |
– |
23 |
71 |
429 |
390 |
4. |
EXIM Bank |
1,480 |
3,260 |
1,632 |
1,124 |
2,189 |
2,814 |
5,301 |
7,198 |
11,771 |
15,836 |
5. |
SIDBI |
1,607 |
2,610 |
799 |
420 |
28 |
459 |
2,434 |
3,489 |
9,346 |
11,030 |
6. |
NABARD |
10,642 |
8,195 |
– |
– |
– |
– |
10,642 |
8,194 |
26,429 |
27,303 |
7. |
NHB |
2,419 |
2,631 |
1,063 |
199 |
– |
– |
3,482 |
2,830 |
12,395 |
14,365 |
Total |
(1 to 7) |
16,171 |
16,767 |
3,494 |
1,743 |
2,217 |
3,273 |
21,882 |
21,782 |
77,403 |
84,178 |
– : Nil/Negligible.
Note : Long-term rupee resources comprise borrowings by way of bonds/debentures; and short-term resources comprise CPs, term deposits, ICDs, CDs and borrowing from the term money. Foreign currency resources comprise largely bonds and borrowings in the international market.
Source : Respective FIs. |
Table V.4: Resources Raised by Financial
Institutions from the Money Market |
(Amount in Rs. crore) |
Instrument |
2004-05 |
2005-06 |
1 |
2 |
3 |
A. Total (i to v) |
3,339 |
1,977 |
i) Term Deposit |
705 |
44 |
ii) Term Money |
175 |
– |
iii) Inter-corporate Deposits |
477 |
– |
iv) Certificates of Deposits |
233 |
2 |
v) Commercial Paper |
1,749 |
1,931 |
Memo: |
|
|
B. Umbrella limit |
13,001 |
15,157 |
C. Utilisation of Umbrella limit |
25.7 |
13.1 |
(A as percentage of B) |
|
|
|
|
|
– : Nil/Negligible. |
|
|
Source : Balance sheets of respective FIs. |
Cost and Maturity of Borrowings
5.24 The weighted average cost of long-term resources of refinance institutions (SIDBI, NABARD and NHB) declined during the year. Decline in the weighted average cost of NHB was possibly due to shortening of the maturity profile of its resources. The marginal increase in the weighted average cost of EXIM Bank was despite
Table V.5: Pattern of Sources and Deployment |
of Funds of Financial Institutions* |
(Amount in Rs. crore) |
Sources / |
2004-05 |
2005-06 |
Percentage |
Deployment of Funds |
|
|
Variation |
|
|
|
2004-05 2005-06 |
1 |
2 |
3 |
4 |
5 |
A) |
Sources of Funds |
85,237 |
1,00,456 |
16.3 |
17.9 |
|
(i to iii) |
(100.0) |
(100.0) |
|
|
|
(i) |
Internal |
53,543 |
63,557 |
13.3 |
18.7 |
|
|
|
(62.8) |
(63.3) |
|
|
|
(ii) |
External |
28,925 |
33,475 |
22.4 |
15.7 |
|
|
|
(33.9) |
(33.3) |
|
|
|
(iii) |
Others@ |
2,768 |
3,424 |
15.0 |
23.7 |
|
|
|
(3.2) |
(3.4) |
|
|
B) |
Deployment of Funds |
85,238 |
1,00,456 |
16.3 |
17.9 |
|
(i to iii) |
(100.0) |
(100.0) |
|
|
|
(i) |
Fresh Deployments |
53,291 |
72,273 |
21.6 |
35.6 |
|
|
|
(62.5) |
(71.9) |
|
|
|
(ii) |
Repayment of |
20,019 |
14,402 |
18.9 |
-28.1 |
|
|
past Borrowings |
(23.5) |
(14.3) |
|
|
|
(iii) |
Other Deployments |
11,928 |
13,781 |
-5.4 |
15.5 |
|
|
|
(14.0) |
(13.7) |
|
|
|
|
of which : |
|
|
|
|
|
|
Interest Payments |
4,597 |
4,502 |
-18.1 |
-2.1 |
|
|
|
(5.4) |
(4.5) |
|
|
|
|
|
|
|
|
|
* : IFCI, IIBI, TFCI, NABARD, NHB, SIDBI and EXIM Bank.
@ : Includes cash and balances with banks (cash in hand), balances with the Reserve Bank and other banks.
Note : Figures in brackets are percentages to total.
Source : Respective FIs. |
shortening of weighted average maturity of its borrowings (Table V.6 and Appendix Table V.4).
Table V.6: Weighted Average Cost and Maturity |
of Long-term Rupee Resources |
Institution |
Weighted Average |
Weighted Average |
|
cost (per cent) |
Maturity in years |
|
2004-05 |
2005-06 |
2004-05 |
2005-06 |
1 |
2 |
3 |
4 |
5 |
IIBI |
– |
– |
– |
– |
IFCI |
– |
– |
– |
– |
TFCI |
10.4 |
– |
4.9 |
– |
EXIM Bank |
6.9 |
7.0 |
5.1 |
4.7 |
SIDBI |
6.3 |
4.5 |
7.0 |
7.0 |
NABARD |
6.6 |
5.8 |
2.0 |
2.1 |
NHB |
6.5 |
5.9 |
2.8 |
2.2 |
– : Nil/Negligible.
Note : Data are provisional.
Source : Respective FIs. |
Lending Interest Rates
5.25 NHB raised all its prime lending rates during the year, while SIDBI and IFCI maintained their PLRs at the previous year’s level (Table V.7).
Financial Performance of Financial Institutions
5.26 Net interest income of select all-India FIs increased to Rs.2,555 crore during 2005-06 from Rs.2,125 crore during 2004-05. Non-interest
Table V.7: Lending Rate Structure of Select |
Financial Institutions |
(Per cent Per annum) |
Effective |
PLR |
IFCI |
SIDBI |
NHB@ |
|
|
|
|
|
1 |
2 |
3 |
4 |
5 |
|
|
|
|
|
March 2004 |
Long-term PLR |
12.5 |
11.5 |
6.7-6.5 |
|
Medium-term PLR |
– |
– |
6.5 |
|
Short-term PLR |
12.5 |
10.0 |
6.4 |
July 2004 |
Long-term PLR |
12.5 |
11.5 |
6.5-6.7 |
|
Medium-term PLR |
– |
– |
6.3 |
|
Short-term PLR |
12.5 |
10.0 |
6.0 |
March 2005 |
Long-term PLR |
12.5 |
11.5 |
7.3 |
|
Medium-term PLR |
– |
– |
6.8 |
|
Short-term PLR |
12.5 |
10.0 |
6.5 |
March 2006 |
Long-term PLR |
12.5 |
11.5 |
7.5 |
|
Medium-term PLR |
– |
– |
7.2 |
|
Short-term PLR |
12.5 |
10.0 |
7.0 |
– : Nil/Negligible.
@ : Relating to the fixed rate.
Source: Respective FIs. |
income of FIs also increased significantly during the year. These two factors more than compensated for the sharp growth in operating expenses, resulting in a significant growth in operating profit. With no significant change in the provisions, increase in operating profit was more or less reflected in net profit (Table V.8).
5.27 Income, both interest and non-interest, as a percentage of average working funds of major FIs declined during 2005-06. However, operating profit as percentage of average working funds of most of FIs, including IFCI, improved during 2005-06. Operating profit as a percentage of average working funds was the highest for IFCI, followed by TFCI and SIDBI. IIBI continued to incur operating losses, although lower than the last year. Return to asset ratio of NHB and SIDBI improved marginally (Table V.9). Net profit per employee of NHB and EXIM Bank increased during the year. Net profit per employee in respect of EXIM Bank and NHB during 2005-06 was more than Rs.1 crore.
Soundness Indicators
Asset Quality
5.28 The asset quality of all FIs improved significantly during 2005-06, both in absolute terms and in relation to net loans. Net NPAs of IFCI, IIBI and TFCI declined sharply during the year, reflecting the combined impact of recovery of dues and increased provisioning. As at end-March 2006, NABARD and NHB did not have any NPAs, while NPAs of EXIM Bank and SIDBI were at less than one and two per cent, respectively (Table V.10).
Table V.8: Financial Performance of Select |
All-India Financial Institutions* |
(Amount in Rs. crore) |
Item |
2004-05 |
2005-06 |
Variation |
|
|
|
Amount |
Percent- age |
1 |
2 |
3 |
4 |
5 |
A) |
Income (i+ii) |
8,722 |
9,599 |
877 |
10.1 |
|
i) |
Interest Income |
7,588 |
8,246 |
658 |
8.7 |
|
|
|
(87.0) |
(85.9) |
|
|
|
ii) |
Non-Interest Income |
1,134 |
1,353 |
219 |
19.3 |
|
|
|
(13.0) |
(14.1) |
|
|
B) Expenditure (i+ii) |
7,118 |
7,606 |
488 |
6.9 |
|
i) |
Interest Expenditure |
5,463 |
5,691 |
228 |
4.2 |
|
|
|
(76.7) |
(74.8) |
|
|
|
ii) |
Operating Expenses |
1,655 |
1,915 |
260 |
15.7 |
|
|
|
(23.3) |
(25.2) |
|
|
|
|
of which : Wage Bill |
379 |
372 |
-7 |
-1.8 |
C) |
Provisions for Taxation |
507 |
591 |
84 |
16.6 |
D) Profit |
|
|
|
|
|
i) |
Operating Profit (PBT) |
1,604 |
1,993 |
389 |
24.3 |
|
ii) |
Net Profit (PAT) |
1,097 |
1,402 |
305 |
27.8 |
E) |
Financial Ratios@ |
|
|
|
|
|
i) |
Operating Profit (PBT) |
1.2 |
1.4 |
|
|
|
ii) |
Net Profit (PAT) |
0.8 |
1.0 |
|
|
|
iii) |
Income |
6.5 |
6.6 |
|
|
|
iv) |
Interest Income |
5.6 |
5.7 |
|
|
|
v) |
Other Income |
0.8 |
0.9 |
|
|
|
vi) |
Expenditure |
5.3 |
5.2 |
|
|
|
vii) |
Interest expenditure |
4.1 |
3.9 |
|
|
|
viii) |
Other Operating Expenses |
1.2 |
1.3 |
|
|
|
ix) |
Wage Bill |
0.3 |
0.3 |
|
|
|
x) |
Provisions |
0.4 |
0.4 |
|
|
|
xi) |
Spread |
|
|
|
|
|
|
(Net Interest Income) |
1.6 |
1.8 |
|
|
– : Nil/Negligible.
* : IFCI, IIBI, TFCI, NABARD, NHB, SIDBI and EXIM Bank.
@ : As percentage of total assets.
Note :
Figures in brackets are percentage shares to the respective total.
Source : Balance sheets of respective FIs. |
Table V.9: Select Financial Parameters of Financial Institutions |
(As at end-March) |
(Per cent) |
Institution |
Interest Income/ |
Non-interest |
Operating |
Return on |
Net Profit |
|
Average |
Income/Average |
Profits/Average |
Average |
|
per Employee |
|
Working Funds |
Working Funds |
Working Funds |
Assets |
|
(Rs. crore) |
|
2005 |
2006 |
2005 |
2006 |
2005 |
2006 |
2005 |
2006 |
2005 |
2006 |
1 |
2 |
3 |
4 |
5 |
6 |
7 |
8 |
9 |
10 |
11 |
IFCI |
7.4 |
11.3 |
1.5 |
2.3 |
1.8 |
6.7 |
-2.2 |
-0.6 |
-0.6 |
-0.2 |
IIBI |
11.1 |
11.0 |
7.5 |
8.4 |
-7.6 |
-1.4 |
.. |
.. |
-0.8 |
-0.1 |
TFCI |
11.4 |
10.2 |
0.2 |
0.2 |
3.6 |
4.0 |
2.0 |
1.9 |
0.4 |
0.4 |
EXIM Bank |
6.1 |
7.6 |
0.5 |
0.6 |
2.0 |
2.1 |
1.5 |
1.5 |
1.3 |
1.4 |
NABARD |
6.9 |
6.3 |
– |
-0.1 |
3.2 |
2.1 |
1.8 |
1.8 |
0.2 |
0.2 |
NHB* |
6.7 |
6.2 |
0.4 |
0.2 |
0.5 |
1.1 |
0.3 |
0.5 |
0.5 |
1.1 |
SIDBI |
5.9 |
6.2 |
0.6 |
0.2 |
3.0 |
3.4 |
1.7 |
2.0 |
0.3 |
0.3 |
– : Nil/Negligible. .. : Not Available.
* : Position as at end-June.
Source: Balance sheets of respective FIs. |
Table V.10: Net Non-Performing Assets |
(As at end-March) |
(Amount in Rs. crore) |
Institution |
Net NPAs |
Net NPAs/ Net Loans
(per cent) |
|
2005 |
2006 |
2005 |
2006 |
1 |
2 |
3 |
4 |
5 |
|
|
|
|
|
IFCI |
2,688 |
667 |
28.0 |
9.1 |
IIBI |
405 |
132 |
27.3 |
13.1 |
TFCI |
68 |
15 |
11.0 |
3.0 |
EXIM Bank |
109 |
105 |
0.9 |
0.6 |
NABARD |
1 |
– |
– |
– |
NHB* |
– |
– |
– |
– |
SIDBI |
407 |
261 |
3.9 |
1.9 |
– : Nil/Negligible.
* : Position as at end-June.
Source : Balance sheets of respective FIs. |
5.29 Improvement in asset quality was also observed in various categories of asset classification. Significantly, none of the FIs had any NPAs in the ‘loss’ asset category at end-March 2006 (Table V.11).
Capital Adequacy
5.30 Capital adequacy ratio of FIs, barring the two loss making institutions (IFCI and IIBI), continued to be significantly higher than the minimum stipulated norm, even as the ratio of all FIs, barring TFCI, declined during the year on account of significant growth in their loans and advances portfolio (Table V.12). The CRAR of IIBI and IFCI deteriorated further during the year on account of financial losses.
Table V.11: Asset Classification of |
Financial Institutions |
(As at end-March) |
(Amount in Rs. crore) |
Institution |
Standard |
Sub-Standard |
Doubtful |
Loss |
|
Assets |
Assets |
Assets |
Assets |
|
2005 |
2006 |
2005 |
2006 |
2005 |
2006 |
2005 |
2006 |
1 |
2 |
3 |
4 |
5 |
6 |
7 |
8 |
9 |
|
|
|
|
|
|
|
|
|
IFCI |
6,909 |
6,635 |
205 |
54 |
2,483 |
613 |
– |
– |
IIBI |
1,079 |
874 |
23 |
14 |
382 |
118 |
– |
– |
TFCI |
531 |
546 |
4 |
– |
64 |
15 |
– |
– |
EXIM Bank |
12,714 |
17,692 |
47 |
105 |
62 |
– |
– |
– |
NABARD |
48,354 |
58,088 |
– |
– |
1 |
– |
– |
– |
NHB* |
10,812 |
16,241 |
– |
– |
– |
– |
– |
– |
SIDBI |
9,845 |
13,001 |
8 |
1 |
399 |
260 |
51 |
– |
|
|
|
|
|
|
|
|
|
– : Nil/Negligible.
* : Position as at end-June.
Source: Balance sheets of respective FIs. |
Table V.12: Capital Adequacy Ratio of Select
Financial Institutions* |
(Per cent) |
Institution |
As at end-March |
|
2000 |
2001 |
2002 |
2003 |
2004 |
2005 |
2006 |
1 |
2 |
3 |
4 |
5 |
6 |
7 |
8 |
IFCI |
8.8 |
6.2 |
3.1 |
1.0 |
-17.0 |
-23.4 |
-27.9 |
IIBI |
9.7 |
13.9 |
9.2 |
-11.0 |
-20.1 |
-41.1 |
-64.2 |
TFCI |
16.2 |
18.6 |
18.5 |
19.8 |
22.8 |
27.4 |
34.9 |
EXIM Bank |
24.4 |
23.8 |
33.1 |
26.9 |
23.5 |
21.6 |
18.4 |
NABARD |
44.4 |
38.5 |
36.9 |
39.1 |
39.4 |
38.8 |
34.4 |
NHB@ |
16.5 |
16.8 |
22.1 |
27.9 |
30.5 |
22.5 |
22.3 |
SIDBI |
27.8 |
28.1 |
45.0 |
44.0 |
51.6 |
50.7 |
43.2 |
* : Net of provisioning and write offs.
@ : Position as at end-June.
Source : Balance sheets of respective FIs. |
3. Non-Banking Financial Companies
5.31 Though heterogeneous, NBFCs could be broadly classified into four categories, viz., equipment leasing, hire purchase, loan companies and investment companies. A separate category of NBFCs called the residuary non-banking companies (RNBCs) also exists as they could not be categorised into any one of the four categories. Besides, there are miscellaneous non-banking companies (Chit Fund), mutual benefit financial companies (Nidhis and unnotified Nidhis) and housing finance companies. It is noteworthy that Nidhi companies are not regulated by the Reserve Bank as they come under the regulatory purview of the Ministry of Company Affairs, while the Chit Companies, although governed by the Miscellaneous Non-banking Companies (MNBCs) (Reserve Bank) Directions, 1977, issued by the Reserve Bank with regard to acceptance of deposits, are regulated by the Registrar of Chits of the respective State Governments. Furthermore, MNBCs, not accepting public deposits have been exempted from submitting returns to the Reserve Bank since December 27, 2005.
5.32 This section focuses mainly on the policy developments and operations of NBFCs under the regulatory purview of the Reserve Bank. However, operations of NBFCs and RNBCs are dealt with separately in view of their diverse nature. Besides, operations of NBFCs not accepting public deposits but having asset size of Rs.100 crore and above have also been analysed separately considering the systemic implications of their operations.
Regulatory and Supervisory Initiatives
5.33 The Reserve Bank regulates and supervises NBFCs as defined in Chapter III B of the RBI Act, 1934. Accordingly, the Reserve Bank has issued a set of directions to regulate the activities of NBFCs under its jurisdiction. With a view to ensuring their growth along sound lines, the Reserve Bank initiated several policy measures during 2005-06.
Reporting System for Large NBFCs not Accepting/ Holding Public Deposits
5.34 In order to monitor the activities of non-banking financial companies not accepting/ holding public deposits (NBFCs-ND), a system of quarterly reporting was introduced in respect of companies having asset size of Rs.500 crore and above. The reporting system in the prescribed format for such NBFCs-ND was put in place beginning September 2004. The arrangement was reviewed and it was felt that the intervening period of one quarter was too long to take informed and timely decisions. The periodicity for the submission of the return was, therefore, changed from quarterly to monthly from September 2005. Similarly, with a view to increasing the coverage of NBFCs, the threshold level was raised by making the reporting system applicable to NBFCs with asset size of Rs.100 crore and above, beginning September 2005, instead of Rs.500 crore and above earlier. NBFCs were also required to furnish additional information relating to capital market exposure such as financing of IPOs, gross sales and purchases in respect of shares, debentures and bonds, and guarantees issued on behalf of share brokers. The format was modified again to include parameters such as cumulative balance in profit and loss account, age-wise breakup of NPAs, highest outstanding balance in working capital limits, certain items on capital market exposure of the company and foreign sources of funds, if any. The returns under the revised reporting system were required to be submitted from July 2006.
Know Your Customer (KYC) Guidelines
5.35 NBFCs were advised in February 2005 about the customer acceptance policy and customer identification procedure to be followed by them while opening an account, on the lines of instructions issued to banks. NBFCs were also advised to categorise their customers into low, medium and high risk category according to risk perceived. The KYC guidelines also required the NBFCs to verify the identity and address of the customer through specified documents. Though certain degree of flexibility in the requirements of documents relating to identity and proof of address was provided in the guidelines, there were still some instances where persons belonging to low income group were not able to satisfy the NBFCs about their identity and address. It was, therefore, decided to further simplify the KYC procedure for opening of accounts by such persons who intend to maintain balances not exceeding Rs.50,000 in all the accounts put together and the total credit amount in all these accounts, taken together, does not exceed Rs.1,00,000 in a year. Accordingly, in March, 2006, NBFCs were advised to make the customers aware that if at any point of time, the balance limit is breached, no further transactions would be permitted until the full KYC procedure is completed.
5.36 NBFCs were also advised in February 2005 to monitor transactions of suspicious nature for the purpose of reporting them to the appropriate authority. These KYC norms were revisited in the light of recommendations made by the Financial Action Task Force on Anti-money Laundering Standards and Combating Financing of Terrorism. All deposit-taking NBFCs, excluding RNBCs, were therefore, advised in October 2005 to put in place systems in order to ensure that the agents/brokers authorised by the NBFC to collect deposits are properly identifiable and the books of account maintained by them are made available for audit and inspection, whenever required. All deposit receipts should bear the name and addresses of Registered Offices of NBFCs and must invariably indicate the names of the persons authorised by NBFCs to collect deposits, including brokers/ agents and their addresses. The information on link office (office of persons authorised by NBFCs including brokers/agents) with the telephone number of such officers and/or persons authorised by NBFCs to mobilise deposits was also required to be given so as to facilitate contact with the field persons and address appropriate matters such as unclaimed/lapsed deposits, discontinued deposits, interest payments and other customer grievances. NBFCs were also required to evolve suitable review procedures to identify persons, including brokers/agents, in those cases where the incidence of discontinued deposits was high.
Monitoring of Frauds in NBFCs
5.37 In October 2005, guidelines were issued to NBFCs (including RNBCs) on classification of frauds, approach towards monitoring of frauds and reporting requirements. The individual cases of frauds involving amount less than Rs.25 lakh are required to be reported to the respective Regional Offices of the Reserve Bank, in whose jurisdiction the registered office of the company is located. Individual cases of frauds involving an amount of Rs.25 lakh and above are required to be reported to the Central Office of the Reserve Bank at Mumbai.
Fair Practice Code for Credit Card Operations
5.38 In November 2005, NBFCs were advised to have a well documented policy and a Fair Practices Code for credit card operations, as suggested by the IBA in March 2005. Guidelines issued in this context include norms relating to issue of cards, interest rate and other charges, wrongful billing, use of direct sales agents (DSAs)/direct marketing agents (DMAs) and other agents, protection of customer rights, right to privacy, customer confidentiality, fair practices in debt collection, redressal of grievances, internal control and monitoring system, and right to impose penalty.
Amalgamation/Merger of NBFCs with Banks
5.39 It was decided in June 2004 that banks should obtain prior approval of the Reserve Bank before initiating steps for amalgamation/merger with an NBFC. This measure was initiated so that the post-merger bank continues to be in compliance with the relevant provisions of the Banking Regulation Act, 1949, other concerned statutes and also the regulatory prescriptions stipulated by the Reserve Bank.
NBFCs as Business Correspondents
5.40 Pending the exercise of examining the eligibility criteria of NBFCs (not accepting public deposits) who can be assigned the role of business correspondent/s, banks were advised in March 2006 to defer selection/use of NBFCs as business correspondent/s. However, banks can use NBFCs licensed under Section 25 of the Companies Act, 1956 as business correspondents.
Premature Repayment of Public Deposit/s
5.41 It was brought to the notice of the Reserve Bank that certain companies had offered their depositors the right to prematurely terminate their deposits. Such a practice may vitiate the ALM discipline of the companies. In the case of a company whose assets may be insufficient to meet all its outside liabilities, such repayments could tantamount to preferential treatment to those depositors who exit early. In order to safeguard the ALM discipline and to restrict the preferential payment, the provisions relating to premature repayment were reviewed and revised guidelines were issued in October 2005 encompassing areas such as eligibility and minimum lock-in period. With a view to ensuring operational ease, the provisions relating to premature repayment were revisited. Accordingly, it was clarified in December 2005 that the clause relating to clubbing of all deposit accounts for the purpose of premature repayment/grant of loan, as the case may be, up to Rs.10,000 to the depositor is applicable only in case of problem NBFCs/RNBCs/MNBCs. In the case of death of a depositor, even the problem NBFC/RNBC/MNBC is required to repay the deposit/public deposit within the lock-in period without clubbing of deposit/public deposit.
Rotation of Partners of Statutory Auditors of NBFCs
5.42 The need for corporate governance has assumed considerable importance. Companies, the world over have been increasingly adopting best corporate practices to increase the confidence of investors and other stakeholders. In this context, it was felt that rotation of auditors for scrutiny of books of account of the companies would further strengthen the corporate governance in NBFCs. Accordingly, NBFCs/ RNBCs with public deposits/deposits of Rs 50 crore and above were advised in December 2005 to stipulate rotation of partners of audit firms appointed for auditing the company after every three years so that the same partner does not conduct audit of the company continuously for more than a period of three years. However, the partner so rotated will be eligible for conducting the audit of the NBFC/RNBC after an interval of three years, if the NBFC/RNBC so decides. Companies were advised to incorporate appropriate terms in the letter of appointment to the firm of auditors.
Prior Public Notice About Change in Control/ Management
5.43 In terms of the revised norms prescribed from January 2006, NBFCs were required to inform the Reserve Bank within one month where merger and amalgamation takes place in terms of the High Court order in pursuance of Sections 391 and 394 of the Companies Act, 1956. Also, no public notice is required to be given by the companies in such cases. Prior to these instructions, all NBFCs (deposit taking and non-deposit taking) were required to give prior public notice about the change in the control/ management of the company. However, where merger and amalgamation or change in the management of the company takes place upon sale/ transfer otherwise by way of Court Order, NBFCs (including RNBCs) (deposit taking and non-deposit taking companies) should give prior public notice of 30 days. In case, a new NBFC is formed by the change of management consequent upon merger/ amalgamation/acquisition/sale or transfer of ownership, the Reserve Bank will continue to undertake due diligence on the directors of the new NBFC to ensure compliance with the provisions of Section 45-IA (4)(c) of the Reserve Bank of India Act, 1934.
Maintenance of Directed Investments by RNBCs
5.44 As a measure of protection to depositors’ interest, RNBCs are required to invest the amount of deposits accepted by them in the manner prescribed from time to time. On review, the investment pattern as contained in the Residuary Non-Banking (Reserve Bank) Directions was modified on March 31, 2006, and the Aggregate Liabilities to the Depositor (ALD) was bifurcated under two heads, namely, ALD as on December 31, 2005 and incremental ALD thereafter. The RNBCs were advised to invest, with effect from April 1, 2006, not less than 95 per cent of their ALD as on December 31, 2005 and 100 per cent of the incremental deposit in the manner prescribed. It was also advised that on and from April 1, 2007, the entire amount of ALD would be invested in directed investments only and no discretionary investments would be allowed from April 1, 2007 (Box V.I).
Securitisation and Reconstruction Companies
5.45 The Reserve Bank has so far received 18 applications for Certificate of Registration to commence the business of Securitisation Company (SC)/ Reconstruction Company (RCs). The Reserve Bank had issued Certificate of Registration to four companies, viz., Asset Reconstruction Company (India) Limited, Assets Care Enterprise Limited, ASREC (India) Limited and Pegasus Assets Reconstruction Private Limited. Four applications are under various stages of processing, while two applications were returned as the companies were not incorporated. Eight applications were rejected.
Box V.I: Directed Investments by Residuary Non-Banking Companies
The business of RNBCs is acceptance of public deposits in the form of daily deposits, recurring deposits and fixed deposits. NBFCs, which could not be classified as equipment leasing, hire purchase, loan, investment, nidhi or chit fund companies, but which access public savings by operating various deposit schemes akin to recurring deposit schemes of banks, are classified as RNBCs. The total deposits of NBFCs (including RNBCs) aggregated Rs.22,842 crore as on March 31, 2006, of which deposits of RNBCs were placed at Rs.20,175 crore, accounting for 88.3 per cent of total deposits.
At present, there are three RNBCs registered with the Reserve Bank, viz., Sahara India Financial Corporation Limited, Peerless General Finance and Investment Company Limited and Disari India Savings and Credit Corporation Limited. Unlike other NBFCs, which can deploy their assets in any manner, RNBCs are required to invest only in the directed pattern of investments. Prior to June 22, 2004, RNBCs were required to invest 80 per cent of their ALD in the manner prescribed by the Reserve Bank. The pattern of directed investments was reviewed and rationalised with effect from June 22, 2004 to reduce the overall systemic risk and impart greater liquidity and safety to the investments of RNBCs and thereby enhance the protection available to the depositors. Under the revised pattern of investments, the quantum of directed investments was increased from 80 per cent to 90 per cent of ALD with effect from April 1, 2005 and 100 per cent of ALD with effect from April 1, 2006. Further, in order to make the investments more secured and liquid, they were advised to increase their investment in Government securities and invest only in rated and listed securities in respect of other securities and in debt-oriented mutual funds. The exposure to a single scheduled commercial bank or a single specified financial institution was also restricted.
On review, the investment pattern as contained in the RNBC Directions was modified on March 31, 2006, for which purpose the ALD was bifurcated under two heads namely, ALD as on December 31, 2005 and incremental ALD (liabilities to the depositors that have accrued after December 31, 2005). RNBCs were advised to invest, with effect from April 1, 2006 not less than 95 per cent of their ALD as on December 31, 2005 and entire incremental deposits in the manner prescribed. It was also advised that on and from April 1, 2007, the entire amount of ALD would be invested in directed investments only and no discretionary investment would be allowed to be made by RNBCs.
5.46 Effective March 29, 2004 SCs/RCs were required to increase owned funds to an amount not less than 15 per cent of the total financial assets acquired or to be acquired by the SC/RC on an aggregate basis or Rs.100 crore, whichever is lower, irrespective of whether the assets are transferred to a trust set up for the purpose of securitisation or not. The Government, in November 2005, permitted foreign direct investment (FDI) in the equity of SC/RC and investment by Foreign Institutional Investors (FIIs) in the Security Receipts (SRs) issued by the SC/ RC. Accordingly, the Foreign Investment Promotion Board (FIPB) would consider applications from eligible persons/entities under the FDI route to invest in the paid-up equity capital of asset reconstruction companies which are registered with the Reserve Bank. The maximum foreign equity is not allowed to exceed 49 per cent of the paid up equity capital of asset reconstruction companies. Where investment by any individual entity exceeds 10 per cent of the paid-up equity capital, the asset reconstruction company is required to comply with the provisions of Section 3(3) (f) of the SARFAESI Act 2002. FIIs registered with the Securities and Exchange Board of India (SEBI) were also granted general permission to invest in SRs issued by asset reconstruction companies registered with the Reserve Bank. FIIs can invest up to 49 per cent of each tranche of scheme of SRs, subject to condition that investment of a single FII in each tranche of scheme of SRs shall not exceed 10 per cent of the issue.
5.47 SCs/RCs can acquire assets from banks and financial institutions in terms of Section 5 of the SARFAESI Act and issue SRs to Qualified Institutional Buyers in terms of Section 7 of the Act. SCs/RCs can resort to the measures for assets reconstruction as provided in Section 9 of the Act, namely: (i) the proper management of the business of the borrower, by change in, or take over of the management of the business of the borrower; (ii) the sale or lease of a part or whole of the business of the borrower; (iii) rescheduling of payment of debts payable by the borrower; (iv) enforcement of security interest in accordance with the provisions of the SARFAESI Act; (v) settlement of dues payable by the borrower; and (vi) taking possession of secured assets in accordance with the provisions of the Act. However, the Reserve Bank has issued instructions to the SCs/RCs not to take the measures specified at (i) and (ii) above until necessary guidelines in this regard have been formulated.
5.48 The Reserve Bank issued guidelines on securitisation of standard assets to NBFCs (including RNBCs) in February 2006. The guidelines mainly include definition and norms relating to true sale, criteria to be met by SPV, special features, including representations and warranties, and re-purchase of assets from SPVs, policy on provision of credit enhancement, liquidity and underwriting facilities, policy on provision of services, prudential norms for investment in the securities issued by SPV and accounting treatment of the securitisation transactions.
Registration of NBFCs
5.49 The Reserve Bank received 38,244 applications for grant of certificate of registration (CoR) as NBFCs till end-March 2006. Of these, the Reserve Bank approved 13,141 applications (net of cancellation), including 423 applications (net of cancellation) of companies authorised to accept/hold public deposits. The total number of NBFCs registered with the Reserve Bank were 13,014 (net of cancellation) at end-June 2006, of which 428 were public deposit accepting companies (Table V.13).
Profile of NBFCs (including RNBCs)
5.50 Total number of reported companies which consisted of NBFCs-D (Deposit taking NBFCs), RNBCs, Mutual Benefit Companies (MBCs),
Table V.13: Number of Non-Banking Financial |
Companies Registered with the Reserve Bank |
End-June |
All NBFCs |
NBFCs Accepting |
|
|
Public Deposits |
1 |
2 |
3 |
1999 |
7,855 |
624 |
2000 |
8,451 |
679 |
2001 |
13,815 |
776 |
2002 |
14,077 |
784 |
2003 |
13,849 |
710 |
2004 |
13,764 |
604 |
2005 |
13,261 |
507 |
2006 |
13,014 |
428 |
Miscellaneous Non-Banking Companies (MNBCs) and Nidhi companies declined from 576 at end-September 2005 to 466 at end-September 2006. Subsequent to the cut-off date of September 30, 2005, 130 more companies reported annual return for the year ended March 2005. The number of reported NBFCs-D declined from 413 at end-September 2005 to 386 at end-September 2006. The number of reported MBCs, MNBCs (mainly chit companies) and Nidhi Companies also declined from 157 at end-September 2005 to 77 at end-September 2006. However, these companies are insignificant as compared to the total asset size and public deposits of all NBFCs-D and RNBCs.
5.51 The number of NBFCs-D declined from 474 at end-March 2005 to 426 at end-March 2006. The decline was mainly due to the exit of many NBFCs from deposit taking activity. However, the number of RNBCs remained unchanged at three at end-March 2006.
5.52 Assets and public deposits accepted by reporting NBFCs increased by Rs.2,394 crore and Rs.2,316 crore, respectively, during 2005-06. The net owned funds of NBFCs increased by Rs.562 crore during 2005-06, despite a significant decline in the number of reporting NBFCs (Table V.14). Total assets and public deposits of three RNBCs increased significantly during the year.
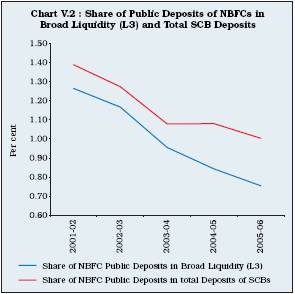
5.53 Deposits of reporting NBFCs constituted 1.1 per cent of aggregate deposits of scheduled commercial banks at end-March 2006 as against 1.2 per cent at end-March 2005. Despite a significant increase in public deposits held by NBFCs at end-March 2006, the share of NBFC deposits in broad liquidity (L3) declined sharply (Chart V.2).
Operations of NBFCs (Excluding RNBCs)
5.54 Total assets/liabilities of NBFCs (excluding RNBCs) declined by 1.2 per cent during 2005-06. Borrowings, a major source of funds of NBFCs, increased by 2.6 per cent. Public deposits declined significantly as also the paid-up capital. On the asset side, hire purchase assets increased sharply. However, loans and advances, and equipment leasing assets declined sharply. While SLR investment of NBFCs declined, non-SLR investment increased during 2005-06 (Table V.15).
Table V.14: Profile of Non-Banking Financial Companies* |
(Amount in Rs. crore) |
Item |
As at End-March |
|
|
2005 |
2006 |
|
|
NBFCs |
of which: RNBCs |
NBFCs |
of which: RNBCs |
1 |
2 |
3 |
4 |
5 |
Number of reported companies |
703 |
3 |
466 |
3 |
Total Assets |
55,059 |
19,056 |
57,453 |
21,891 |
|
|
(34.6) |
|
(38.1) |
Public Deposits |
20,526 |
16,600 |
22,842 |
20,175 |
|
|
(80.9) |
|
(88.3) |
Net Owned Funds |
6,101 |
1,065 |
6,663 |
1,183 |
|
|
(17.5) |
|
(17.8) |
* : Includes miscellaneous Non-Banking Companies, unregistered and unnotified nidhis.
Note: Figures in brackets indicate percentages to respective total of NBFCs. |
Table V.15: Consolidated Balance Sheet of NBFCs |
(Amount in Rs. crore) |
Item |
As at end-March |
Variation |
|
2005 |
2006 |
2004-05 |
2005-06 |
|
|
|
Absolute |
Per cent |
Absolute |
Per cent |
1 |
2 |
3 |
4 |
5 |
6 |
7 |
1. |
Paid up capital |
2,206 |
1,949 |
-121 |
-5.2 |
-257 |
-11.7 |
|
|
(6.1) |
(5.5) |
|
|
|
|
2. |
Reserves and Surplus |
4,544 |
4,838 |
130 |
2.9 |
294 |
6.5 |
|
|
(12.6) |
(13.6) |
|
|
|
|
3. |
Public Deposit |
3,926 |
2,667 |
-391 |
-9.1 |
-1,259 |
-32.1 |
|
|
(10.9) |
(7.5) |
|
|
|
|
4. |
Borrowings |
23,044 |
23,641 |
2,192 |
10.5 |
597 |
2.6 |
|
|
(64.0) |
(66.5) |
|
|
|
|
5. |
Other Liabilities |
2,283 |
2,466 |
1,439 |
170.5 |
183 |
8.0 |
|
|
(6.3) |
(6.9) |
|
|
|
|
Total Liabilities/Assets |
36,003 |
35,561 |
3,249 |
9.9 |
-442 |
-1.2 |
1. |
Investments |
|
|
|
|
|
|
|
i) SLR Investments |
2,237 |
1,314 |
530 |
31 |
-923 |
-41.3 |
|
|
(6.2) |
(3.7) |
|
|
|
|
|
ii) Non-SLR Investments |
1,720 |
2,275 |
-390 |
-18.5 |
555 |
32.3 |
|
|
(4.8) |
(6.4) |
|
|
|
|
2. |
Loan and Advances |
12,749 |
9,199 |
386 |
3.1 |
-3,550 |
-27.8 |
|
|
(35.4) |
(25.9) |
|
|
|
|
3. |
Hire Purchase Assets |
14,400 |
19,893 |
2,751 |
23.6 |
5,493 |
38.1 |
|
|
(40.0) |
(55.9) |
|
|
|
|
4. |
Equipment Leasing Assets |
2,025 |
1,620 |
-1,011 |
-33.3 |
-405 |
-20.0 |
|
|
(5.6) |
(4.6) |
|
|
|
|
5. |
Bill business |
471 |
45 |
34 |
7.8 |
-425 |
-90.4 |
|
|
(1.3) |
(0.1) |
|
|
|
|
6. |
Other Assets |
2,401 |
1,215 |
948 |
65.2 |
-1,186 |
-49.4 |
|
|
(6.7) |
(3.4) |
|
|
|
|
Note: Figures in brackets are percentages to total liabilities/assets. |
5.55 Among NBFC groups, assets/liabilities of hire purchase finance companies increased, while those of equipment leasing, investment companies and loan companies declined during 2005-06. This broadly reflected the impact of resources raised in the form of deposits and borrowings. Hire purchase finance companies was the largest NBFC group, constituting 80.7 per cent of total assets/liabilities of all NBFCs at end-March 2006, followed by equipment leasing companies (9.8 per cent), investment companies (4.5 per cent) and loan companies (3.9 per cent) (Table V.16).
Deposits
Profile of Public Deposits of Different Categories of NBFCs
5.56 Public deposits held by all groups of NBFCs declined during 2005-06. The decline, however, was relatively of lower order in the case of hire purchase companies as a result of which the share of public deposit held by hire purchase companies in total public deposits of NBFCs increased from 61.7 per cent in 2004-05 to 76.5 per cent in 2005-06. Other NBFC groups held a small share of public deposits (Table V.17).
Size-wise Classification of NBFC Deposits
5.57 Deposits held by NBFCs range from less than Rs.0.5 crore to above Rs.50 crore. The number of NBFCs and deposits held by NBFCs in all sizes of deposits declined during 2005-06. However, despite the decline in number of NBFCs in the deposit size of ‘Rs.50 crore and above’, the share of deposits held by NBFCs in this range increased. Seventeen NBFCs with deposit size of ‘Rs.20 crore and above’ held almost 80 per cent of total deposits,
Table V.16: Major Components of Liabilities of NBFCs – Group-wise |
(Amount in Rs. crore) |
NBFC Group |
As at end-March |
|
|
Liabilities |
|
Deposits |
|
Borrowings |
|
2005 |
2006 |
2005 |
2006 |
2005 |
2006 |
1 |
2 |
3 |
4 |
5 |
6 |
7 |
|
|
|
|
|
|
|
1. Equipment Leasing |
4,727 |
3,489 |
343 |
153 |
3,112 |
2,306 |
|
(13.1) |
(9.8) |
(8.7) |
(5.8) |
(13.5) |
(9.8) |
2. Hire Purchase |
20,500 |
28,682 |
2,423 |
2,039 |
13,385 |
19,516 |
|
(56.9) |
(80.7) |
(61.7) |
(76.4) |
(58.1) |
(82.6) |
3. Investment |
1,890 |
1,610 |
94 |
81 |
1,092 |
697 |
|
(5.2) |
(4.5) |
(2.4) |
(3.0) |
(4.7) |
(2.9) |
4. Loan |
6,964 |
1,377 |
205 |
77 |
4,656 |
1,035 |
|
(19.3) |
(3.9) |
(5.2) |
(2.9) |
(20.2) |
(4.4) |
5. Others |
1,922 |
404 |
861 |
317 |
799 |
86 |
|
(5.3 |
(1.1) |
(21.9) |
(11.9) |
(3.5) |
(0.4) |
Total (1 to 5) |
36,003 |
35,561 |
3,926 |
2,667 |
23,044 |
23,641 |
|
(100.0) |
(100.0) |
(100.0) |
(100.0) |
(100.0) |
(100.0) |
Note : Figures in brackets represent percentages to total. |
while the remaining 446 companies held around 20 per cent of total public deposits (Table V.18).
Region-wise Composition of Deposits held by NBFCs
5.58 Deposits held by NBFCs across all the regions declined during 2005-06. The Southern Region accounted for the largest share of deposits (77.2 per cent) at end-March 2006, followed by the Northern Region at 12.0 per cent. The Northern and Eastern Regions together held 17.5 per cent of public deposits, while the North-Eastern Regions did not hold any deposits (Table V.19).
Interest Rate and Maturity Pattern of Public Deposits with NBFCs
5.59 Deposits contracted by NBFCs for all ranges of interest rates declined during 2005-06.
Table V.17: Public Deposits held by NBFCs – Group-wise |
(Amount in Rs. crore) |
NBFC Group |
As at end-March |
|
|
Number of NBFCs |
Public Deposits |
Percentage |
Variation |
|
2005 |
2006 |
2005 |
2006 |
2005 |
2006 |
1 |
2 |
3 |
4 |
5 |
6 |
7 |
1. |
Equipment Leasing |
40 |
35 |
343 |
153 |
-0.3 |
-55.4 |
|
|
|
|
(8.7) |
(5.7) |
|
|
2. |
Hire Purchase |
336 |
312 |
2,423 |
2,039 |
-18.2 |
-15.8 |
|
|
|
|
(61.7) |
(76.5) |
|
|
3. |
Investment |
5 |
5 |
9 4 |
81 |
-12.3 |
-12.9 |
|
|
|
|
(2.4) |
(3.0) |
|
|
4. |
Loan |
69 |
34 |
205 |
77 |
15.2 |
-62.4 |
|
|
|
|
(5.2) |
(2.9) |
|
|
5. |
Others* |
250 |
77 |
861 |
317 |
18.4 |
-63.2 |
|
|
|
|
(21.9) |
(11.9) |
|
|
|
|
|
|
|
|
|
|
Total (1 to 5) |
700 |
463 |
3,926 |
2,667 |
-9.1 |
-32.1 |
|
|
|
|
(100.0) |
(100.0) |
|
|
* : Including Miscellaneous Non-Banking Companies, unregistered and umnnotified Nidhis.
Note : Figures in brackets are percentages to total. |
Table V.18: Range of Deposits held by Non- |
Banking Financial Companies |
(Amount in Rs. crore) |
Deposit range |
As at end-March |
|
No. of |
Amount of |
|
NBFCs |
deposits |
|
2005 |
2006 |
2005 |
2006 |
1 |
2 |
3 |
4 |
5 |
1. |
Less than Rs.0.5 crore |
368 |
264 |
43 |
37 |
|
|
|
|
(1.1) |
(1.4) |
2. |
More than Rs.0.5 crore |
197 |
120 |
195 |
116 |
|
and up to Rs.2 crore |
|
|
(5.0) |
(4.3) |
3. |
More than Rs.2 crore |
84 |
48 |
375 |
201 |
|
and up to Rs.10 crore |
|
|
(9.6) |
(7.5) |
4. |
More than Rs.10 crore |
18 |
14 |
265 |
196 |
|
and up to Rs.20 crore |
|
|
(6.7) |
(7.3) |
5. |
More than Rs.20 crore |
18 |
6 |
601 |
199 |
|
and up to Rs.50 crore |
|
|
(15.3) |
(7.5) |
6. |
Rs.50 crore and above |
15 |
11 |
2,447 |
1,917 |
|
|
|
|
(62.3) |
(71.9) |
Total (1 to 6) |
700 |
463 |
3,926 |
2,667 |
|
|
|
|
(100.0) |
(100.0) |
Note : Figures in brackets are percentages to total deposits. |
Deposits contracted up to 10 per cent rate of interest constituted 83.4 per cent of total deposits at end-March 2006 (Table V.20).
The Maturity Pattern of Public Deposits
5.60 Deposits contracted in all maturity ranges declined during the year. The decline was more pronounced in deposits in the maturity bucket of ‘more than 2 and up to 3 years’. As a result, their
Table V.20: Distribution of Public Deposits of
NBFCs According to Rate of Interest |
(As at end-March) |
(Amount in Rs. crore) |
Interest Range |
2005 |
2006 |
|
|
|
1 |
2 |
3 |
1. |
Up to10 per cent |
2,696 |
2,224 |
|
|
(68.7) |
(83.4) |
2. |
More than 10 per cent |
853 |
310 |
|
and up to 12 per cent |
(21.7) |
(11.6) |
3. More than 12 per cent |
196 |
51 |
|
and up to 14 per cent |
(5.0) |
(1.9) |
4. |
More than 14 per cent |
125 |
57 |
|
and up to 16 per cent |
(3.2) |
(2.1) |
5. |
16 per cent and above |
56 |
26 |
|
|
(1.4) |
(1.0) |
Total (1 to 5) |
3,926 |
2,667 |
|
|
(100.0) |
(100.0) |
Note : Figures in brackets are percentages to total. |
Table V.19: Public Deposits held by Reported |
NBFCs – Region-wise |
(Amount in Rs. crore) |
Region |
2004-05 |
2005-06 |
|
Number |
Amount |
Number |
Amount |
1 |
2 |
3 |
4 |
5 |
|
|
|
|
|
1. Northern |
200 |
351 |
190 |
321 |
|
|
(8.9) |
|
(12.0) |
2. North-Eastern |
0 |
0 |
1 |
– |
|
|
(0.0) |
|
(-) |
3. Eastern |
15 |
178 |
11 |
148 |
|
|
(4.5) |
|
(5.5) |
4. Central |
72 |
92 |
62 |
34 |
|
|
(2.4) |
|
(1.3) |
5. Western |
32 |
280 |
27 |
104 |
|
|
(7.1) |
|
(3.9) |
6. Southern |
381 |
3,024 |
172 |
2,060 |
|
|
(77.0) |
|
(77.2) |
Total (1 to 6) |
700 |
3,926 |
463 |
2,667 |
Metropolitan cities: |
|
|
|
1. Mumbai |
15 |
268 |
13 |
94 |
2. Chennai |
328 |
2,771 |
130 |
1,953 |
3. Kolkata |
11 |
158 |
9 |
134 |
4. New Delhi |
80 |
265 |
69 |
237 |
Total (1 to 4) |
434 |
3,463 |
221 |
2,418 |
– : Nil/Negligible.
Note : Figures in brackets are percentages to total. |
share in total deposits declined sharply, while those of other maturity buckets increased at end-March 2006 (Table V.21).
5.61 The spread between the maximum interest rate on public sector bank deposits of ‘one to three year’ maturity and the interest rate offered by
Table V.21: Maturity Pattern of Public Deposits |
held by NBFCs |
(Amount in Rs. crore) |
Maturity Period@ |
As at end-March |
|
2005 |
2006 |
1 |
2 |
3 |
1. Less than 1 year |
1,208 |
1,060 |
|
(30.8) |
(39.8) |
2. More than 1 and up to 2 years |
940 |
732 |
|
(24.0) |
(27.4) |
3. More than 2 and up to 3 years |
1,357 |
563 |
|
(34.6) |
(21.1) |
4. More than 3 and up to 5 years |
402 |
306 |
|
(10.2) |
(11.5) |
5. 5 years and above |
19 |
5 |
|
(0.5) |
(0.2) |
Total (1 to 5) |
3,926 |
2,667 |
|
(100.0) |
(100.0) |
|
|
|
@ : On the basis of residual maturity of outstanding deposits.
Note : Figures in brackets are percentages to total. |
NBFCs on deposits with the same maturity widened to 4.75 per cent at end-March 2006 from 4.00 per cent at end-March 2005 (Table V.22).
Table V.22: Maximum/Ceiling Interest Rates on
Banks and NBFC Deposits |
(Per cent) |
Item |
As at end-March |
|
2001 |
2002 |
2003 |
2004 |
2005 |
2006 |
1 |
2 |
3 |
4 |
5 |
6 |
7 |
1. |
Maximum interest |
9.50 |
8.50 |
6.75 |
6.75 |
7.00 |
6.25 |
|
rate on public sector |
|
|
|
|
|
|
|
bank deposits of |
|
|
|
|
|
|
|
1-3 year maturity |
|
|
|
|
|
|
2. |
Ceiling interest rate |
14.00 |
12.50 |
11.00 |
11.00 |
11.00 |
11.00 |
|
for NBFCs |
|
|
|
|
|
|
3. |
Spread (2-1) |
4.50 |
4.00 |
4.25 |
4.25 |
4.00 |
4.75 |
Borrowings
5.62 The outstanding borrowings by NBFCs increased by 2.6 per cent during 2005-06. While borrowings by hire purchase companies increased sharply, those by all other categories of NBFCs declined. As a result, the share of borrowings by hire purchase companies in total borrowings by all NBFCs increased sharply to 82.6 per cent at end-March 2006 from 58.1 per cent at end-March 2005 (Table V.23).
5.63 Borrowings by NBFCs from banks and financial institutions and by way of debentures increased sharply by 26.5 per cent and 17.1 per cent, respectively, during 2005-06. Borrowings
Table V.23: Borrowings by NBFCs – Group-wise |
(Amount in Rs. crore) |
NBFC Group |
As at end-March |
Percentage |
|
No. of NBFCs |
Total Borrowings |
Variation |
|
2005 |
2006 |
2005 |
2006 |
2005-06 |
1 |
2 |
3 |
4 |
5 |
6 |
1. Equipment Leasing |
40 |
35 |
3,112 |
2,306 |
-25.9 |
|
|
|
(13.5) |
(9.8) |
|
2. Hire Purchase |
336 |
312 |
13,385 |
19,516 |
45.8 |
|
|
|
(58.1) |
(82.6) |
|
3. Investment |
5 |
5 |
1,092 |
697 |
-36.1 |
|
|
|
(4.7) |
(2.9) |
|
4. Loan |
69 |
34 |
4,656 |
1,035 |
-77.8 |
|
|
|
(20.2) |
(4.4) |
|
5. Others |
250 |
77 |
799 |
86 |
-89.2 |
|
|
|
(3.5) |
(0.4) |
|
Total (1 to 5) |
700 |
463 |
23,044 |
23,641 |
2.6 |
|
|
|
(100.0) |
(100.0) |
|
Note : Figures in brackets are percentages to total borrowings. |
from external sources also grew by 21.8 per cent. However, borrowings from the Government and other sources declined sharply during 2005-06. Borrowings from the Government relates mostly to one State-owned NBFC operating in the Southern region. Borrowings by hire purchase companies increased sharply mainly on account of borrowings from banks and FIs and by way of debentures. Borrowings by equipment leasing companies from banks and FIs increased but declined sharply by way of debentures. Borrowings by loans companies from banks/FIs, debentures and others declined sharply during the year (Table V.24).
Table V.24: Sources of Borrowing of NBFCs |
(Amount in Rs. crore) |
NBFC Group |
As at end-March |
|
Government |
External |
Banks and Financial Institutions |
Debentures |
Others |
Total |
|
2005 |
2006 |
2005 |
2006 |
2005 |
2006 |
2005 |
2006 |
2005 |
2006 |
2005 |
2006 |
1 |
2 |
3 |
4 |
5 |
6 |
7 |
8 |
9 |
1 0 |
11 |
1 2 |
13 |
|
|
|
|
|
|
|
|
|
|
|
|
|
1. Equipment Leasing |
– |
– |
190 |
284 |
1,252 |
1,402 |
1,219 |
338 |
451 |
282 |
3,112 |
2,306 |
|
|
|
|
(49.5) |
|
(12.0) |
|
(-72.3) |
|
(-37.4) |
|
(-25.9) |
2. Hire Purchase |
1 |
– |
320 |
337 |
4,298 |
7,322 |
4,707 |
6,914 |
4,059 |
4,943 |
13,385 |
19,516 |
|
|
|
|
(5.4) |
|
(70.4) |
|
(46.9) |
|
(21.8) |
|
(45.8) |
3. Investment |
885 |
533 |
– |
– |
1 0 |
– |
1 2 |
9 |
185 |
155 |
1,092 |
697 |
|
|
(-39.7) |
|
|
|
(-) |
|
(-25.6) |
|
(-16.3) |
|
(-36.1) |
4. Loan |
86 |
– |
– |
– |
1,377 |
68 |
1,038 |
910 |
2,155 |
57 |
4,656 |
1,035 |
|
|
|
|
|
|
(-95.0) |
|
(-12.4) |
|
(-97.3) |
|
(-77.8) |
5. Others |
– |
– |
– |
– |
1 7 |
4 |
– |
– |
782 |
82 |
799 |
86 |
|
|
|
|
|
|
(-76.5) |
|
(-) |
|
(-89.5) |
|
(-89.2) |
Total (1 to 5) |
972 |
533 |
510 |
621 |
6,954 |
8,796 |
6,976 |
8,171 |
7,632 |
5,519 |
23,044 |
23,641 |
|
|
(-45.2) |
|
(21.8) |
|
(26.5) |
|
(17.1) |
|
(-27.7) |
|
(2.6) |
– : Nil/Negligible.
Note: Figures in brackets are percentage variations over the previous year. |
Table V.25: Major Components of Assets of NBFCs – Group-wise |
(As at end-March) |
(Amount in Rs. crore) |
NBFC Group |
Assets |
Advances |
Investment |
|
2005 |
2006 |
2005 |
2006 |
2005 |
2006 |
1 |
2 |
3 |
4 |
5 |
6 |
7 |
|
|
|
|
|
|
|
1. Equipment Leasing |
4,727 |
3,489 |
3,877 |
3,142 |
333 |
365 |
|
(13.1) |
(9.8) |
(13.1) |
(10.2) |
(8.4) |
(10.2) |
|
|
|
|
|
|
|
2. Hire Purchase |
20,500 |
28,682 |
18,670 |
25,527 |
1,288 |
2,014 |
|
(56.9) |
(80.7) |
(63.2) |
(83.0) |
(32.6) |
(56.1) |
|
|
|
|
|
|
|
3. Investment |
1,890 |
1,610 |
1,061 |
620 |
788 |
968 |
|
(5.2) |
(4.5) |
(3.6) |
(2.0) |
(19.9) |
(27.0) |
|
|
|
|
|
|
|
4. Loan |
6,964 |
1,377 |
4,785 |
1,204 |
1,033 |
126 |
|
(19.3) |
(3.9) |
(16.2) |
(3.9) |
(26.1) |
(3.5) |
|
|
|
|
|
|
|
5. Others@ |
1,922 |
404 |
1,149 |
265 |
515 |
116 |
|
(5.3) |
(1.1) |
(3.9) |
(0.9) |
(13.0) |
(3.2) |
|
|
|
|
|
|
|
Total (1 to 5) |
36,003 |
35,561 |
29,542 |
30,757 |
3,957 |
3,589 |
|
(100.0) |
(100.0) |
(100.0) |
(100.0) |
(100.0) |
(100.0) |
@ : Includes Nidhis, MNBCs and MBCs.
Note : Figures in brackets are percentages to total.
Source : Annual returns of reporting NBFCs. |
Assets of NBFCs
5.64 The assets of all groups of NBFCs declined during 2005-06, while those of hire purchase companies increased sharply. Hire purchase companies accounted for the largest share (80.7 per cent) of assets of NBFCs, followed distantly by equipment leasing companies (9.8 per cent), investment companies (4.5 per cent) and loan companies (3.9 per cent). This broadly reflected the pattern of advances, which constituted the largest item of assets of NBFCs. Investments by NBFCs declined during the year ended March 2006. This was mainly due to a sharp fall in investments by loan companies. Investments by equipment companies, hire purchase companies and investment companies increased during the year (Table V.25).
Distribution of NBFCs According to Asset Size
5.65 The asset size of NBFCs varies significantly from less than Rs.25 lakh to above Rs.500 crore. The decline in the number of reporting companies (from 700 at end-March 2005 to 463 at end-March 2006) was on account of a decline in the number of companies in all asset ranges. The asset holding pattern continued to remain skewed. Twenty four NBFCs with asset size of ‘Rs.100 crore and above’ held 92.7 per cent of total assets of all NBFCs, while the remaining 439 NBFCs held less than 8 per cent of total assets at end-March 2006 (Table V.26).
Table V.26: Non-Banking Financial Companies |
According to Asset Size |
(Amount in Rs. crore) |
Asset size |
As at end-March |
|
No. of reporting companies |
Assets |
|
2005 |
2006 |
2005 |
2006 |
1 |
2 |
3 |
4 |
5 |
1. |
Less than 0.25 |
63 |
29 |
7 |
3 |
|
|
|
|
(-) |
(-) |
2. |
More than 0.25 |
66 |
34 |
24 |
12 |
|
and up to 0.50 |
|
|
(0.1) |
(-) |
3. |
More than 0.50 |
258 |
187 |
284 |
219 |
|
and up to 2 |
|
|
(0.8) |
(0.6) |
4. |
More than 2 |
185 |
132 |
816 |
597 |
|
and up to 10 |
|
|
(2.3) |
(1.7) |
5. |
More than 10 |
77 |
49 |
1,865 |
1,185 |
|
and up to 50 |
|
|
(5.2) |
(3.3) |
6. |
More than 50 |
18 |
8 |
1,216 |
584 |
|
and up to 100 |
|
|
(3.4) |
(1.6) |
7. |
More than 100 |
16 |
11 |
3,119 |
1,920 |
|
and up to 500 |
|
|
(8.7) |
(5.4) |
8. |
Above 500 |
17 |
13 |
28,672 |
31,042 |
|
|
|
|
(79.6) |
(87.3) |
Total (1 to 8) |
700 |
463 |
36,003 |
35,561 |
|
|
|
|
(100.0) |
(100.0) |
– : Nil/Negligible.
Note : Figures in brackets are percentages to total. |
Distribution of Assets of NBFCs – Type of Activity
5.66 Assets held in the form of hire purchase increased sharply by 38.1 per cent, while those held in other business activities declined. Assets held in the hire purchase activity accounted for the largest share (55.9 per cent), followed by loans and inter-corporate deposits (25.9 per cent), investments (10.1 per cent) and equipment leasing (1.7 per cent) (Table V.27).
NBFCs and Micro-Finance
5.67 As on March 31, 2006, ten non-deposit taking NBFCs were undertaking micro-finance activity, viz., financing self-help-groups (SHGs). These micro-finance institutions (MFIs) financed 2,49,042 SHGs with outstandings aggregating Rs.459 crore as on March 31, 2006 as against 1,39,292 SHGs involving Rs.178 crore as on March 31, 2005. During 2005-06, the MFIs assisted 1,37,082 SHGs (43,606 in 2004-05) with disbursements aggregating Rs.1,084 crore (Rs.571 crore in 2004-05), registering a growth of 89.8 per cent.
Financial Performance of NBFCs
5.68 Financial performance of NBFCs suffered a set back during 2005-06. While income earned by NBFCs declined marginally, expenditure increased sharply. As a result, operating profit and
Table V.27: Distribution of Assets of NBFCs – |
Activity-wise |
(Amount in Rs. crore) |
Activity |
As at |
Percentage |
|
end-March |
Variation |
|
2005 |
2006 |
2004-05 |
2005-06 |
|
|
|
|
|
1 |
2 |
3 |
4 |
5 |
|
|
|
|
|
|
1. |
Loans and Inter- |
12,749 |
9,199 |
3.1 |
-27.8 |
|
corporate deposits |
(35.4) |
(25.9) |
|
|
2. |
Investments |
3,957 |
3,589 |
3.6 |
-9.3 |
|
|
(11.0) |
(10.1) |
|
|
3. |
Hire Purchase |
14,400 |
19,893 |
23.6 |
38.1 |
|
|
(40.0) |
(55.9) |
|
|
4. |
Equipment and |
790 |
622 |
-29.2 |
-21.3 |
|
Leasing |
(2.2) |
(1.7) |
|
|
5. |
Bills |
471 |
45 |
8.0 |
-90.5 |
|
|
(1.3) |
(0.1) |
|
|
6. |
Other assets |
3,636 |
2,214 |
7.7 |
-39.1 |
|
|
(10.1) |
(6.2) |
|
|
Total (1 to 6) |
36,003 |
35,561 |
9.9 |
-1.2 |
|
|
(100.0) |
(100.0) |
|
|
Note: Figures in brackets are percentages to total. |
Table V.28: Financial Performance of NBFCs |
(Amount in Rs. crore) |
Item |
|
|
Percentage Variation |
|
|
|
|
2004-05 |
2005-06 |
2004-05 |
2005-06 |
1 |
|
|
|
2 |
3 |
4 |
5 |
A. |
|
Income (i+ii) |
4,582 |
4,578 |
5.8 |
-0.1 |
|
|
|
|
(100.0) |
(100.0) |
|
|
|
|
i) |
Fund based |
4,208 |
4,433 |
5.1 |
5.3 |
|
|
|
|
(91.8) |
(96.8) |
|
|
|
|
ii) |
Fee-based |
374 |
145 |
14.4 |
-61.2 |
|
|
|
|
(8.2) |
(3.2) |
|
|
|
|
|
|
|
|
|
|
B. |
|
Expenditure (i+ii) |
3,657 |
4,134 |
1.0 |
13.0 |
|
|
|
|
(100.0) |
(100.0) |
|
|
|
|
i) |
Financial |
2,168 |
2,174 |
3.3 |
0.3 |
|
|
|
|
(59.3) |
(52.6) |
|
|
|
|
|
of which: |
|
|
|
|
|
|
|
Interest Payments |
783 |
– |
-11.8 |
– |
|
|
|
|
(21.4) |
(-) |
|
|
|
|
ii) |
Operating |
1,489 |
1,960 |
-31.4 |
31.6 |
|
|
|
|
(40.7) |
(47.4) |
|
|
C. |
|
Tax Provisions |
353 |
291 |
96.1 |
-17.6 |
D. |
|
Operating Profit (PBT) |
924 |
443 |
30.0 |
-52.1 |
E. |
|
Net Profit (PAT) |
572 |
152 |
7.7 |
-73.4 |
F. |
|
Total Assets |
36,003 |
35,561 |
9.9 |
-1.2 |
G. |
|
Financial Ratios* |
|
|
|
|
|
|
i) |
Income |
12.7 |
12.9 |
|
|
|
|
ii) |
Fund Income |
11.7 |
12.5 |
|
|
|
|
iii) |
Fee Income |
1.0 |
0.4 |
|
|
|
|
iv) |
Expenditure |
10.2 |
11.6 |
|
|
|
|
v) |
Financial Expenditure |
6.0 |
6.1 |
|
|
|
|
vi) |
Operating Expenditure |
4.1 |
5.5 |
|
|
|
|
vii) |
Tax Provision |
1.0 |
0.8 |
|
|
|
|
viii) |
Net Profit |
1.6 |
0.4 |
|
|
H. |
|
Cost to Income Ratio |
79.8 |
90.3 |
|
|
* : As percentage to total assets.
– : Nil / Negligible.
Note: Figures in brackets are percentages to the respective total. |
net profit declined sharply. This also reflected to a large extent, the sharp deterioration in the cost to income ratio (90.3 per cent in 2005-06 from 79.8 per cent in 2004-05) (Table V.28).
5.69 During 2002-03 and 2003-04, while income as percentage of assets generally remained unchanged, expenditure (including provisions) declined, resulting in a rise in net profits to asset ratio. This trend, however, was arrested in 2004-05 and reversed in 2005-06 (Chart V.3).
Soundness Indicators
Asset Quality of NBFCs
5.70 Gross NPAs (as percentage of gross advances) as well as net NPAs (as percentage of net advances) of reporting NBFCs registered a sharp decline during the year ended March 2006 (Table V.29).
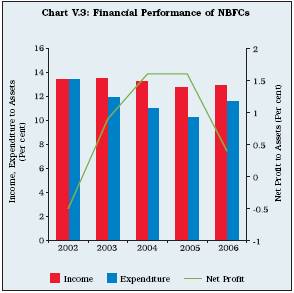
5.71 Gross and net NPAs of equipment leasing and hire purchase companies declined during 2005-06, while those of loan companies increased sharply (Table V.30).
5.72 NPAs in ‘sub-standard’ and ‘doubtful’ category, both in absolute and percentage terms, in respect of equipment leasing companies and hire purchase declined, while those of loan companies increased sharply (Table V.31).
Capital Adequacy Ratio
5.73 Capital to risk-weighted assets ratio (CRAR) norms were made applicable to NBFCs in 1998, in terms of which every deposit-taking
Table V.29: Non-Performing Assets of NBFCs* |
(per cent) |
End-March |
Gross NPAs to |
Net NPAs to |
|
Gross Advances |
Net Advances |
1 |
2 |
3 |
2001 |
11.5 |
5.6 |
2002 |
10.6 |
3.9 |
2003 |
8.8 |
2.7 |
2004 |
8.2 |
2.4 |
2005 |
5.7 |
2.5 |
2006 |
2.4 |
0.4 |
* : Excluding MBFCs, MBCs and MNBCs. |
|
Table V.30: NPAs of NBFCs – Group-wise |
(Amount in Rs. crore) |
NBFC Group/ |
Gross Advances |
|
Gross NPAs |
|
Net Advances |
|
Net NPAs |
|
End-March |
|
Amount |
Per cent to Gross Advances |
Per cent to Risk Weighted Assets |
|
Amount |
Per cent to Net Advances |
Per cent to Risk Weighted Assets |
1 |
2 |
3 |
4 |
5 |
6 |
7 |
8 |
9 |
Equipment Leasing |
2004 |
3,306 |
582 |
17.6 |
13.3 |
3,067 |
344 |
11.2 |
7.8 |
2005 |
4,187 |
514 |
12.3 |
11.0 |
4,018 |
345 |
8.6 |
7.4 |
2006 |
2,846 |
64 |
2.2 |
2.1 |
2,767 |
-16 |
-0.6 |
-0.5 |
Hire Purchase |
2004 |
10,437 |
942 |
9.0 |
7.3 |
9,748 |
253 |
2.6 |
2.0 |
2005 |
15,900 |
610 |
3.8 |
3.6 |
15,544 |
253 |
1.6 |
1.5 |
2006 |
21,984 |
421 |
1.9 |
1.8 |
21,628 |
64 |
0.3 |
0.3 |
Investment |
2004 |
63 |
15 |
23.8 |
2.6 |
55 |
7 |
12.7 |
1.2 |
2005 |
58 |
10 |
17.2 |
1.8 |
58 |
10 |
17.2 |
1.8 |
2006 |
59 |
– |
– |
– |
59 |
– |
– |
– |
Loan |
2004 |
2,038 |
142 |
7.0 |
4.1 |
1,833 |
-63 |
-3.4 |
-1.8 |
2005 |
1,955 |
117 |
6.0 |
5.1 |
1,772 |
-65 |
-3.7 |
-2.8 |
2006 |
549 |
135 |
24.6 |
11.0 |
474 |
60 |
12.6 |
4.9 |
– : Nil/Negligible.
Source : Half-yearly returns of reporting NBFCs. |
Table V.31: Classification of Assets of NBFCs – Group-wise |
(Amount in Rs. crore) |
NBFC Group/ |
Standard |
Sub-Standard |
Doubtful |
Loss |
Gross |
Gross |
End-March |
Assets |
Assets |
Assets |
Assets |
NPAs |
Advances |
|
|
|
|
|
|
|
|
|
|
|
|
|
Amount |
per cent |
Amount |
per cent |
Amount |
per cent |
Amount |
per cent |
Amount |
per cent |
|
|
|
|
|
|
|
|
|
|
|
|
|
1 |
2 |
3 |
4 |
5 |
6 |
7 |
8 |
9 |
10 |
11 |
12 |
Equipment Leasing |
|
|
|
|
|
|
|
|
|
|
|
2004 |
2,724 |
82.4 |
396 |
12.0 |
84 |
2.5 |
102 |
3.1 |
582 |
17.6 |
3,306 |
2005 |
3,673 |
87.7 |
383 |
9.2 |
91 |
2.2 |
39 |
0.9 |
514 |
12.3 |
4,187 |
2006 |
2,782 |
97.8 |
1 0 |
0.4 |
2 0 |
0.7 |
3 3 |
1.2 |
6 4 |
2.2 |
2,845 |
Hire Purchase |
|
|
|
|
|
|
|
|
|
|
|
2004 |
9,495 |
91.0 |
613 |
5.9 |
103 |
1.0 |
226 |
2.2 |
942 |
9.0 |
10,437 |
2005 |
15,290 |
96.2 |
386 |
2.4 |
130 |
0.8 |
94 |
0.6 |
610 |
3.8 |
15,900 |
2006 |
21,564 |
98.1 |
307 |
1.4 |
2 9 |
0.1 |
8 4 |
0.4 |
421 |
1.9 |
21,984 |
Investment |
|
|
|
|
|
|
|
|
|
|
|
2004 |
48 |
75.8 |
– |
– |
10 |
15.3 |
6 |
8.9 |
15 |
23.8 |
63 |
2005 |
48 |
82.0 |
1 |
1.1 |
10 |
16.7 |
– |
– |
10 |
17.2 |
58 |
2006 |
59 |
100.0 |
– |
– |
– |
– |
– |
– |
– |
– |
59 |
Loan |
|
|
|
|
|
|
|
|
|
|
|
2004 |
1,896 |
93.0 |
40 |
2.0 |
20 |
1.0 |
82 |
4.0 |
142 |
7.0 |
2,038 |
2005 |
1,837 |
94.0 |
14 |
0.7 |
42 |
2.2 |
61 |
3.1 |
117 |
6.0 |
1,955 |
2006 |
414 |
75.4 |
1 8 |
3.3 |
8 0 |
14.6 |
3 7 |
6.7 |
135 |
24.6 |
549 |
– : Nil/Negligible.
Source : Half-yearly returns of reporting NBFCs. |
NBFC is required to maintain a minimum capital, consisting of Tier I and Tier II capital, of not less than 12 per cent (15 per cent in the case of unrated deposit taking loan/investment companies) of its aggregate risk-weighted assets and of risk-adjusted value of off-balance sheet items. Total of Tier II capital, at any point of time, cannot exceed 100 per cent of Tier I capital. The number of NBFCs with less than the minimum regulatory CRAR of 12 per cent declined to 19 at end-March 2006 from 64 at end-March 2005 (Table V.32). At end-March 2006, 303 out of 322 NBFCs had CRAR of 12 per cent or more as against 349 out of 413 NBFCs at end-March 2005. Number of NBFCs with CRAR more than 30 also declined to 252 at end-March 2006 from 280 at end-March 2005.
Table V.32: Capital Adequacy Ratio of NBFCs* |
(Amount in Rs. crore) |
Range |
As at end-March |
|
2005 |
2006 |
|
EL |
HP |
LC/IC |
Total |
EL |
HP |
LC/IC |
Total |
1 |
2 |
3 |
4 |
5 |
6 |
7 |
8 |
9 |
1. Less than 9 per cent |
4 |
53 |
6 |
63 |
6 |
10 |
3 |
19 |
2. More than 9 per cent but less than 12 per cent |
0 |
1 |
0 |
1 |
– |
– |
– |
– |
3. Less than 12 per cent (1+2) |
4 |
54 |
6 |
64 |
6 |
10 |
3 |
19 |
4. 12 per cent but less than 15 per cent |
0 |
1 |
1 |
2 |
– |
3 |
– |
3 |
5. 15 per cent but less than 20 per cent |
3 |
19 |
4 |
26 |
– |
10 |
– |
10 |
6. 20 per cent but less than 30 per cent |
6 |
32 |
3 |
41 |
5 |
30 |
3 |
38 |
7. 30 per cent and above |
28 |
219 |
33 |
280 |
22 |
211 |
19 |
252 |
Total (3 to 7) |
41 |
325 |
47 |
413 |
33 |
264 |
25 |
322 |
– : Nil/Negligible. * : Excluding RNBCs, MBCs and MNBCs.
Note :
1. EL - Equipment Leasing.
2. HP - Hire Purchase.
3. LC/IC - Loan Companies/Investment Companies. |
Table V.33: Net Owned Fund vis-à-vis Public deposits of NBFCs* – Group-wise |
(Amount in Rs. crore) |
NBFC Group |
Net Owned Funds |
Public Deposits |
Ratio of Public |
|
|
|
|
|
Deposits to Net |
|
|
|
|
|
Owned Funds |
|
2005 |
2006 |
2005 |
2006 |
2005 |
2006 |
1 |
2 |
3 |
4 |
5 |
6 |
7 |
1. Equipment Leasing |
430 |
553 |
343 |
153 |
0.8 |
0.3 |
2. Hire Purchase |
2,521 |
3,896 |
2,423 |
2,039 |
1.0 |
0.5 |
3. Investment |
662 |
766 |
94 |
81 |
0.1 |
0.1 |
4. Loan |
1,052 |
128 |
205 |
77 |
0.2 |
0.6 |
5. Others |
371 |
138 |
861 |
317 |
2.3 |
2.3 |
Total (1 to 5) |
5,036 |
5,481 |
3,926 |
2,667 |
0.8 |
0.5 |
* : Including MBFCs, MBCs and MNBCs. |
5.74 Net owned fund (NOF) of NBFCs is the aggregate of paid-up capital and free reserves, netted by (i) the amount of accumulated losses, (ii) deferred revenue expenditure and other intangible assets, if any, and adjusted by investments in shares, and loans and advances to (a) subsidiaries, (b) companies in the same group, and (c) other NBFCs (in excess of 10 per cent of owned fund). Information about NOFs can complement the information on CRAR. The ratio of public deposits to NOF in respect of equipment leasing and hire purchase companies declined during the year ended March 2006, while that of loan companies increased. The ratio of public deposit to NOF for all NBFCs was 0.5 per cent at end-March 2006 as compared with 0.8 per cent at end-March 2005 (Table V.33).
5.75 Net owned fund of NBFCs range from less than Rs.25 lakh to above Rs.500 crore. Public deposits, as multiple of NOF, increased for ‘more than Rs.10 crore and up to Rs.50 crore’, but declined in other ranges. Public deposits as multiple of NOF was lowest in the case NBFCs with NOF range of ‘above Rs.500 crore’ (Table V.34).
Residuary Non-Banking Companies (RNBCs)
5.76 Assets of three RNBCs increased by 14.9 per cent during the year ended March 2006. Their assets in the form of fixed deposits with banks
Table V.34: Range of Net Owned Fund vis-à-vis Public Deposits of NBFCs* |
(Amount in Rs. crore) |
Range of NOF |
As at end-March |
|
2005 |
2006 |
|
No. of |
Net |
Public |
Public |
No. of |
Net Owned |
Public |
Public |
|
reporting |
Owned |
Deposits |
Deposits as |
reporting |
Funds |
Deposits |
Deposits as |
|
companies |
Funds |
|
multiple of NOFs |
companies |
|
|
multiple of NOFs |
1 |
2 |
3 |
4 |
5 |
6 |
7 |
8 |
9 |
1. |
Up to 0.25 |
154 |
-714 |
587 |
– |
54 |
-512 |
128 |
– |
2. |
More than 0.25 and up to 2 |
396 |
252 |
472 |
1.9 |
295 |
210 |
221 |
1.1 |
3. |
More than 2 and up to 10 |
99 |
425 |
394 |
0.9 |
76 |
333 |
263 |
0.8 |
4. |
More than10 and up to 50 |
32 |
716 |
490 |
0.7 |
23 |
535 |
519 |
1.0 |
5. |
More than 50 and up to 100 |
5 |
381 |
158 |
0.4 |
3 |
224 |
5 |
– |
6. |
More than 100 and up to 500 |
12 |
2595 |
1067 |
0.4 |
8 |
1,981 |
875 |
0.4 |
7. |
Above 500 |
2 |
1381 |
758 |
0.5 |
4 |
2,709 |
658 |
0.2 |
Total (1 to 7) |
700 |
5,036 |
3,926 |
0.8 |
463 |
5,481 |
2,667 |
0.5 |
– : Nil/Negligible.
* : Including MBFCs, MBCs and MNBCs. |
and unencumbered approved securities increased sharply, while those in bonds/debentures and other investments increased by 3.8 per cent and 1.2 per cent, respectively. Net owned funds of RNBCs increased by 11.1 per cent during 2005-06 (Table V.35).
5.77 The increase in income of RNBCs during 2005-06 was more than the increase in expenditure, as a result of which the operating profit of RNBCs increased. This combined with the sharp decline in tax provisions resulted in a sharp increase in net profit.
Regional Pattern of Deposits of RNBCs
5.78 Of the three RNBCs, two are based in the Eastern region (Kolkata) and one in the Central region. While public deposits held by RNBCs in the Eastern region declined during the year ended March 2006, those held in the Central region increased significantly. Of the four metropolitan cities, RNBCs held public deposits from only one metropolitan city, i.e., Kolkata (Table V.36).
Investment Pattern of RNBCs
5.79 The investment pattern of RNBCs as prescribed in the Residuary Non-Banking (Reserve Bank) Directions, 1987 was reviewed and modified on March 31, 2006. The aggregate liabilities to depositors (ALD) was bifurcated under two heads, viz., aggregate liability to depositor (ALD) as on December 31, 2005 and incremental ALD. Incremental ALDs are the liabilities to the depositors exceeding the aggregate amount of the liabilities to the depositors as on December 31, 2005. RNBCs were advised to invest, with effect from April 1, 2006 not less than 95 per cent of the ALD as on December 31, 2005 and entire incremental ALD in the prescribed manner. It was also advised that on and from April 1, 2007, the
Table V.35: Profile of Residuary Non-Banking Companies (RNBCs) |
(Amount in Rs. crore) |
Item |
As at end-March |
Variation – 2005-06 |
|
2005 |
2006 |
Absolute |
Per cent |
1 |
2 |
3 |
4 |
5 |
A. |
Assets (i to v) |
19,057 |
21,891 |
2,834 |
14.9 |
|
(i) |
Unencumbered approved securities |
2,037 |
2,346 |
309 |
15.2 |
|
(ii) |
Fixed deposits with banks |
4,859 |
6,070 |
1,211 |
24.9 |
|
(iii) |
Bonds or debentures or commercial papers of a |
|
|
|
|
|
|
Government companies/ public sector bank/ |
|
|
|
|
|
|
public financial institution/ corporations |
9,225 |
9,577 |
352 |
3.8 |
|
(iv) |
Other investments |
1,639 |
1,658 |
19 |
1.2 |
|
(v) |
Other assets |
1,297 |
2,240 |
943 |
72.7 |
|
|
|
|
|
|
|
B. |
Net Owned Funds |
1,065 |
1,183 |
118 |
11.1 |
|
|
|
|
|
|
|
C. |
Total Income (i to ii) |
1,532 |
1,620 |
88 |
5.7 |
|
(i) |
Fund Income |
1,530 |
1,616 |
86 |
5.6 |
|
(ii) |
Fee Income |
2 |
3 |
1 |
50.0 |
|
|
|
|
|
|
|
D. |
Total Expenses (i to iii) |
1,396 |
1,439 |
43 |
3.1 |
|
(i) |
Financial Cost |
1,176 |
1,165 |
-11 |
-0.9 |
|
(ii) |
Operating Cost |
146 |
159 |
13 |
8.9 |
|
(iii) |
Other cost |
74 |
115 |
41 |
55.4 |
|
|
|
|
|
|
|
E. |
Provision for Taxation |
48 |
22 |
-26 |
-54.2 |
|
|
|
|
|
|
|
F. |
Operating Profit (PBT) |
136 |
180 |
44 |
32.4 |
|
|
|
|
|
|
|
G. |
Net profit (PAT) |
88 |
158 |
70 |
79.5 |
|
|
|
|
|
|
|
Note : 1. PBT - Profit before tax. |
|
|
|
|
|
2. PAT - Profit after tax. |
|
|
|
|
Table V.36: Public Deposits held by RNBCs –
Region-wise |
(Amount in Rs. crore) |
Region |
As at end-March |
|
2005 |
2006 |
|
No. |
Amount |
No. |
Amount |
1 |
2 |
3 |
4 |
5 |
1. Northern |
– |
– |
– |
– |
2. North-Eastern |
– |
– |
– |
– |
3. Eastern |
2 |
5,070 |
2 |
4,614 |
|
|
(30.5) |
|
(22.9) |
4. Central |
1 |
11,530 |
1 |
15,561 |
|
|
(69.5) |
|
(77.1) |
5. Western |
– |
– |
– |
– |
6. Southern |
– |
– |
– |
– |
Total (1 to 6) |
3 |
16,600 |
3 |
20,175 |
|
|
(100.0) |
|
(100.0) |
Metropolitan cities |
|
|
|
|
1. Mumbai |
– |
– |
– |
– |
2. Chennai |
– |
– |
– |
– |
3. Kolkata |
2 |
5,070 |
2 |
4,614 |
4. New Delhi |
– |
– |
– |
– |
|
|
|
|
|
Total (1 to 4) |
2 |
5,070 |
2 |
4,614 |
– : Nil/Neglible.
Note : Figures in brackets are percentages to total. |
entire amount of ALD would be invested in directed investments only and no discretionary investment would be allowed to be made by RNBCs.
5.80 ALDs increased by 21.5 per cent during 2005-06. The pattern of deployment of ALDs remained broadly unchanged during 2005-
06 (Table V.37).
NBFCs not Accepting Public Deposits and with Assets Size of Rs.100 crore and Above
5.81 As alluded to in the introductory part of this Chapter, NBFCs with an asset size of Rs.100 crore and above are required to submit a monthly return from September 2005. Information based on the returns received from 149 NBFCs with asset size of Rs.100 crore and above for the quarter ended June 2006 showed an increase of 8.9 per cent in their liabilities/assets. Unsecured loans constituted the single largest source of funds for large sized NBFCs, followed by secured loans (Table V.38).
Borrowings
5.82 Borrowings constitute the single most important source of funds for large sized NBFCs.
Table V.37: Investment Pattern of Residuary
Non-Banking Companies |
(Amount in Rs. crore) |
Item |
End-March |
Per cent to ALDs |
|
2005 |
2006 |
2005 |
2006 |
1 |
2 |
3 |
4 |
5 |
A. |
Aggregate Liabilities |
|
|
|
|
|
to the Depositors (ALD) |
16,600 |
20,175 |
100.0 |
100.0 |
|
|
|
|
|
|
|
B. |
Investments (i to iv) |
17,759 |
19,651 |
107.0 |
97.4 |
|
of which: |
|
|
|
|
|
|
|
|
|
|
|
|
i) |
Unencumbered approved |
|
|
|
|
|
|
securities |
2,036 |
2,346 |
12.3 |
11.6 |
|
|
|
|
|
|
|
|
ii) |
Fixed Deposits with |
|
|
|
|
|
|
banks |
4,859 |
6,070 |
29.3 |
30.1 |
|
|
|
|
|
|
|
|
iii) |
Bonds or debentures or |
9,225 |
9,577 |
55.6 |
47.5 |
|
|
commercial papers of |
|
|
|
|
|
|
Government companies/ |
|
|
|
|
|
|
public sector banks/public |
|
|
|
|
|
financial institutions/ |
|
|
|
|
|
|
corporations including |
|
|
|
|
|
|
additional investment in |
|
|
|
|
|
|
Government securities |
|
|
|
|
|
|
|
|
|
|
|
|
iv) |
Other investments |
1,639 |
1,658 |
9.9 |
8.2 |
Total borrowing (secured and unsecured) by NBFCs increased by 5.4 per cent to Rs.1,83,956 crore during the quarter ended June 2006, constituting 67.4 per cent of their total liabilities (Table V.39).
Table V.38: Liabilities of Large Sized NBFCs* |
(Amount in Rs. crore) |
Item |
Quarter Ended |
|
March 2006 |
June 2006 |
|
Amount |
Per cent to
Total Assets |
Amount |
Per cent to
Total Assets |
1 |
2 |
3 |
4 |
5 |
Total Liabilities |
2,50,765 |
100.0 |
2,73,149 |
100.0 |
of which: |
|
|
|
|
i) Paid up Capital |
17,548 |
7.0 |
17,340 |
6.3 |
ii) Preference Shares |
1,633 |
0.7 |
1,682 |
0.6 |
iii) Reserve and Surplus |
39,100 |
15.6 |
42,903 |
15.7 |
iv) Secured Loans |
71,509 |
28.5 |
71,769 |
26.3 |
v) Unsecured Loans |
1,03,086 |
41.1 |
1,12,187 |
41.1 |
* : NBFCs not accepting public deposits with asset size of Rs.100 crore and above. |
Table V.39: Borrowings by Large Sized NBFCs* |
(Amount in Rs. crore) |
Item |
Quarter Ended |
|
March 2006 |
June 2006 |
|
Amount |
Per cent to |
Amount |
Per cent to |
|
|
total Borrowings |
|
total Borrowings |
|
|
|
|
|
1 |
2 |
3 |
4 |
5 |
|
|
|
|
|
A) |
Secured borrowings (i to vi) |
71,509 |
|
71,769 |
|
|
i) |
Debentures |
39,179 |
22.4 |
24,405 |
13.3 |
|
ii) |
Deferred Credit |
– |
– |
– |
– |
|
iii) |
Term Loan from Banks |
16,116 |
9.2 |
15,875 |
8.6 |
|
iv) |
Term Loan from FIs |
6,997 |
4.0 |
6,568 |
3.6 |
|
v) |
Others |
8,612 |
4.9 |
24,434 |
13.3 |
|
vi) |
Interest accrued |
604 |
0.3 |
487 |
0.3 |
B) |
Unsecured borrowings (i to viii) |
1,03,086 |
|
1,12,187 |
|
|
i) |
Loans from
Relatives |
1,639 |
0.9 |
3,129 |
1.7 |
|
ii) |
ICDs |
19,459 |
11.1 |
21,225 |
11.5 |
|
iii) |
Loans from Banks |
28,276 |
16.2 |
27,392 |
14.9 |
|
iv) |
Loans from FIs |
3,703 |
2.1 |
3,677 |
2.0 |
|
v) |
Commercial Paper |
13,123 |
7.5 |
15,409 |
8.4 |
|
vi) |
Debentures |
20,788 |
11.9 |
20,763 |
11.3 |
|
vii) |
Others |
15,402 |
8.8 |
19,961 |
10.9 |
|
viii) |
Loans Interest accrued |
697 |
0.4 |
630 |
0.3 |
Total Borrowings (A+B) |
1,74,595 |
100.0 |
1,83,956 |
100.0 |
Memo: |
|
|
|
|
|
Total Liabilities |
2,50,765 |
69.6 |
2,73,149 |
67.4 |
– : Nil /Negligible.
* : NBFCs not accepting public deposits with asset size of Rs.100 crore and above. |
Application of Funds
5.83 Application of funds by large sized NBFCs underwent a significant change during the quarter ended June 2006. While the share of secured loans increased significantly, that of unsecured loans declined (Table V.40).
Table V.40: Select Indicators on Application of Funds by NBFCs* |
(Amount in Rs. crore) |
Item |
Quarter Ended |
|
March 2006 |
June 2006 |
|
Amount |
Per cent to
total application of funds |
Amount |
Per cent to total
application of funds |
1 |
2 |
|
3 |
4 |
5 |
1. |
Secured Loans |
63,120 |
|
29.2 |
89,441 |
37.0 |
2. |
Unsecured Loans |
82,996 |
|
38.4 |
70,809 |
29.3 |
3. |
Hire Purchase |
22,613 |
|
10.5 |
23,202 |
9.6 |
4. |
Long-term Investment |
30,817 |
|
14.3 |
32,763 |
13.5 |
5. |
Current Investment |
16,665 |
|
7.7 |
25,627 |
10.6 |
Total (1 to 5) |
2,16,211 |
100.0 |
2,41,842 |
100.0 |
Memo Items: |
|
|
|
|
|
Capital Market Exposure |
59,583 |
|
27.6 |
68,053 |
28.1 |
|
of which: |
|
|
|
|
|
|
Equity Market |
27,467 |
|
12.7 |
29,321 |
12.1 |
* : NBFCs not accepting public deposits with assets size of Rs.100 crore and above. |
Financial Performance
5.84 Large NBFCs earned a sizeable profit of Rs.2,682 crore during the quarter ended June 2006, which was 62.4 per cent of the profit earned during the whole of 2005-06 (Table V.41).
Table V.41: Financial Performance of Large
Sized NBFCs* |
(Amount in Rs. crore) |
Item |
Quarter Ended |
|
March 2006 |
June 2006 |
|
Amount |
Per cent |
Amount |
Per cent |
|
|
to total |
|
to total |
|
|
Assets |
|
Assets |
1 |
2 |
3 |
4 |
5 |
Total Assets |
2,50,765 |
100.0 |
2,73,149 |
100.0 |
Total Income |
18,342 |
7.3 |
7,640 |
2.8 |
Total Expenses |
11,874 |
4.7 |
3,900 |
1.4 |
Net Profit |
4,301 |
1.7 |
2,682 |
1.0 |
* : NBFCs not accepting public deposits with asset size of Rs.100 crore and above. |
5.85 Gross and net NPAs of large sized NBFCs constituted 2.5 per cent and 1.3 per cent of total assets, respectively, at end-June 2006 (Table V.42).
4. Primary Dealers
5.86 Primary Dealers (PDs) have been operating in India since 1996. PDs mainly deal in Government securities and support the borrowing programme of the Central Government and the State Governments. PDs are an important constituent of the financial system in view of their key role in Government securities market, especially the primary market and participation in the money market. As at end-March 2006, 17 PDs were operating in India. Five banks, viz., Citibank N.A., Standard Chartered Bank, HSBC Bank, Bank of America and J.P. Morgan Chase Bank have been permitted to take over the primary dealership business of their group entities.
Policy Developments
5.87 Several policy initiatives were undertaken by the Reserve Bank to strengthen and diversify the PD system. Banks, both Indian and foreign, which fulfill certain eligibility criteria, were permitted to undertake PD business departmentally. With the Reserve Bank precluded from participating in primary auctions in Government of India securities from April 1, 2006, the system of bidding commitment was revamped with a system of underwriting commitment for PDs (Box V.2).
Table V.42: Gross and Net NPAs of |
Large Sized NBFCs* |
(Per cent) |
Item |
End-March |
End-June |
|
|
2006 |
2006 |
1 |
|
2 |
3 |
1. |
Gross NPAs to Total Assets |
4.3 |
2.5 |
2. |
Net NPAs to Total Assets |
1.5 |
1.3 |
3. |
Gross NPAs to Total Credit Exposure |
7.0 |
5.0 |
4. |
Net NPAs to Total Credit Exposure |
3.2 |
1.9 |
|
|
|
|
* : NBFCs not accepting public deposits with assets size of Rs.100 crore and above. |
Box V.2: Revised Scheme of Underwriting Commitment for PDs
In terms of the Fiscal Responsibility and Budget Management (FRBM) Act, 2003, the Reserve Bank of India’s participation in the primary issues of Government securities stands withdrawn with effect from April 1, 2006, except under exceptional circumstances. To address the emerging needs, an internal Technical Group on Central Government Securities Market was constituted in December 2004, which submitted its report in July 2005. The Group recommended restructuring of the current institutional process of bidding commitments by introducing a revised methodology for PDs’ obligations in the primary issuance process. In line with the recommendations of the Group and keeping in view the discussions with the market participants, a revised scheme of underwriting was formulated in April 2006. PDs are required to meet underwriting commitment under the revised scheme instead of the earlier requirements of bidding commitment and voluntary underwriting. The underwriting commitment is divided into two parts, viz; i) minimum underwriting commitment (MUC), and ii) additional competitive underwriting (ACU). The MUC of each PD is computed to ensure that at least 50 per cent of each issue is mandatorily covered by the aggregate amount of MUC of PDs. The MUC is uniform for all PDs, irrespective of their capital or balance sheet size. Given that there are 17 PDs at present, each PD will be deemed to underwrite about 3 per cent of the notified amount of each auction as MUC. The remaining portion of the notified amount is open to competitive underwriting through underwriting auctions. Each PD is required to bid in the ACU for a minimum of 3.0 per cent and not more than 30 per cent of the notified amount. All successful bidders in the ACU auction get commission as per the auction rules. Those PDs, who succeed in the ACU for 4.0 per cent and above of the notified amount of the issue, get commission on their MUC (about 3.0 per cent) at the weighted average of all the accepted bids in the ACU. Others get commission at the weighted average rate of the three lowest bids in the ACU on 3.0 per cent in MUC.
Box V.3: Diversification of Activities by Stand Alone Primary Dealers – Operational Guidelines
PDs were permitted to diversify their activities, as considered appropriate, in addition to their existing business of Government securities from July 4, 2006, subject to specific conditions. The salient features of the guidelines are: (i) PDs desirous of diversifying their activities should have a minimum net owned funds (NOF) of Rs.100 crore as against Rs.50 crore for a PD, which does not propose to diversify its activities; (ii) The eligible PDs may bifurcate their operations into core activities and non-core activities. The core activities should involve dealing in Government securities and other fixed income securities and the non-core activities of PDs may include investment/ trading in equity/units of equity oriented mutual funds/ advisory services/merchant banking and other specified activities. However, all PDs are required to ensure predominance of investment in Government securities business by maintaining at least 50 per cent of their total financial investments (both long-term and short-term) in Government securities at any point of time; (iii) The exposure to non-core activities shall be subject to risk capital allocation. PDs may calculate the capital charge for market risk on the stock positions/underlying stock positions/units of equity oriented mutual funds using Internal Models (VaR based) based on the prescribed Reserve Bank guidelines. The capital charge for market risk so calculated should not be more than 20 per cent of the NOF as per the last audited balance sheet; and (iv) PDs are not permitted to set up step-down subsidiaries. PDs that already have step-down subsidiaries (in India and abroad) may restructure the ownership pattern of such subsidiaries. If the PD is a subsidiary of a holding company, the step-down subsidiary of the PD may become another direct subsidiary of the holding company. In case the PD itself is a holding company, then the step-down subsidiary may take up the PD activity and the holding entity may take up activities other than those permitted for PDs. The restructuring, as above, should be completed within a period of six months.
5.88 With a view to allowing stand alone PDs to generate alternate streams of income, they were allowed to diversify their activities (Box V.3). Operations and Performance of PDs
5.89 The aggregate bidding commitments of PDs for Treasury bill auctions during 2005-06 were fixed at 125.0 per cent of the total issuances of Rs.80,044 crore. Against their aggregate commitment, PDs bid for Rs.1,81,499 crore, i.e., 226.7 per cent of the issues. Of these, Rs.60,115 crore bids were accepted. In the case of dated Government securities, PDs made a bid for Rs.1,46,885 crore, including non-competitive bids of Rs.621 crore, against bidding commitment of Rs.99,100 crore. The success ratio achieved by PDs during the year was 42.1 per cent. As underwriters, PDs offered to underwrite Rs.1,43,536 crore of the primary issues during the year, out of which bids for Rs.90,590 crore were accepted. No amount devolved on PDs during the year.
5.90 The share of total primary market purchases by PDs in Treasury Bills auctions (including MSS) was lower during 2005-06 at 34.0 per cent as against 63.0 per cent during 2004-05. For dated securities, the PDs’ share in primary market purchase was marginally higher at 48.0 per cent during the year as compared with 47.0 per cent in the previous year.
5.91 The secondary market turnover of Treasury Bills and Government dated securities (both outright and repo) traded by PDs amounted to Rs.4,45,961 crore and Rs.15,28,148 crore, respectively, constituting 29.4 per cent and 22.4 per cent, respectively, of the market turnover.
Sources and Application of Funds
5.92 The financial position of PDs increased significantly (17.1 per cent) during the year ended March 2006 in contrast to the sharp decline (30.5 per cent) in the previous year. Net owned funds of PDs increased by 7.8 per cent despite a decline in capital. Loans, as a source of funds, increased sharply. On the deployment side, while investments in Government securities registered a moderate decline, that in commercial paper registered a significant increase (Table V.43). The share of Government securities and Treasury Bills in total assets of PDs declined to 60.9 per cent at end-March 2006 from 71.5 per cent at end-March 2005 (Table V.44 and Appendix Table V.5).
5.93 PDs continued to remain adequately capitalised. The CRAR of PDs at 53.9 per cent at end-March 2006 was much in excess of the stipulated minimum of 15 per cent of aggregate risk-weighted assets (Table V.44).
Financial Performance of PDs
5.94 Income earned by PDs increased sharply during 2005-06 on account of an increase in interest and discount, significant reduction in trading losses and sharp growth in other income. PDs, which had reported a loss of Rs.700 crore
Table V.43: Sources and Application of Funds
of Primary Dealers |
(As at end-March) |
(Amount in Rs. crore) |
Item |
2005 |
2006 |
Percentage |
|
|
|
Variation |
|
|
|
2004-05 |
2005-06 |
1 |
2 |
3 |
4 |
5 |
Sources of Funds |
11,911 |
13,953 |
-30.5 |
17.1 |
1. |
Capital |
2,332 |
2,263 |
-0.9 |
-3.0 |
2. |
Reserves and surplus |
3,334 |
3,843 |
-9.3 |
15.3 |
3. |
Loans (i+ii) |
6,245 |
7,847 |
-43.8 |
25.7 |
|
i) Secured |
2,445 |
3,480 |
47.8 |
42.3 |
|
ii) Unsecured |
3,800 |
4,367 |
-59.8 |
14.9 |
Application of Funds |
11,911 |
13,953 |
-30.5 |
17.1 |
1. |
Fixed assets |
75 |
71 |
5.1 |
-5.3 |
2. |
Investments (i to iii) |
10,140 |
10,425 |
-37.8 |
2.8 |
|
i) Government securities |
|
|
|
|
|
and Treasury Bills |
8,521 |
8,495 |
-41.4 |
-0.3 |
|
ii) Commercial paper |
443 |
846 |
260.2 |
91.0 |
|
iii) Corporate bonds |
1,176 |
1,084 |
-42.8 |
-7.8 |
3. |
Loans and advances |
2,322 |
2,398 |
-9.5 |
3.3 |
4. |
Non-current assets |
– |
– |
– |
– |
5. |
Others* |
-626 |
1,059 |
-63.4 |
269.2 |
|
|
|
|
|
|
– : Nil/Negligible.
* : Including cash and bank balance, Accrued interest, Deferred tax less current liabilities and provisions.
Source : Respective PDs. |
in trading in securities during the previous year, reduced such losses to Rs.47 crore during
Table V.44: Select Indicators of Primary Dealers |
(Amount in Rs. crore) |
Item |
End-March |
|
2005 |
2006 |
1 |
2 |
3 |
|
|
|
Total Assets* |
11,911 |
13,953 |
of which : |
|
|
Government securities and Treasury Bills |
8,521 |
8,495 |
Total Capital Funds |
5,603 |
5,992 |
CRAR (in per cent) |
54.3 |
53.9 |
Liquidity Support Limit |
3,000 |
3,000 |
|
(normal) |
(normal) |
* : Net of current liabilities and provisions. |
Table V.45: Financial Performance of |
Primary Dealers |
(Amount in Rs. crore) |
Item |
2004-05 |
2005-06 |
Percentage Variation |
|
|
|
2004-05 2005-06 |
|
|
|
|
|
1 |
2 |
3 |
4 |
5 |
A. Income (i to iii) |
574 |
2,153 |
-79.8 |
275.1 |
i) |
Interest and discount |
821 |
1,151 |
-37.1 |
40.2 |
ii) |
Trading Profit |
-700 |
-47 |
-161.9 |
93.3 |
iii) |
Other income |
453 |
1,049 |
11.0 |
131.6 |
B. Expenses (i+ii) |
769 |
1,150 |
-21.3 |
49.7 |
i) |
Interest |
459 |
670 |
-29.9 |
46.0 |
ii) |
Administrative Costs |
310 |
481 |
-3.7 |
55.2 |
C. Profit Before Tax |
-195 |
1,003 |
-110.4 |
614.4 |
D. Profit After Tax |
-250 |
749 |
-120.3 |
399.6 |
2005-06 (Table V.45). As a result of sharp increase in income, PDs were able to earn sizeable net profits, despite a significant increase in expenditure. The number of PDs posting net profit rose to 14 during 2005-06 from 10 in the previous year (Appendix Table V.6).
5.95 The turnaround in financial performance of PDs was reflected in return on average asset (RoA), which improved from -1.7 per cent to 5.2 per cent and return on net worth, which also turned around from -4.5 per cent to 12.9 per cent during the year (Table V.46 and Appendix Table V.6).
Table V.46: Financial Indicators of |
Primary Dealers |
(Amount in Rs. crore) |
Indicator |
2004-05 |
2005-06 |
1 |
2 |
3 |
1. |
Net profit |
-250 |
749 |
2. |
Average Asset |
15,133 |
14,534 |
3. |
Return on average assets
(per cent) |
-1.7 |
5.2 |
4. |
Net Owned Funds |
5,666 |
6,106 |
Note : Average assets are average of the month-end balances. |
|
 IST,
IST,


