 IST,
IST,


Non- Banking Financial Institutions (Part 2 of 2)
|
Table V.19: Range of Deposits held by Non-Banking Financial Companies |
|||||||
|
(Amount in Rs. crore) |
|||||||
|
Deposit range |
As at end-March |
||||||
|
No. of NBFCs |
Amount of deposits |
||||||
|
2003 |
2004 |
2005 |
2003 |
2004 |
2005 |
||
|
1 |
2 |
3 |
4 |
5 |
6 |
7 |
|
|
1. |
Less than Rs.0.5 crore |
491 |
428 |
287 |
65 |
53 |
37 |
|
(1.3) |
(1.2) |
(1.0) |
|||||
|
2. |
More than Rs.0.5 crore and up to Rs.2 crore |
233 |
210 |
168 |
225 |
206 |
164 |
|
(4.5) |
(4.8) |
(4.5) |
|||||
|
3. |
More than Rs.2 crore and up to Rs.10 crore |
90 |
82 |
70 |
360 |
352 |
320 |
|
(7.1) |
(8.2) |
(8.8) |
|||||
|
4. |
More than Rs.10 crore and up to Rs.20 crore |
21 |
18 |
16 |
284 |
242 |
250 |
|
(5.6) |
(5.6) |
(6.9) |
|||||
|
5. |
More than Rs.20 crore and up to Rs.50 crore |
12 |
17 |
14 |
364 |
569 |
507 |
|
(7.2) |
(13.2) |
(13.9) |
|||||
|
6. |
Rs.50 crore and above |
23 |
19 |
15 |
3,737 |
2,895 |
2,368 |
|
(74.3) |
(67.0) |
(64.9) |
|||||
|
Total |
870 |
774 |
570 |
5,035 |
4,317 |
3,646 |
|
|
(100.0) |
(100.0) |
(100.0) |
|||||
|
Note: Figures in parentheses are percentages to total deposit. |
|||||||
‘more than Rs.20 crore and up to Rs.50 crore’, which increased sharply during 2003-04. Fifteen companies in the deposit size of ‘Rs.50 crore and above’ held 64.9 per cent of total public deposits held by all NBFCs at end-March 2005. Twenty nine NBFCs with deposit size of ‘Rs.20 crore and above’, held more than 78.8 per cent of total deposits, while remaining 541 companies held little more than 21.2 per cent of total public deposits (Table V.19).
Region-wise Composition of Deposits held by NBFCs
5.58 Deposits held by NBFCs across all the regions declined during 2003-04 and 2004-05. The Southern region accounted for the largest share of deposits (75.9 per cent) held by NBFCs at end March 2005, followed distantly by other regions This was on account of largest share of deposits (71.1 per cent) held by Chennai (Table V.20).
|
Table V.20: Public Deposits held by Registered and Unregistered NBFCs - Region-wise |
||||||
|
(Amount in Rs. crore) |
||||||
|
Region |
2002-03 |
2003-04 |
2004-05 |
|||
|
No. of NBFCs |
Amount |
No. of NBFCs |
Amount |
No. of NBFCs |
Amount |
|
|
1 |
2 |
3 |
4 |
5 |
6 |
7 |
|
Northern |
271 |
543 |
248 |
442 |
195 |
351 |
|
(10.8) |
(10.2) |
(9.6) |
||||
|
North-Eastern |
1 |
2 |
1 |
1 |
– |
– |
|
(0.0) |
(0.0) |
|||||
|
Eastern |
18 |
212 |
17 |
204 |
13 |
158 |
|
(4.2) |
(4.7) |
(4.3) |
||||
|
Central |
82 |
112 |
75 |
101 |
66 |
92 |
|
(2.2) |
(2.3) |
(2.5) |
||||
|
Western |
63 |
687 |
41 |
365 |
27 |
280 |
|
(13.6) |
(8.5) |
(7.7) |
||||
|
Southern |
435 |
3,479 |
392 |
3,205 |
269 |
2,765 |
|
(69.1) |
(74.2) |
(75.9) |
||||
|
Total |
870 |
5,035 |
774 |
4,318 |
570 |
3,646 |
|
Metropolitan cities: |
||||||
|
Mumbai |
45 |
672 |
23 |
351 |
14 |
268 |
|
Chennai |
318 |
3,162 |
304 |
2,879 |
217 |
2,591 |
|
Kolkata |
15 |
203 |
14 |
187 |
11 |
158 |
|
New Delhi |
108 |
443 |
98 |
345 |
71 |
266 |
|
Total |
486 |
4,480 |
439 |
3,762 |
313 |
3,283 |
|
– : Nil/Negligible. |
||||||
Interest Rate and Maturity Pattern of Public Deposits with NBFCs
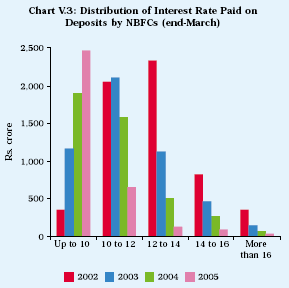
5.59 Deposits contracted by NBFCs at interest rates up to 10 per cent increased sharply during the year ended March 2004 as well as March 2005, while deposits contracted at all other interest rates declined significantly. However, some portion of the deposits accepted by NBFCs was at interest rate of above 14 per cent or even 16 per cent. About 71 per cent of the deposits contracted at end-March 2005 were at interest rate up to 10 per cent (Table V.21).
5.60 In line with the general decline in the interest rate over the years, interest rates paid by NBFCs on deposits have also declined steadily over the years, which was reflected in the increase in the share of deposits contracted at interest rate of up to 10 per cent and decline in the share of deposits accepted at 12 to 14 per cent (Chart V.3).
The Maturity Pattern of Public Deposits
5.61 Deposits contracted by NBFCs in all maturity ranges declined significantly during 2003-04 and 2004-05. Deposits in the maturity range of ‘more than 2 and up to 3 years’ accounted for the largest share (35.5 per cent) at end-March 2005 (Table V.22).
5.62 The spread between the maximum interest rate on public sector bank deposits of ‘one to three
|
Table V.21: Distribution of Public Deposits of |
|||
|
(Amount in Rs. crore) |
|||
|
Interest Range |
As at end-March |
||
|
2003 |
2004 |
2005 |
|
|
1 |
2 |
3 |
4 |
|
Up to 10 per cent |
1,174 |
1,896 |
2,604 |
|
(23.3) |
(43.9) |
(71.4) |
|
|
More than 10 per cent |
|||
|
and up to 12 per cent |
2,101 |
1,586 |
726 |
|
(41.7) |
(36.7) |
(19.9) |
|
|
More than 12 per cent |
|||
|
and up to 14 per cent |
1,137 |
505 |
164 |
|
(22.6) |
(11.7) |
(4.5) |
|
|
More than 14 per cent |
|||
|
and up to 16 per cent |
475 |
254 |
109 |
|
(9.4) |
(5.9) |
(3.0) |
|
|
16 per cent and above |
148 |
76 |
43 |
|
(3.0) |
(1.8) |
(1.2) |
|
|
Total |
5,035 |
4,317 |
3,646 |
|
(100.0) |
(100.0) |
(100.0) |
|
|
Note: Figures in parentheses are |
|||
year’ maturity and the interest rate offered by NBFCs on deposits with the same maturity narrowed down over the years (Table V.23).
Borrowings
5.63 The outstanding borrowings by NBFCs, which declined by 14.8 per cent during the year ended March 2004 on account of decline in the borrowings by equipment leasing companies and
|
Table V.22: Maturity Pattern of Public |
|||
|
(Amount in Rs. crore) |
|||
|
Maturity Period @ |
As at end-March |
||
|
2003 |
2004 |
2005 |
|
|
1 |
2 |
3 |
4 |
|
Less than 1 year |
1,203 |
1,176 |
1,145 |
|
(23.9) |
(27.3) |
(31.4) |
|
|
More than 1 and up |
|||
|
to 2 years |
1,241 |
1,046 |
862 |
|
(24.6) |
(24.2) |
(23.6) |
|
|
More than 2 and up |
|||
|
to 3 years |
1,927 |
1,573 |
1,295 |
|
(38.3) |
(36.4) |
(35.5) |
|
|
More than 3 and up |
|||
|
to 5 years |
619 |
492 |
330 |
|
(12.3) |
(11.4) |
(9.0) |
|
|
5 years and above |
45 |
30 |
14 |
|
(0.9) |
(0.7) |
(0.4) |
|
|
Total |
5,035 |
4,317 |
3,646 |
|
(100.0) |
(100.0) |
(100.0) |
|
|
@ :On the basis of residual maturity of outstanding deposits. Note: Figures in parentheses are percentages to total deposits. |
|||
|
Table V.23: Maximum/Ceiling Interest Rates on Banks and NBFC Deposits |
|||||||
|
(Per cent) |
|||||||
|
Interest Rate |
As at end-March |
||||||
|
2000 |
2001 |
2002 |
2003 |
2004 |
2005 |
||
|
1 |
2 |
3 |
4 |
5 |
6 |
7 |
|
|
1. |
Maximum interest rate on public sector bank deposits |
||||||
|
of 1-3 year maturity |
10.5 |
9.5 |
8.5 |
6.75 |
6.75 |
7.00 |
|
|
2. |
Ceiling interest rate for NBFCs |
16.0 |
14.0 |
12.5 |
11.0 |
11.0 |
11.0 |
|
3. |
Spread (2-1) |
5.5 |
4.5 |
4.0 |
4.25 |
4.25 |
4.00 |
hire purchase companies, increased marginally during the year ended March 2005. Hire purchase companies continued to account for the largest share (59.6 per cent) of total borrowings by all NBFCs (Table V.24).
5.64 Borrowings by NBFCs from banks and FIs and external sources declined, while those by way of debentures increased during 2003-04 and 2004-05. Borrowings from the Government, which had increased marginally during the year ended March 2004, declined sharply in the following year. Borrowings from the Government relate mostly to one State-owned NBFC operating in the Southern region. Hire purchase companies have been the most active in raising resources from banks/FIs and the debt market. Borrowings from banks and financial institutions by equipment leasing and hire purchase companies, which declined sharply during 2003-04, increased marginally in 2004-05. On the other
hand, borrowings by loan companies from banks and FIs after increasing sharply in 2003-04, declined in 2004-05 (Table V.25). Debentures emerged as the most important source of funds for NBFCs during the year ended March 2005, relegating the borrowings from banks and FIs to the second position. Between end-March 2003 and end-March 2005, while the share of borrowings by way of debentures increased from 21.9 per cent to 30.6 per cent, that of borrowings from banks and FIs declined from 36.6 per cent to 27.1 per cent.
Assets of NBFCs
5.65 Advances constitute the main assets of NBFCs. Reflecting the decline in deposits and borrowings, advances extended by all NBFCs declined during the year, barring those by loan companies during the year ended March 2004. While advances by equipment leasing companies and hire
|
Table V.24: Borrowings by NBFCs –Group-wise |
||||||||
|
(Amount in Rs. crore) |
||||||||
|
NBFC Group |
As at end-March |
Percentage |
||||||
|
Variation |
||||||||
|
No. of NBFCs |
Total Borrowings |
|||||||
|
2003 |
2004 |
2005 |
2003 |
2004 |
2005 |
2003-04 |
2004-05 |
|
|
1 |
2 |
3 |
4 |
5 |
6 |
7 |
8 |
9 |
|
Equipment Leasing |
58 |
46 |
38 |
6,472 |
2,811 |
3,112 |
-56.6 |
10.7 |
|
(26.4) |
(13.5) |
(14.2) |
||||||
|
Hire Purchase |
439 |
396 |
316 |
13,650 |
12,141 |
13,008 |
-11.1 |
7.1 |
|
(55.8) |
(58.2) |
(59.6) |
||||||
|
Investment |
19 |
11 |
5 |
1,613 |
1,718 |
1,092 |
6.5 |
-36.4 |
|
(6.6) |
(8.2) |
(5.0) |
||||||
|
Loan |
122 |
87 |
54 |
2,600 |
3,775 |
3,679 |
45.2 |
-2.5 |
|
(10.6) |
(18.1) |
(16.8) |
||||||
|
Others |
232 |
234 |
157 |
145 |
407 |
950 |
180.7 |
133.4 |
|
(0.6) |
(2.0) |
(4.4) |
||||||
|
Total |
870 |
774 |
570 |
24,480 |
20,852 |
21,841 |
-14.8 |
4.7 |
|
(100.0) |
(100.0) |
(100.0) |
||||||
|
Note: Figures in parentheses are percentages to total borrowings. |
||||||||
|
Table V.25: Sources of Borrowings of NBFCs |
||||||||||||||||
|
(Amount in Rs. crore) |
||||||||||||||||
|
NBFC Group |
As at end-March |
|||||||||||||||
|
Government |
External |
Banks and |
Debentures |
Others |
||||||||||||
|
Financial Institutions |
||||||||||||||||
|
2003 |
2004 |
2005 |
2003 |
2004 |
2005 |
2003 |
2004 |
2005 |
2003 |
2004 |
2005 |
2003 |
2004 |
2005 |
||
|
1 |
2 |
3 |
4 |
5 |
6 |
7 |
8 |
9 |
10 |
11 |
12 |
13 |
14 |
15 |
16 |
|
|
Equipment Leasing |
61 |
21 |
– |
571 |
291 |
190 |
3,080 |
1,141 |
1,252 |
1,639 |
893 |
1219 |
1,121 |
465 |
452 |
|
|
(-65.6) |
(-100.0) |
(-49.0) |
(-34.7) |
(-63.0) |
(9.7) |
(-45.5) |
(36.5) |
(-58.5) |
(-2.8) |
|||||||
|
Hire Purchase |
85 |
91 |
– |
124 |
332 |
327 |
5,613 |
4,114 |
4,223 |
2,721 |
3,919 |
4,425 |
5,107 |
3,684 |
4,033 |
|
|
(7.1) |
(-100.0) |
(167.7) |
(-1.5) |
(-26.7) |
(2.6) |
(44.0) |
(12.9) |
(-27.9) |
(9.5) |
|||||||
|
Investment |
1,423 |
1,467 |
885 |
– |
– |
– |
14 |
14 |
10 |
– |
42 |
12 |
176 |
196 |
185 |
|
|
(3.1) |
(-39.7) |
(-28.6) |
(-) |
(-71.4) |
(11.4) |
(-5.6) |
||||||||||
|
Loan |
– |
– |
86 |
– |
– |
– |
245 |
1,132 |
413 |
992 |
1,065 |
1,037 |
1,363 |
1,579 |
2,142 |
|
|
(362.0) |
(-63.5) |
(7.4) |
(-2.6) |
(15.8) |
(35.7) |
|||||||||||
|
Others |
– |
– |
– |
– |
– |
– |
7 |
13 |
31 |
– |
– |
– |
138 |
394 |
920 |
|
|
(85.7) |
(138.5) |
(185.5) |
(133.5) |
|||||||||||||
|
Total |
1,570 |
1,579 |
971 |
695 |
623 |
517 |
8,959 |
6,413 |
5,929 |
5,352 |
5,919 |
6,693 |
7,905 |
6,318 |
7,732 |
|
|
(0.6) |
(-38.5) |
(-10.2) |
(-17.0) |
(-28.4) |
(-7.5) |
(10.6) |
(13.1) |
(-20.1) |
(22.4) |
|||||||
|
– : Nil/Negligible. |
||||||||||||||||
purchase companies increased during the year ended March 2005, those by investment and loan companies declined. Investment by NBFCs also declined during the years ended March 2004 and March 2005, reflecting mainly the impact of decline in investment by two major groups, i.e., equipment leasing and hire purchase companies (Table V.26).
Distribution of NBFCs According to Asset Size
5.66 The asset size of NBFCs varies significantly from less than Rs.25 lakh to above
Rs.500 crore. Most of the companies were in the asset range of more than Rs.50 lakh and up to Rs.10 crore. However, bulk of the assets were held by NBFCs in the large asset size. Sixteen companies with asset size of above Rs.500 crore held 79.4 per cent of total assets of all NBFCs as at end-March 2005 (Table V.27).
Distribution of Assets of NBFCs – Type of Activity
5.67 Assets held by NBFCs in loans and inter-corporate deposits, investments, and equipment and
|
Table V.26: Major Components of Assets of NBFCs – Group-wise |
|||||||||
|
(Amount in Rs. crore) |
|||||||||
|
NBFC Group |
As at end-March |
||||||||
|
Assets |
Advances |
Investment |
|||||||
|
2003 |
2004 |
2005 |
2003 |
2004 |
2005 |
2003 |
2004 |
2005 |
|
|
1 |
2 |
3 |
4 |
5 |
6 |
7 |
8 |
9 |
10 |
|
Equipment Leasing |
7,996 |
3,744 |
4,721 |
7,087 |
3,020 |
3,875 |
1,028 |
348 |
331 |
|
(21.2) |
(11.4) |
(13.9) |
(22.8) |
(11.3) |
(13.9) |
(23.7) |
(9.1) |
(9.4) |
|
|
Hire Purchase |
22,163 |
19,929 |
20,039 |
18,849 |
17,114 |
18,312 |
1,909 |
1,805 |
1,202 |
|
(58.8) |
(60.8) |
(59.2) |
(60.7) |
(64.1) |
(65.8) |
(44.0) |
(47.3) |
(34.3) |
|
|
Investment |
2,208 |
2,422 |
1,890 |
1,520 |
1,617 |
1,061 |
629 |
750 |
788 |
|
(5.9) |
(7.4) |
(5.6) |
(4.9) |
(6.1) |
(3.8) |
(14.5) |
(19.6) |
(22.5) |
|
|
Loan |
4,109 |
5,485 |
5,319 |
2,763 |
4,208 |
3,456 |
527 |
604 |
657 |
|
(10.9) |
(16.7) |
(15.7) |
(8.9) |
(15.8) |
(12.4) |
(12.1) |
(15.8) |
(18.7) |
|
|
Others |
1,233 |
1,173 |
1,874 |
818 |
745 |
1,129 |
245 |
311 |
530 |
|
(3.3) |
(3.6) |
(5.5) |
(2.6) |
(2.8) |
(4.1) |
(5.6) |
(8.1) |
(15.1) |
|
|
Total |
37,709 |
32,753 |
33,843 |
31,037 |
26,704 |
27,833 |
4,338 |
3,818 |
3,508 |
|
(100.0) |
(100.0) |
(100.0) |
(100.0) |
(100.0) |
(100.0) |
(100.0) |
(100.0) |
(100.0) |
|
|
Note: Figures in parentheses represent percentage share in total. |
|||||||||
|
Table V.27: Non-Banking Financial Companies According to Asset Size |
|||||||
|
(Amount in Rs. crore) |
|||||||
|
Asset size |
As at end-March |
||||||
|
2003 |
2004 |
2005 |
2003 |
2004 |
2005 |
||
|
No. of reporting companies |
Assets |
||||||
|
1 |
2 |
3 |
4 |
5 |
6 |
7 |
|
|
1. |
Less than 0.25 |
62 |
59 |
34 |
6 |
6 |
4 |
|
(0.0) |
(0.0) |
(0.0) |
|||||
|
2. |
More than 0.25 and up to 0.50 |
77 |
73 |
41 |
28 |
27 |
15 |
|
(0.1) |
(0.1) |
(0.1) |
|||||
|
3. |
More than 0.50 and 2 |
354 |
317 |
209 |
388 |
352 |
232 |
|
(1.0) |
(1.0) |
(0.7) |
|||||
|
4. |
More than 2 and up to 10 |
245 |
209 |
164 |
1,131 |
964 |
724 |
|
(3.0) |
(2.9) |
(2.1) |
|||||
|
5. |
More than 10 and up to 50 |
68 |
69 |
71 |
1,399 |
1,593 |
1,765 |
|
(3.7) |
(4.9) |
(5.2) |
|||||
|
6. |
More than 50 and up to 100 |
19 |
13 |
18 |
1,315 |
850 |
1,216 |
|
(3.5) |
(2.6) |
(3.6) |
|||||
|
7. |
More than 100 and up to 500 |
28 |
17 |
17 |
6,492 |
3,819 |
3,007 |
|
(17.2) |
(11.7) |
(8.9) |
|||||
|
8. |
Above 500 |
17 |
17 |
16 |
26,950 |
25,143 |
26,880 |
|
(71.5) |
(76.8) |
(79.4) |
|||||
|
Total |
870 |
774 |
570 |
37,709 |
32,754 |
33,843 |
|
|
(100.0) |
(100.0) |
(100.0) |
|||||
|
Note: Figures in parentheses are percentages to total. |
|||||||
leasing declined during 2003-04 and 2004-05. However, assets in hire purchase, which declined during 2003-04, increased sharply in the following year. As a result, assets held in hire purchase
activity accounted for the largest share (42.0 per cent) of total assets of NBFCs, followed by loans, including inter-corporate deposits (33.4 per cent) (Table V.28).
|
Table V.28: Distribution of Assets of NBFCs - Activity-wise |
|||||||
|
(Amount in Rs. crore) |
|||||||
|
Activity |
As at end-March |
Percentage Variation |
|||||
|
2003 |
2004 |
2005 |
2002-03 |
2003-04 |
2004-05 |
||
|
1 |
2 |
3 |
4 |
5 |
6 |
7 |
|
|
1. |
Loans and Inter-corporate deposits |
13,398 |
12,363 |
11,301 |
-2.3 |
-7.7 |
-8.6 |
|
(35.4) |
(37.7) |
(33.4) |
|||||
|
2. |
Investments |
4,338 |
3,818 |
3,508 |
0.1 |
-12.0 |
-8.1 |
|
(11.5) |
(11.7) |
(10.4) |
|||||
|
3. |
Hire Purchase |
13,031 |
11,649 |
14,200 |
-1.3 |
-10.6 |
21.9 |
|
(34.5) |
(35.6) |
(42.0) |
|||||
|
4. |
Equipment and Leasing |
2,011 |
1,115 |
778 |
-35.4 |
-44.6 |
-30.2 |
|
(5.3) |
(3.4) |
(2.3) |
|||||
|
5. |
Bills |
450 |
436 |
464 |
-33.1 |
-3.2 |
6.4 |
|
(1.2) |
(1.3) |
(1.4) |
|||||
|
6. |
Other assets |
4,581 |
3,375 |
3,592 |
-4.6 |
-26.3 |
6.4 |
|
(12.1) |
(10.3) |
(10.6) |
|||||
|
Total |
37,809 |
32,756 |
33,843 |
-5.3 |
-13.4 |
3.3 |
|
|
(100.0) |
(100.0) |
(100.0) |
|||||
|
Note: Figures in parentheses are percentages to total. |
|||||||
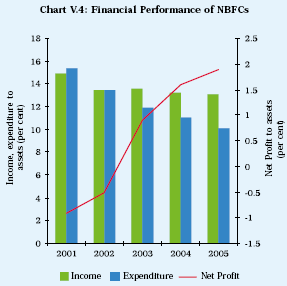
Financial Performance of NBFCs
5.68 Financial performance of NBFCs improved during 2003-04 and 2004-05 due mainly to containment of expenditure. Both fund-based and fee-based income of NBFCs declined during the year ended March 2004. During 2004-05, fund-based income and fee-based income improved marginally. Financial and operating expenditure declined during 2003-04 and 2004-05, resulting in improvement in the operating profit and net profit. Increase in net profit for the year ended March 2004, to an extent, was also due to decline in tax provisions. Improvement in net profit combined with decline in total assets led to an improvement in the net profit to asset ratio in 2003-04 and further in 2004-05 (Table V.29 and Chart V.4).
Interest Cost to Total Income
5.69 Interest cost as per cent to total income which increased marginally during 2003-04, declined sharply in the following year. Non-interest costs relative to total income declined in both the years. As a result, cost to income ratio declined
significantly from 88.3 per cent in 2002-03 to 83.8 per cent in 2003-04 and further to 78.8 per cent during 2004-05 (Table V.30).
|
Table V.29: Financial Performance of NBFCs |
||||||||
|
(Amount in Rs. crore) |
||||||||
|
Item |
Percentage Variation |
|||||||
|
2002-03 |
2003-04 |
2004-05 |
2002-03 |
2003-04 |
2004-05 |
|||
|
1 |
2 |
3 |
4 |
5 |
6 |
7 |
||
|
A. |
Income (i+ii) |
5,084 |
4,332 |
4,435 |
-5.1 |
-14.8 |
2.4 |
|
|
(100.0) |
(100.0) |
(100.0) |
||||||
|
(i) |
Fund-based |
4,709 |
4,005 |
4,062 |
-5.9 |
-15.0 |
1.4 |
|
|
(92.6) |
(92.5) |
(91.6) |
||||||
|
(ii) |
Fee-based |
375 |
327 |
373 |
6.5 |
-12.8 |
14.1 |
|
|
(7.4) |
(7.5) |
(8.4) |
||||||
|
B. |
Expenditure (i+ii) |
4,491 |
3,621 |
3,495 |
-15.6 |
-19.4 |
-3.5 |
|
|
(100.0) |
(100.0) |
(100.0) |
||||||
|
(i) |
Financial |
2,757 |
2,099 |
2,054 |
-16.4 |
-23.9 |
-2.1 |
|
|
(61.4) |
(58.0) |
(58.8) |
||||||
|
(ii) |
Operating |
1,734 |
1,522 |
1,441 |
-14.3 |
-12.2 |
-5.3 |
|
|
(38.6) |
(42.0) |
(41.2) |
||||||
|
C. |
Tax |
Provisions |
254 |
180 |
349 |
2.4 |
-29.1 |
93.9 |
|
D. |
Operating Profit (PBT) |
593 |
711 |
940 |
1,547.2 |
19.9 |
32.2 |
|
|
E. |
Net Profit (PAT) |
339 |
531 |
591 |
-259.9 |
56.6 |
11.3 |
|
|
F. |
Total Assets |
37,709 |
32,754 |
33,843 |
-5.3 |
-13.1 |
3.3 |
|
|
G. |
Financial Ratios* |
|||||||
|
(i) |
Income |
13.5 |
13.2 |
13.1 |
||||
|
(ii) |
Fund Income |
12.5 |
12.2 |
12.0 |
||||
|
(iii) |
Fee Income |
1.0 |
1.0 |
1.1 |
||||
|
(iv) |
Expenditure |
11.9 |
11.0 |
10.3 |
||||
|
(v) |
Financial Expenditure |
7.3 |
6.4 |
6.1 |
||||
|
(vi) |
Operating Expenditure |
2.9 |
3.1 |
4.2 |
||||
|
(vii) |
Tax Provisions |
0.7 |
0.5 |
1.0 |
||||
|
(viii) |
Net Profit |
0.9 |
1.6 |
1.7 |
||||
|
* : As percentage to total assets. |
||||||||
|
Table V.30: Interest Cost to Total Income |
||||
|
(Amount in Rs. crore) |
||||
|
Year |
Total |
Total |
Interest |
Non-Interest |
|
Income |
Cost |
Cost |
Cost |
|
|
1 |
2 |
3 |
4 |
5 |
|
2002-03 |
5,084 |
4,491 |
974 |
3,517 |
|
(88.3 ) |
(19.2) |
(69.2) |
||
|
2003-04 |
4,322 |
3,621 |
888 |
2,733 |
|
(83.8) |
(20.5) |
(63.2) |
||
|
2004-05 |
4,435 |
3,495 |
760 |
2,735 |
|
(78.8) |
(17.1) |
(61.7) |
||
|
Note: Figures in parentheses indicate |
||||
Soundness Indicators
Asset Quality of NBFCs
5.70 Gross and net non-performing assets of the reporting NBFCs, as a group, registered a steady decline between end-March 2001 and end-March 2004. While gross NPAs continued to decline during the year ended March 2005, net NPAs increased significantly (Table V.31).
|
Table V.31: Non-Performing |
||
|
(per cent of credit exposure) |
||
|
End-March |
Gross NPAs |
Net NPAs |
|
1 |
2 |
3 |
|
2001 |
11.5 |
5.6 |
|
2002 |
10.6 |
3.9 |
|
2003 |
8.8 |
2.7 |
|
2004 |
8.2 |
2.4 |
|
2005 |
7.0 |
3.4 |
|
* : Excluding MBFCs, MBCs and MNBCs. |
||
5.71 Asset quality of different NBFC groups showed a divergent trend. Gross NPAs as a percentage to total assets of equipment leasing companies, hire purchase companies and investment companies increased during 2003-04, but declined during 2004-05. Gross NPAs of loan companies, however, declined in both the years. More or less the same trend was discernable in respect of net NPAs. Investment companies had the lowest gross NPA ratio at end-March 2005 (1.8 per cent), followed by loan companies (3.7 per cent), hire purchase companies (4.6 per cent) and equipment leasing companies (12.3 per cent) (Table V.32).
|
Table V.32: NPAs of NBFCs - Group-wise |
||||||||
|
(Amount in Rs. crore) |
||||||||
|
NBFC Group/ |
Gross |
Gross NPAs |
Net |
Net NPAs |
||||
|
End-March |
Advances |
Advances |
||||||
|
Amount |
Per cent to |
Per cent to |
Amount |
Per cent to |
Per cent to |
|||
|
Gross Advances |
Assets |
Net Advances |
Assets |
|||||
|
1 |
2 |
3 |
4 |
5 |
6 |
7 |
8 |
9 |
|
Equipment Leasing |
||||||||
|
2001 |
4,118 |
304 |
7.4 |
6.1 |
3,826 |
12 |
0.3 |
0.2 |
|
2002 |
1,625 |
646 |
39.7 |
28.0 |
1,330 |
351 |
26.3 |
15.2 |
|
2003 |
5,969 |
932 |
15.6 |
11.1 |
5,506 |
469 |
8.5 |
5.6 |
|
2004 |
3,306 |
582 |
17.6 |
13.3 |
3,067 |
344 |
11.2 |
7.8 |
|
2005 |
5,611 |
718 |
12.8 |
12.3 |
5,310 |
418 |
7.9 |
7.1 |
|
Hire Purchase |
||||||||
|
2001 |
8,296 |
1,324 |
16.0 |
12.3 |
7,604 |
631 |
8.3 |
5.9 |
|
2002 |
6,825 |
1,167 |
17.1 |
14.8 |
6,068 |
410 |
6.8 |
5.2 |
|
2003 |
16,489 |
1,288 |
7.8 |
6.8 |
15,305 |
104 |
0.7 |
0.5 |
|
2004 |
10,437 |
942 |
9.0 |
7.3 |
9,748 |
253 |
2.6 |
2.0 |
|
2005 |
12,812 |
619 |
4.8 |
4.6 |
12,498 |
306 |
2.4 |
2.3 |
|
Investment |
||||||||
|
2001 |
232 |
53 |
22.9 |
5.1 |
223 |
45 |
20.0 |
4.3 |
|
2002 |
149 |
2 |
1.6 |
0.1 |
147 |
1 |
0.4 |
0.0 |
|
2003 |
93 |
11 |
11.9 |
2.1 |
90 |
8 |
8.9 |
1.5 |
|
2004 |
63 |
15 |
24.2 |
2.6 |
55 |
7 |
12.7 |
1.2 |
|
2005 |
58 |
10 |
17.2 |
1.8 |
58 |
10 |
17.2 |
1.8 |
|
Loan |
||||||||
|
2001 |
7,414 |
595 |
8.0 |
5.9 |
7,118 |
299 |
4.2 |
3.0 |
|
2002 |
3,986 |
549 |
13.8 |
10.1 |
3,615 |
177 |
4.9 |
3.3 |
|
2003 |
2,707 |
144 |
5.3 |
4.8 |
2,503 |
– |
– |
– |
|
2004 |
2,038 |
142 |
7.0 |
4.1 |
1,833 |
– |
– |
– |
|
2005 |
1,906 |
83 |
4.4 |
3.7 |
1,780 |
– |
– |
– |
|
Others |
||||||||
|
2001 |
1,394 |
493 |
35.4 |
24.2 |
1,308 |
407 |
31.1 |
20.0 |
|
2002 |
175 |
9 |
5.1 |
3.0 |
165 |
– |
– |
– |
|
2003 |
294 |
2 |
0.6 |
0.5 |
294 |
1 |
0.5 |
0.4 |
|
2004 |
– |
– |
– |
– |
– |
– |
– |
– |
|
2005 |
– |
– |
– |
– |
– |
– |
– |
– |
|
– : Nil/Negligible. |
||||||||
|
Table V.33: Classification of Assets of NBFCs – Group-wise |
|||||||||||
|
(Amount in Rs. crore) |
|||||||||||
|
Item/End of the Period |
Standard |
Sub-Standard |
Doubtful |
Loss |
Gross |
Total |
|||||
|
Asset |
Asset |
Asset |
Asset |
NPAs |
Assets |
||||||
|
Amount |
per cent |
Amount |
per cent |
Amount |
per cent |
Amount |
per cent |
Amount |
per cent |
||
|
1 |
2 |
3 |
4 |
5 |
6 |
7 |
8 |
9 |
10 |
11 |
12 |
|
Equipment Leasing |
|||||||||||
|
Mar-03 |
5,037 |
84.4 |
520 |
8.7 |
205 |
3.4 |
207 |
3.5 |
932 |
15.6 |
5,969 |
|
Sep-03 |
2,986 |
77.9 |
502 |
13.1 |
194 |
5.1 |
154 |
4.0 |
850 |
22.1 |
3,836 |
|
Mar-04 |
2,724 |
82.4 |
396 |
12.0 |
84 |
2.5 |
102 |
3.1 |
582 |
17.6 |
3,306 |
|
Sep-04 |
3,389 |
87.2 |
365 |
9.4 |
19 |
0.5 |
114 |
2.9 |
498 |
12.8 |
3,887 |
|
Mar-05 |
4,893 |
87.2 |
393 |
7.0 |
98 |
1.7 |
227 |
4.1 |
718 |
12.8 |
5,611 |
|
Hire Purchase |
|||||||||||
|
Mar-03 |
15,201 |
92.2 |
746 |
4.5 |
273 |
1.7 |
269 |
1.6 |
1,288 |
7.8 |
16,489 |
|
Sep-03 |
15,621 |
92.4 |
758 |
4.5 |
245 |
1.5 |
283 |
1.7 |
1,286 |
7.6 |
16,907 |
|
Mar-04 |
9,495 |
91.0 |
613 |
5.9 |
103 |
1.0 |
226 |
2.2 |
942 |
9.0 |
10,437 |
|
Sep-04 |
11,420 |
91.5 |
730 |
5.9 |
118 |
0.9 |
213 |
1.7 |
1,061 |
8.5 |
12,481 |
|
Mar-05 |
12,193 |
95.2 |
401 |
3.1 |
128 |
1.0 |
90 |
0.7 |
619 |
4.8 |
12,812 |
|
Investment |
|||||||||||
|
Mar-03 |
82 |
88.1 |
9 |
9.3 |
2 |
2.4 |
– |
0.2 |
11 |
11.9 |
93 |
|
Sep-03 |
43 |
80.6 |
9 |
16.9 |
1 |
2.4 |
– |
0.1 |
10 |
19.4 |
54 |
|
Mar-04 |
48 |
75.8 |
– |
– |
10 |
15.3 |
6 |
8.9 |
15 |
24.2 |
63 |
|
Sep-04 |
71 |
86.4 |
1 |
1.4 |
10 |
12.1 |
– |
– |
11 |
13.6 |
82 |
|
Mar-05 |
48 |
82.0 |
1 |
1.1 |
10 |
16.7 |
– |
0.2 |
10 |
18.0 |
58 |
|
Loan |
|||||||||||
|
Mar-03 |
2,563 |
94.7 |
37 |
1.3 |
20 |
0.7 |
88 |
3.2 |
145 |
5.3 |
2,708 |
|
Sep-03 |
5,693 |
95.8 |
81 |
1.4 |
59 |
1.0 |
112 |
1.9 |
252 |
4.2 |
5,945 |
|
Mar-04 |
1,896 |
93.0 |
40 |
2.0 |
20 |
1.0 |
82 |
4.0 |
142 |
7.0 |
2,038 |
|
Sep-04 |
1,697 |
93.9 |
28 |
1.6 |
9 |
0.5 |
73 |
4.0 |
110 |
6.1 |
1,807 |
|
Mar-05 |
1,823 |
95.6 |
14 |
0.7 |
41 |
2.1 |
28 |
1.5 |
83 |
4.4 |
1,906 |
|
Others |
|||||||||||
|
Mar-03 |
293 |
99.4 |
1 |
0.4 |
1 |
0.2 |
– |
– |
2 |
0.6 |
295 |
|
Sep-03 |
1 |
55.0 |
– |
25.9 |
– |
19.0 |
– |
– |
1 |
45.0 |
2 |
|
Mar-04 |
– |
– |
– |
– |
– |
– |
– |
– |
– |
– |
– |
|
Sep-04 |
– |
– |
– |
– |
– |
– |
– |
– |
– |
– |
– |
|
Mar-05 |
– |
– |
– |
– |
– |
– |
– |
– |
– |
– |
– |
|
– : Nil/Negligible. |
|||||||||||
5.72 Composition of NPAs of NBFC groups also showed divergent trends during 2003-04 and 2004-05. Composition of NPAs of equipment leasing companies, after showing improvement during the year ended March 2004, deteriorated in the following year. Composition of NPAs of hire purchase companies, investment companies and loan companies deteriorated during 2003-04, but improved in the following year (Table V.33).
Capital Adequacy Ratio
5.73 Capital to risk-weighted assets ratio (CRAR) norms were made applicable to NBFCs in 1998, in terms of which every deposit-taking NBFC is required to maintain a minimum capital
consisting of Tier-I and Tier-II capital of not less than 12 per cent (15 per cent in the case of unrated deposit-taking loan/investment companies) of its aggregate risk-weighted assets and of risk-adjusted value of off-balance sheet items. Total of Tier-II capital, at any point of time, is required not to exceed 100 per cent of Tier-I capital. The number of NBFCs with CRAR less than 12 per cent, which constituted 6.4 per cent of all NBFCs at end-March 2003, declined to 5.2 per cent at end-March 2004, but increased to 19.8 per cent at end-March 2005. On the other hand, number of NBFCs with more than 20 per cent CRAR increased from 85.3 per cent at end-March 2003 to 89.7 per cent at end-March 2004, but declined sharply to 73.5 per cent at end-March 2005 (Table V.34).
|
Table V.34: Capital Adequacy Ratio of NBFCs * |
||||||||||||
|
Range |
As at end-March |
|||||||||||
|
2003 |
2004 |
2005 |
||||||||||
|
EL |
HP |
LC/IC |
Total |
EL |
HP |
LC/IC |
Total |
EL |
HP |
LC/IC |
Total |
|
|
1 |
2 |
3 |
4 |
5 |
6 |
7 |
8 |
9 |
10 |
11 |
12 |
13 |
|
Less than 12 per cent |
10 |
17 |
15 |
42 |
5 |
12 |
8 |
25 |
4 |
55 |
5 |
64 |
|
More than 12 and up to 15 per cent |
1 |
8 |
1 |
10 |
1 |
4 |
1 |
6 |
– |
– |
1 |
1 |
|
More than 15 and up to 20 per cent |
4 |
32 |
9 |
45 |
2 |
15 |
2 |
19 |
2 |
15 |
4 |
21 |
|
More than 20 and up to 30 per cent |
9 |
54 |
11 |
74 |
6 |
38 |
7 |
51 |
5 |
26 |
1 |
32 |
|
Above 30 per cent |
32 |
334 |
121 |
487 |
28 |
300 |
55 |
383 |
25 |
153 |
28 |
206 |
|
Total |
56 |
445 |
157 |
658 |
42 |
369 |
73 |
484 |
36 |
249 |
39 |
324 |
|
– : Nil/Negligible. * : Excluding MBFCs, MBCs and MNBCs. |
||||||||||||
Net Owned Fund vis-à-vis Public Deposits of NBFCs
5.74 Net owned fund (NOF) of NBFCs is the aggregate of paid-up capital and free reserves, netted by (i) the amount of accumulated balance of loss, (ii) deferred revenue expenditure and other intangible assets, if any, and adjusted by investments in shares and loans and advances to (a) subsidiaries, (b) companies in the same group and (c) other NBFCs (in excess of 10 per cent of owned fund). Information of NOFs can complement the information on CRAR. The ratio of public deposits to NOF in respect of almost all NBFC groups except loan companies, after increasing marginally during the year ended March 2004, declined during the year ended March 2005 (Table V.35).
5.75 Net owned funds of NBFCs range from less than Rs.25 lakh to over Rs.500 crore. The
number of companies in nearly all NOF ranges declined during 2003-04 and 2004-05. NOF of NBFCs, which declined marginally during 2003-04, increased during 2004-05. NBFCs in the NOF range of ‘up to Rs.25 lakh’ continued to have negative NOF. One NBFC had NOF above Rs.500 crore at end-March 2005 as against two at end-March 2004. The ratio of public deposits to NOF maintained by NBFCs declined from 1.2 at end-March 2003 to 1.1 at end-March 2004 and further to 0.8 per cent at end-March 2005. NBFCs in the NOF range of Rs.100 crore to Rs.500 crore held the largest share (29.3 per cent) of public deposits (Table V.36).
Residuary Non-Banking Companies (RNBCs)
5.76 Three RNBCs were operating in the country at end-March 2004 and end-March 2005 as against five at end-March 2003. Assets of RNBCs
|
Table V.35: Net Owned Fund vis-à-vis Public deposits of NBFCs* – Group-wise |
|||||||||
|
(Amount in Rs. crore) |
|||||||||
|
NBFC Group |
Net Owned |
Public Deposits |
Public Deposits to |
||||||
|
Fund |
Net Owned Fund |
||||||||
|
2003 |
2004 |
2005 |
2003 |
2004 |
2005 |
2003 |
2004 |
2005 |
|
|
1 |
2 |
3 |
4 |
5 |
6 |
7 |
8 |
9 |
10 |
|
Equipment Leasing |
154 |
96 |
427 |
511 |
344 |
343 |
3.3 |
3.6 |
0.8 |
|
Hire Purchase |
2,979 |
2,235 |
2,597 |
3,539 |
2,963 |
2,315 |
1.2 |
1.3 |
0.9 |
|
Investment |
553 |
607 |
662 |
125 |
106 |
93 |
0.2 |
0.2 |
0.1 |
|
Loan |
367 |
893 |
428 |
177 |
178 |
157 |
0.5 |
0.2 |
0.4 |
|
Others |
88 |
265 |
331 |
683 |
727 |
738 |
7.8 |
2.7 |
2.2 |
|
Total |
4,141 |
4,096 |
4,445 |
5,035 |
4,317 |
3,646 |
1.2 |
1.1 |
0.8 |
|
* : Including MBFCs, MBCs and MNBCs. |
|||||||||
|
Table V.36: Range of Net Owned Funds vis-à-vis Public Deposits of NBFCs* |
|||||||||||||
|
(Amount in Rs. crore) |
|||||||||||||
|
Range of |
As at end-March |
||||||||||||
|
NOF |
|||||||||||||
|
2003 |
2004 |
2005 |
|||||||||||
|
No. of |
Net |
Public |
Public |
No. of |
Net |
Public |
Public |
No. of |
Net |
Public |
Public |
||
|
reporting |
Owned |
Deposits |
Deposits |
reporting |
Owned |
Deposits |
Deposits |
reporting |
Owned |
Deposits |
Deposits |
||
|
companies |
Funds |
as |
companies |
Funds |
as |
companies |
Funds |
as |
|||||
|
multiple |
multiple |
multiple |
|||||||||||
|
of NOFs |
of NOFs |
of NOFs |
|||||||||||
|
1 |
2 |
3 |
4 |
5 |
6 |
7 |
8 |
9 |
10 |
11 |
12 |
13 |
|
|
1. |
Up to 0.25 |
208 |
-1,356 |
843 |
– |
175 |
-881 |
667 |
– |
93 |
-591 |
456 |
– |
|
2. |
More than 0.25 |
||||||||||||
|
and up to 2 |
497 |
309 |
369 |
1.2 |
451 |
289 |
430 |
1.5 |
332 |
228 |
372 |
1.6 |
|
|
3. |
More than 2 |
||||||||||||
|
and up to 10 |
110 |
461 |
467 |
1 |
92 |
394 |
384 |
1 |
97 |
428 |
392 |
0.9 |
|
|
4. |
More than 10 |
||||||||||||
|
and up to 50 |
30 |
677 |
447 |
0.7 |
35 |
683 |
577 |
0.8 |
29 |
661 |
470 |
0.7 |
|
|
5. |
More than 50 |
||||||||||||
|
and up to 100 |
10 |
639 |
255 |
0.4 |
7 |
478 |
204 |
0.4 |
6 |
456 |
158 |
0.3 |
|
|
6. |
More than 100 |
||||||||||||
|
and up to 500 |
15 |
3,411 |
2,654 |
0.8 |
12 |
2,039 |
1,342 |
0.7 |
12 |
2,595 |
1,067 |
0.4 |
|
|
7. |
Above 500 |
– |
– |
– |
– |
2 |
1,094 |
713 |
0.7 |
1 |
669 |
731 |
1.1 |
|
Total |
870 |
4,141 |
5,035 |
1.2 |
774 |
4,096 |
4,317 |
1.1 |
570 |
4,446 |
3,646 |
0.8 |
|
|
– : Nil/Negligible. |
|||||||||||||
declined by 3.5 per cent during the year ended March 2004 and 6.4 per cent during the year ended March 2005. Fixed deposits with banks, bonds/debentures and other fixed income investments, however, increased sharply during 2004-05. Net owned funds of RNBCs increased during 2003-04 and 2004-05.
5.77 Financial performance of RNBCs was lacklustre during 2003-04 and 2004-05. Despite increase in income, their operating profit and net profit declined during 2003-04 due mainly to increase in expenditure. A sharp decline in income of RNBCs during 2004-05 resulted in a further decline in their net profit (Table V.37).
|
Table V.37: Profile of Residuary Non-Banking Companies (RNBCs) |
|||||||
|
(Amount in Rs. crore) |
|||||||
|
Item |
As at end-March |
Percentage Variation |
|||||
|
2003 |
2004 |
2005 |
2003-04 |
2004-05 |
|||
|
1 |
2 |
3 |
4 |
5 |
6 |
||
|
A. |
Assets (i to v) |
21,104 |
20,362 |
19,057 |
-3.5 |
-6.4 |
|
|
(i) |
Unencumbered approved securities |
6,129 |
5,824 |
2,037 |
-5.0 |
-65.0 |
|
|
(ii) |
Fixed deposits with banks |
1,470 |
2,033 |
4,859 |
38.3 |
139.0 |
|
|
(iii) |
Bonds or debentures or commercial papers of Govt. companies/ |
6,553 |
6,048 |
9,225 |
-7.7 |
52.5 |
|
|
public sector banks/ public financial institutions/ corporations |
|||||||
|
(iv) |
Other investments |
912 |
2,059 |
1,639 |
125.8 |
-20.4 |
|
|
(v) |
Other Assets |
6,040 |
4,398 |
1,297 |
-27.2 |
-70.5 |
|
|
B. |
Net Owned Funds |
809 |
1,002 |
1,065 |
23.9 |
6.3 |
|
|
C. |
Total Income (i+ii) |
1,801 |
2,055 |
1,532 |
14.1 |
-25.5 |
|
|
(i) |
Fund Income |
1,801 |
2,055 |
1,530 |
14.1 |
-25.5 |
|
|
(ii) |
Fee Income |
– |
– |
2 |
– |
– |
|
|
D. |
Total Expenses (i+ii+iii) |
1,435 |
1,813 |
1,396 |
26.3 |
-23.0 |
|
|
(i) |
Financial Cost |
1,212 |
1,368 |
1,196 |
12.9 |
-12.6 |
|
|
(ii) |
Operating Cost |
105 |
129 |
146 |
22.9 |
13.2 |
|
|
(iii) |
Other cost |
118 |
316 |
74 |
167.8 |
-76.6 |
|
|
E. |
Taxation |
134 |
32 |
48 |
-76.1 |
50.0 |
|
|
F. |
Operating Profit (PBT) |
366 |
242 |
136 |
-33.9 |
-43.8 |
|
|
G. |
Net profit (PAT) |
232 |
210 |
88 |
-9.5 |
-58.1 |
|
|
– : Nil/Negligible. |
|||||||
Regional Pattern of Deposits of RNBCs
5.78 Of the three RNBCs, two are based in the Eastern region and one in the Central region. While deposits held by RNBCs in the Eastern region declined during the year ended March 2004 and March 2005, those held by RNBCs in the Central region increased in both the years. The RNBCs together held a sizeable portion (82.0 per cent) of total deposits held by all NBFCs at end-March 2005 (Table V.38).
Investment Pattern of RNBCs
5.79 Directions for investments by RNBCs were rationalised in June 2004 with a view to reducing the overall systemic risk in the financial sector and safeguarding the interests of depositors. In this regard, the following road map was prescribed: (a) from the quarter ended June 2005 and onwards, RNBCs were permitted to invest only to the extent of 10 per cent of the aggregated liabilities to the depositors (ALDs) at the second preceding quarter or one time of their net owned fund, whichever is lower, in the manner which in the opinion of the company is safe as per the
approval of its Board of Directors; (b) from the quarter ended June 2006 and onwards, this limit would stand abolished and RNBCs would not be permitted to invest any amount out of the ALDs at the second preceding quarter as per their discretion. Thus, from the quarter ended June 2006 and onwards, RNBCs would be required to invest the entire amount of ALDs at the second preceding quarter in the directed investments.
5.80 Further, the requirement of AA+ rating and listing on the stock exchanges was introduced for bonds/debentures which qualify towards directed investments. These measures are expected to impart greater liquidity and safety to the investments of RNBCs and thus enhance protection available to depositors.
5.81 Aggregated liabilities to depositors (ALDs) increased during the year ended March 2004 and March 2005. Investments in unencumbered approved securities declined sharply, while fixed deposits with banks as also investments in bonds/ debentures increased. As a result, unencumbered approved securities as a percentage of ALDs declined significantly at end-March 2005 from end-March 2003 (Table V.39).
|
Table V.38: Public Deposits held by Registered and Unregistered RNBCs - Region-wise |
||||||
|
(Amount in Rs. crore) |
||||||
|
Region |
2003 |
2004 |
2005 |
|||
|
No. |
Amount |
No. |
Amount |
No. |
Amount |
|
|
1 |
2 |
3 |
4 |
5 |
4 |
5 |
|
Northern |
– |
– |
– |
– |
– |
– |
|
North-Eastern |
– |
– |
– |
– |
– |
– |
|
Eastern |
3 |
7,422 |
2 |
6,523 |
2 |
5,070 |
|
(49.3) |
(42.6) |
(30.5) |
||||
|
Central |
1 |
7,640 |
1 |
8,804 |
1 |
11,530 |
|
(50.7) |
(57.4) |
(69.5) |
||||
|
Western |
– |
– |
– |
– |
– |
– |
|
Southern |
1 |
3 |
– |
– |
– |
– |
|
(0.0) |
||||||
|
Total |
5 |
15,065 |
3 |
15,327 |
3 |
16,600 |
|
Metropolitan cities |
||||||
|
Mumbai |
– |
– |
– |
– |
– |
– |
|
Chennai |
– |
– |
– |
– |
– |
– |
|
Kolkata |
3 |
7,422 |
2 |
6,523 |
2 |
5,070 |
|
New Delhi |
– |
– |
– |
– |
– |
– |
|
Total |
3 |
7,422 |
2 |
6,523 |
2 |
5,070 |
|
– Nil/Negligible. |
||||||
|
Table V.39: Investment Pattern of Residuary Non-Banking Companies |
|||||||
|
(Amount in Rs. crore) |
|||||||
|
Item |
End-March |
Per cent to ALDs |
|||||
|
2003 |
2004 |
2005 |
2003 |
2004 |
2005 |
||
|
1 |
2 |
3 |
4 |
5 |
6 |
7 |
|
|
Aggregated Liabilities to the Depositors (ALDs): |
15,065 |
15,327 |
16,600 |
100 |
100 |
100 |
|
|
a) |
Unencumbered approved securities |
6,129 |
3,702 |
2,036 |
40.7 |
24.2 |
12.3 |
|
b) |
Fixed deposits with banks |
1,470 |
2,431 |
4,859 |
9.8 |
15.9 |
29.3 |
|
c) |
Bonds or debentures or commercial papers of |
||||||
|
Government companies/ public sector banks/ public |
|||||||
|
financial institutions/ corporations |
6,553 |
8,319 |
9,225 |
43.5 |
54.3 |
55.6 |
|
|
d) |
Other investments |
913 |
2,059 |
1,639 |
6.1 |
13.4 |
9.9 |
NBFCs not Accepting Public Deposits and With Assets Size of Rs.500 crore and Above
5.82 In terms of Section 45IA of the RBI Act, 1934 as amended on January 8, 1997, the companies carrying on NBFI activities are required to obtain a Certificate of Registration (CoR) from the Reserve Bank. Further, companies accepting public deposits are required to submit regulatory returns such as Annual Return on public deposits (NBS-1), Half-yearly Return on Prudential Norms (NBS-2) and Quarterly Return on Statutory Liquidity Ratio (NBS-3) as per the NBFC Directions issued on January 31, 1998.
5.83 The Reserve Bank issued CoR to 13,261 NBFCs as on June 30, 2005, out of which only 507 NBFCs are accepting public deposits and submitting the regulatory returns prescribed under the Directions. In order to assess the operations of large non-deposit taking companies, a quarterly return was introduced with effect from September 2004.
To begin with, NBFCs with asset size of Rs.500 crore and above were advised to submit quarterly return covering information on their sources and applications of funds as also on their exposures to the capital market, NPAs and profitability.
5.84 Information based on the returns received from nearly 50 NBFCs with asset size of Rs.500 crore and above for the quarters ended March and June 2005 suggests a marginal increase in their assets/liabilities. Unsecured loans constituted the single largest source of funds for NBFCs, followed by secured loans (Table V.40).
Borrowings
5.85 Borrowings constitute the single most important source of funds (74.2 per cent) for large sized NBFCs. Total borrowing (secured and unsecured) by NBFCs for the quarter ended March and June 2005 were placed at Rs.1,26,823 crore
|
Table V.40: Liabilities of Large Sized NBFCs* |
|||||
|
(Amount in Rs. crore) |
|||||
|
Item |
Quarter Ended |
||||
|
March 2005 |
June 2005 |
||||
|
Amount |
Per cent to |
Amount |
Per cent to |
||
|
total Assets |
total Assets |
||||
|
1 |
2 |
3 |
4 |
5 |
|
|
Total Liabilities |
1,70,957 |
100.0 |
1,79,311 |
100.0 |
|
|
of which : |
|||||
|
a) |
Paid up Capital |
11,233 |
6.6 |
11,294 |
6.3 |
|
b) |
Preference Shares |
689 |
0.4 |
689 |
0.4 |
|
c) |
Reserve & Surplus |
22,827 |
13.4 |
22,976 |
12.8 |
|
d) |
Secured Loans |
52,774 |
30.9 |
56,233 |
31.4 |
|
e) |
Unsecured Loans |
74,049 |
43.3 |
76,758 |
42.8 |
|
* : NBFCs not accepting public deposits with |
|||||
|
Table V.41: Borrowings by Large Sized NBFCs* |
|||||||
|
(Amount in Rs. crore) |
|||||||
|
Item |
Quarter Ended |
||||||
|
March 2005 |
June 2005 |
||||||
|
Amount |
Per cent to |
Amount |
Per cent to |
||||
|
total Borrowings |
total Borrowings |
||||||
|
1 |
2 |
3 |
4 |
5 |
|||
|
A) |
Secured Borrowings (i to vi) |
52,774 |
41.6 |
56,233 |
42.3 |
||
|
i) |
Debentures |
30,777 |
24.3 |
31,914 |
24.0 |
||
|
ii) |
Deferred Credit |
– |
– |
– |
– |
||
|
iii) |
Term Loans from Banks |
11,043 |
8.7 |
11,893 |
8.9 |
||
|
iv) |
Term Loans from FIs |
4,411 |
3.5 |
6,574 |
4.9 |
||
|
v) |
Others |
5,433 |
4.3 |
5,169 |
3.9 |
||
|
vi) |
Interest accrued |
1,110 |
0.8 |
683 |
0.6 |
||
|
B) |
Unsecured Borrowings (i to viii) |
74,049 |
58.4 |
76,758 |
57.7 |
||
|
i) |
Loans from |
Relatives |
1,310 |
1.0 |
1,221 |
0.9 |
|
|
ii) |
ICDs |
7,993 |
6.3 |
7,866 |
5.9 |
||
|
iii) |
Loans from Banks |
19,717 |
15.5 |
21,661 |
16.3 |
||
|
iv) |
Loans from FIs |
2,326 |
1.8 |
2,723 |
2.0 |
||
|
v) |
Commercial Papers |
12,487 |
9.8 |
13,382 |
10.1 |
||
|
vi) |
Debentures |
13,769 |
10.9 |
14,256 |
10.7 |
||
|
vii) |
Others |
15,419 |
12.3 |
14,512 |
10.9 |
||
|
viii) |
Loans Interest accrued |
1,028 |
0.8 |
1,137 |
0.9 |
||
|
Total Borrowings |
1,26,823 |
100.0 |
1,32,991 |
100.0 |
|||
|
– : Nil/Negligible. |
|||||||
and Rs.1,32,991 crore, respectively. Secured borrowings by way of debentures and term loans from banks/FIs increased significantly during the quarter ended June 2005. Unsecured borrowings in the form of loans from banks, debentures and commercial papers also increased during the quarter. Increased borrowings enabled large NBFCs to expand their operations on the asset side (Table V.41).
Application of Funds
5.86 Loans (both secured and unsecured) by NBFCs, which is the single largest item on the asset side, increased by 4.6 per cent during the quarter ended June 2005. A sharp increase (23.7 per cent) was also noticed in their current investment. Long-term investments and hire purchase financing declined marginally. Capital market exposure of large NBFCs also declined marginally (Table V.42).
|
Table V.42: Select Indicators on Application of Funds by Large Sized NBFCs* |
||||||
|
(Amount in Rs. crore) |
||||||
|
Item |
Quarter Ended |
|||||
|
March 2005 |
June 2005 |
|||||
|
Amount |
Per cent to |
total |
Amount |
Per cent to total |
||
|
application of funds |
application of funds |
|||||
|
1 |
2 |
3 |
4 |
5 |
||
|
1. |
Secured Loan |
42,552 |
28.4 |
44,502 |
28.5 |
|
|
2. |
Unsecured Loan |
60,855 |
40.6 |
63,669 |
40.7 |
|
|
3. |
Hire Purchase |
20,763 |
13.9 |
19,982 |
12.8 |
|
|
4. |
Long-term Investment |
14,847 |
9.9 |
14,689 |
9.4 |
|
|
5. |
Current Investment |
10,883 |
7.2 |
13,466 |
8.6 |
|
|
Total |
1,49,900 |
100.0 |
1,56,308 |
100.0 |
||
|
Memo Item: |
||||||
|
Capital Market Exposure |
17,874 |
11.9 |
17,132 |
11.0 |
||
|
of which: |
in Equity |
12,242 |
8.2 |
11,817 |
7.6 |
|
|
* : NBFCs not accepting public deposits with asset size of Rs.500 crore and above. |
||||||
|
Table V.43: Financial Performance of |
||||
|
(Amount in Rs. crore) |
||||
|
Item |
Quarter Ended |
|||
|
March 2005 |
June 2005 |
|||
|
Amount |
Per cent |
Amount |
Per cent |
|
|
to total |
to total |
|||
|
Assets |
Assets |
|||
|
1 |
2 |
3 |
4 |
5 |
|
Total Income |
12,954 |
7.6 |
4,225 |
2.4 |
|
Total Expenses |
9,612 |
5.6 |
2,753 |
1.5 |
|
Net Profit |
2,255 |
1.3 |
1,059 |
0.6 |
|
Total Assets |
1,70,957 |
100.0 |
1,79,311 |
100.0 |
|
* : NBFCs not accepting public deposits with |
||||
Financial Performance
5.87 Total income and expenditure of large NBFCs worked out to 7.6 per cent and 5.6 per cent of total assets, respectively, for the year ended March 2005. Net profit to asset ratio was 1.3 per cent during the year ended March 2005. Large NBFCs earned a sizeable profit of Rs.1,059 crore during the quarter ended June 2005, which was little less than 50 per cent of the total profit earned during the year ended March 2005 (Table V.43).
Asset Quality
5.88 While gross NPAs/total assets ratio remained unchanged, gross NPAs/credit exposure ratio increased significantly during the quarter ended June 2005. Net NPAs relative to both total assets and credit exposure declined during the quarter ended June 2005 (Table V.44).
|
Table V.44: Gross and Net NPAs of |
||||
|
(Per cent) |
||||
|
Item |
End- |
End- |
||
|
March |
June |
|||
|
2005 |
2005 |
|||
|
1 |
2 |
3 |
||
|
1. |
Gross NPAs to Total Assets |
2.3 |
2.3 |
|
|
2. |
Gross NPAs to Total Credit Exposure |
6.3 |
7.9 |
|
|
3. |
Net NPAs to Total Assets |
1.2 |
1.1 |
|
|
4. |
Net NPAs to Total Credit Exposure |
3.4 |
2.5 |
|
|
* :NBFCs not accepting public deposits with asset size of |
||||
4. PRIMARY DEALERS
5.89 The primary dealer (PD) system, created in 1996 continues to be important from the perspective of successful completion of the Government borrowing programme, the size of which is substantial, and the need to further develop the debt markets in India. PDs (at present 17 in number) deal largely in Government securities and other interest rate products and support the borrowing programme of the Central and the State Governments. A number of measures were initiated during 2004-05 to further strengthen the role of PDs in the Government securities market.
Policy Developments
5.90 Prudential guidelines were issued to PDs in June 2004 on dividend distribution policy with focus on pay-out ratio and capital adequacy ratio. Dividend pay-out ratio for PDs, having capital to risk-weighted assets ratio (CRAR) at 20.0 per cent or above in all the four quarters of the previous year, was capped at 50.0 per cent and at 33.3 per cent for PDs not fulfilling the above conditions. A primary dealer cannot declare dividend if the CRAR in any of the four quarters is below the minimum prescribed CRAR of 15 per cent.
5.91 PDs were advised to hold all their equity investments only in dematerialised form by the end of December 2004 and make all fresh investments only in dematerialised form thereafter.
5.92 Guidelines allowing PDs to issue subordinated debt instruments for Tier-II capital and Tier-III capital were issued in October 2004. The guidelines provided for the amount of subordinated debt to be decided by the Board of Directors, ceiling on interest rate spread, restrictions on the type of instrument, mandatory credit rating, compliance with SEBI guidelines, obtaining permission from the Reserve Bank for issuing instruments to NRIs/FIIs, assignment of 100 per cent risk weight for investments in other PDs/ banks and disclosure requirements.
5.93 Since the Reserve Bank would no longer play the role of an underwriter of the last resort from 2006-07, PDs would need to be adequately prepared to ensure success of the market borrowing programme.
5.94 An Internal Technical Group in the Reserve Bank, which examined primary issuance process under the FRBM period, recommended that PDs
must underwrite the entire issuance amount of each auction. Given this significantly higher responsibility for PDs, the Group proposed adoption of risk mitigating measures such as short-selling, introduction of ‘when-issued’ market and exclusivity in primary auctions. In consonance with the proposed incentives, the Group recommended certain market-making obligations for PDs, particularly in the mid-segment. Earlier, another Group (Chairman: Dr. R.H. Patil) had examined the role of PDs in the Government securities market. Both the Reports were discussed in the Technical Advisory Committee (TAC) and certain recommendations were accepted by the Reserve Bank for implementation. Accordingly, several measures were proposed in the Annual Policy Statement for 2005-06. These included: (i) permitted structures of PD business to be expanded to include banks which fulfill certain minimum criteria subject to safeguards and in consultation with banks, PDs
and the Government; (ii) to consider the recommendations of the Technical Group on restructuring the underwriting obligations of PDs, allowing exclusivity to PDs in primary auctions, introduction of ‘when issued’ market and limited short-selling in Government securities in consultation with the Government.
5.95 The operationalisation of these proposed measures is being examined by the TAC and the Reserve Bank/Government of India. The role of PDs in the Government securities market in the post-implementation of FRBM Act, 2003 is envisaged to be more important not only from the debt management perspective, but also from the viewpoint of market development (Box V.2). The risk mitigation tools that are being contemplated by the Reserve Bank and the proposal to expand permitted structures of PD business to include banks might require changes in the regulatory guidelines.
Box V.2: Role of Primary Dealers (PDs) under the FRBM Environment
The primary dealer system, with its current underwriting and bidding commitments, ensured to a great extent the smooth execution of Government borrowing programmes. However, there have been a few instances when some auctions of Government securities remained undersubscribed and devolved on the Reserve Bank. The Reserve Bank’s participation in the primary auction process so far, albeit at the margin, has ensured that (i) the Government borrows as and when it requires funds; and (ii) irrational bidding behavior is avoided.
Under the FRBM Act, 2003, the Reserve Bank with effect from April 1, 2006, will not be allowed to participate in primary auctions. As such the current institutional mechanism requires a relook to ensure that debt management objectives are met and the Government is able to borrow under all market conditions without exacerbating market volatility.
The Internal Technical Group on Central Government Securities Market, which deliberated on various issues concerning Government securities market, suggested that the Reserve Bank’s role in the primary market be replaced by a more active and dynamic participation by PDs. This has necessitated some restructuring of current institutional processes.
Since the current system of annual bidding commitments does not guarantee the success of notified amount being sold at each auction, the Group felt that a system of bidding commitments for each auction is preferable, whereby all PDs put together must commit to bid 100 per cent of each auction, ensuring that the notified amount is sold at each auction. However, since 100 per cent bidding commitments by PDs per se do not ensure that the cost of issuance is minimised or is in line with price discovery, the Group felt that instead of bidding commitments, PDs could be required to underwrite the entire notified amount of an auction. The
methodology for such arrangement was also broadly suggested by the Group.
Recognising that the envisaged system casts a much larger responsibility on the PDs than under the current arrangements, it was suggested by the Group to compensate PDs with appropriate incentives over and above those already available such as access to the call market, cash and securities account with the Reserve Bank, refinance facility and access to the Liquidity Adjustment Facility (LAF). The Group also suggested that the possibility of providing PDs with a facility to repo their auctioned stock with the Reserve Bank for a limited period after the auction allotment, be examined to help them tide over temporary funding risk.
The Group suggested that the participation in the PD system be expanded to include banks to undertake PD activity departmentally. In almost all countries, the concept of primary dealers is limited to an activity and not an entity. That is, institutions such as commercial banks and investment banks, financial institutions and broker-dealers are designated as primary dealers, and no separate entity is required to be formed for this purpose. The Group, therefore, recommended that in addition to current eligibility norms, permitted structures for PD business be expanded to include banks directly undertaking PD activity as a department with independent subsidiary books of account. The operations of the bank may be kept scrupulously distinct from the PD activities. The Group, therefore, recommended that appropriate restructuring of the PD system be encouraged, with smaller PDs either raising the capital base or merging with parent banks, where there are bank subsidiaries.
The Group further suggested that the primary dealers be granted exclusivity in primary auctions and such exclusivity be granted in phases commencing with Treasury Bills and a few auctions of dated securities.
Operations and Performance of the PDs
5.96 PDs continued to be important players in the Government securities market during 2004-05. The liquidity support limits for PDs for 2004-05 were fixed at Rs.3,000 crore as against Rs.4,500 crore for the previous year. The liquidity support was made available at the Reserve Bank’s Repo Rate.
5.97 Bidding commitments in Treasury Bill auctions for all PDs taken together for 2004-05 were fixed at 123 per cent of the issue amount. Total bids received at Rs.1,10,112 crore amounted to 205.8 per cent of the total Treasury Bill issues of Rs.53,500 crore and 74.1 per cent of the total Treasury Bill issues of Rs.1,48,500 crore (inclusive of Market Stabilisation Scheme). For dated securities auctions, the bidding commitments for all PDs taken together were originally fixed at Rs.1,20,300 crore. Subsequently, the bidding commitments were reduced to Rs.77,900 crore on account of reduction in the market-borrowing programme of the Government. The actual bids tendered by the PDs were for Rs.85,474 crore. PDs offered to underwrite the primary issues to the tune of Rs.58,335 crore during the year, out of which bids for Rs.34,720 crore were accepted by the Reserve Bank. The shares of total primary purchases by PDs for Treasury Bills and dated securities at 63 per cent and 47 per cent, respectively, during the year were marginally lower than those of 67 per cent and 50 per cent, respectively, in the preceding year.
5.98 The turnover of transactions by PDs (both outright and repo) in the secondary market for Treasury Bills and Government dated securities at Rs.4,66,242 crore and Rs.12,69,454 crore, respectively, constituted 28.0 per cent and 18.6 per cent, respectively, of the total market turnover of Rs.16,66,020 crore and Rs.68,23,054 crore, respectively.
Sources and Application of Funds
5.99 The investments by PDs in Government securities and corporate bonds declined sharply. Among sources of funds unsecured loans declined sharply (Table V.45).
5.100 The share of Government securities in total assets of PDs declined sharply from 82.3 per cent at end-March 2004 to 69.3 per cent at end-March 2005. Capital funds of the PDs declined to
|
Table V.45: Sources and Application of Funds of |
|||||
|
(Amount in Rs. crore) |
|||||
|
Item |
2003- |
2004- |
Percentage |
||
|
04 |
05# |
Variation |
|||
|
2003-04 |
2004-05 |
||||
|
1 |
2 |
3 |
4 |
5 |
|
|
Sources of Funds |
17,135 |
11,911 |
2.2 |
-30.5 |
|
|
1. |
Capital |
2,354 |
2,332 |
17.5 |
-0.9 |
|
2. |
Reserves and Surplus |
3,675 |
3,334 |
32.3 |
-9.3 |
|
3. |
Loans (a+b) |
11,106 |
6,245 |
-7.4 |
-43.8 |
|
a) Secured |
1,654 |
2,445 |
-70.2 |
47.8 |
|
|
b) Unsecured |
9,452 |
3,800 |
47.0 |
-59.8 |
|
|
Application of Funds |
17,135 |
11,911 |
2.2 |
-30.5 |
|
|
1. |
Fixed Assets |
71 |
75 |
6.0 |
5.6 |
|
2. |
Investments (a to d) |
16,436 |
10,224 |
3.6 |
-37.8 |
|
a) Government Securities |
14,094 |
8,255 |
-2.2 |
-41.4 |
|
|
b) Commercial papers |
123 |
443 |
16.0 |
260.2 |
|
|
c) Corporate Bonds |
2,055 |
1,176 |
75.9 |
-42.8 |
|
|
d) Others |
164 |
350 |
– |
113.4 |
|
|
3. |
Loans and Advances |
2,567 |
2,322 |
41.8 |
-9.5 |
|
4. |
Non Current Assets |
– |
– |
– |
– |
|
5. |
Others* |
-1,939 |
-710 |
100.8 |
-63.4 |
|
– : Nil/Negligible. |
|||||
Rs.5,603 crore at end-March 2005 from Rs.6,015 crore at end-March 2004 (Table V.46). Despite this decline, however, PDs were able to maintain capital to risk weighted assets ratios far in excess of the minimum requirement of 15 per cent (Table V.46 and Appendix Table V.7).
|
Table V.46: Select Indicators of |
|||
|
(Amount in Rs. crore) |
|||
|
Item |
End-March |
||
|
2004 |
2005 # |
||
|
1 |
2 |
3 |
|
|
Total Assets* |
17,135 |
11,911 |
|
|
Of which: |
Government securities |
14,094 |
8,255 |
|
Government securities as |
|||
|
percentage of total assets |
82.3 |
69.3 |
|
|
Total Capital Funds |
6,015 |
5,603 |
|
|
CRAR |
42.7 |
54.3 |
|
|
Liquidity Support Limit |
2,250 |
3,000 |
|
|
(normal) |
(normal) |
||
|
2,250 |
|||
|
(backstop) |
|||
|
*: Net of current liabilities and provisions. |
|||
|
Table V.47: Financial Performance of |
|||||
|
(Amount in Rs. crore) |
|||||
|
Item |
2003- |
2004- |
Percentage |
||
|
04 |
05# |
Variation |
|||
|
2003-04 |
2004-05 |
||||
|
1 |
2 |
3 |
4 |
5 |
|
|
A. Income (i to iv) |
2,845 |
574 |
5.4 |
-79.8 |
|
|
i) |
Interest |
1,132 |
778 |
1.8 |
-31.3 |
|
ii) |
Discount |
174 |
44 |
-4.4 |
-74.7 |
|
iii) |
Trading Profit |
1,131 |
-700 |
-1.4 |
-161.9 |
|
iv) |
Others |
408 |
452 |
57.5 |
10.8 |
|
B. Expenses (i+ii) |
977 |
769 |
-2.6 |
-21.3 |
|
|
i) |
Interest |
655 |
459 |
-9.3 |
-29.9 |
|
ii) |
Administrative Costs |
322 |
310 |
14.6 |
-3.7 |
|
C. Profit Before Tax |
1,868 |
-195 |
10.1 |
-110.4 |
|
|
D. Net Profit |
1,229 |
-250 |
14.8 |
-120.3 |
|
|
# : Unaudited. |
|||||
Financial Performance of PDs
5.101 Net interest income of PDs declined during 2004-05. This combined with trading losses incurred during the year due to hardening of
|
Table V.48: Financial Indicators of |
||||||
|
(Amount in Rs. crore) |
||||||
|
Indicator |
2003-04 |
2004-05 |
||||
|
1 |
2 |
3 |
||||
|
i) |
Net Profit |
1,229 |
-250 |
|||
|
ii) |
Average Assets |
18,860 |
15,228 |
|||
|
iii) |
Return on Average Assets (per cent) |
6.5 |
-1.6 |
|||
|
iv) |
Net Worth |
5,998 |
5,592 |
|||
|
Note:1. Average net worth is the average of |
||||||
interest rates resulted in net losses before and after taxes (Table V.47). Ten PDs out of 17 posted net profits during the year (Appendix Table V.8).
5.102 The return on average assets of PDs was negative during the year, reflecting the impact of net losses. The losses suffered by PDs eroded their net worth which declined to Rs.5,592 crore at end-March 2005 from 5,998 crore in the previous year (Table V.48).
|
Table V.19: Range of Deposits held by Non-Banking Financial Companies |
|||||||
|
(Amount in Rs. crore) |
|||||||
|
Deposit range |
As at end-March |
||||||
|
No. of NBFCs |
Amount of deposits |
||||||
|
2003 |
2004 |
2005 |
2003 |
2004 |
2005 |
||
|
1 |
2 |
3 |
4 |
5 |
6 |
7 |
|
|
1. |
Less than Rs.0.5 crore |
491 |
428 |
287 |
65 |
53 |
37 |
|
(1.3) |
(1.2) |
(1.0) |
|||||
|
2. |
More than Rs.0.5 crore and up to Rs.2 crore |
233 |
210 |
168 |
225 |
206 |
164 |
|
(4.5) |
(4.8) |
(4.5) |
|||||
|
3. |
More than Rs.2 crore and up to Rs.10 crore |
90 |
82 |
70 |
360 |
352 |
320 |
|
(7.1) |
(8.2) |
(8.8) |
|||||
|
4. |
More than Rs.10 crore and up to Rs.20 crore |
21 |
18 |
16 |
284 |
242 |
250 |
|
(5.6) |
(5.6) |
(6.9) |
|||||
|
5. |
More than Rs.20 crore and up to Rs.50 crore |
12 |
17 |
14 |
364 |
569 |
507 |
|
(7.2) |
(13.2) |
(13.9) |
|||||
|
6. |
Rs.50 crore and above |
23 |
19 |
15 |
3,737 |
2,895 |
2,368 |
|
(74.3) |
(67.0) |
(64.9) |
|||||
|
Total |
870 |
774 |
570 |
5,035 |
4,317 |
3,646 |
|
|
(100.0) |
(100.0) |
(100.0) |
|||||
|
Note: Figures in parentheses are percentages to total deposit. |
|||||||
‘more than Rs.20 crore and up to Rs.50 crore’, which increased sharply during 2003-04. Fifteen companies in the deposit size of ‘Rs.50 crore and above’ held 64.9 per cent of total public deposits held by all NBFCs at end-March 2005. Twenty nine NBFCs with deposit size of ‘Rs.20 crore and above’, held more than 78.8 per cent of total deposits, while remaining 541 companies held little more than 21.2 per cent of total public deposits (Table V.19).
Region-wise Composition of Deposits held by NBFCs
5.58 Deposits held by NBFCs across all the regions declined during 2003-04 and 2004-05. The Southern region accounted for the largest share of deposits (75.9 per cent) held by NBFCs at end March 2005, followed distantly by other regions This was on account of largest share of deposits (71.1 per cent) held by Chennai (Table V.20).
|
Table V.20: Public Deposits held by Registered and Unregistered NBFCs - Region-wise |
||||||
|
(Amount in Rs. crore) |
||||||
|
Region |
2002-03 |
2003-04 |
2004-05 |
|||
|
No. of NBFCs |
Amount |
No. of NBFCs |
Amount |
No. of NBFCs |
Amount |
|
|
1 |
2 |
3 |
4 |
5 |
6 |
7 |
|
Northern |
271 |
543 |
248 |
442 |
195 |
351 |
|
(10.8) |
(10.2) |
(9.6) |
||||
|
North-Eastern |
1 |
2 |
1 |
1 |
– |
– |
|
(0.0) |
(0.0) |
|||||
|
Eastern |
18 |
212 |
17 |
204 |
13 |
158 |
|
(4.2) |
(4.7) |
(4.3) |
||||
|
Central |
82 |
112 |
75 |
101 |
66 |
92 |
|
(2.2) |
(2.3) |
(2.5) |
||||
|
Western |
63 |
687 |
41 |
365 |
27 |
280 |
|
(13.6) |
(8.5) |
(7.7) |
||||
|
Southern |
435 |
3,479 |
392 |
3,205 |
269 |
2,765 |
|
(69.1) |
(74.2) |
(75.9) |
||||
|
Total |
870 |
5,035 |
774 |
4,318 |
570 |
3,646 |
|
Metropolitan cities: |
||||||
|
Mumbai |
45 |
672 |
23 |
351 |
14 |
268 |
|
Chennai |
318 |
3,162 |
304 |
2,879 |
217 |
2,591 |
|
Kolkata |
15 |
203 |
14 |
187 |
11 |
158 |
|
New Delhi |
108 |
443 |
98 |
345 |
71 |
266 |
|
Total |
486 |
4,480 |
439 |
3,762 |
313 |
3,283 |
|
– : Nil/Negligible. |
||||||
Interest Rate and Maturity Pattern of Public Deposits with NBFCs
5.59 Deposits contracted by NBFCs at interest rates up to 10 per cent increased sharply during the year ended March 2004 as well as March 2005, while deposits contracted at all other interest rates declined significantly. However, some portion of the deposits accepted by NBFCs was at interest rate of above 14 per cent or even 16 per cent. About 71 per cent of the deposits contracted at end-March 2005 were at interest rate up to 10 per cent (Table V.21).
5.60 In line with the general decline in the interest rate over the years, interest rates paid by NBFCs on deposits have also declined steadily over the years, which was reflected in the increase in the share of deposits contracted at interest rate of up to 10 per cent and decline in the share of deposits accepted at 12 to 14 per cent (Chart V.3).
The Maturity Pattern of Public Deposits
5.61 Deposits contracted by NBFCs in all maturity ranges declined significantly during 2003-04 and 2004-05. Deposits in the maturity range of ‘more than 2 and up to 3 years’ accounted for the largest share (35.5 per cent) at end-March 2005 (Table V.22).
5.62 The spread between the maximum interest rate on public sector bank deposits of ‘one to three
|
Table V.21: Distribution of Public Deposits of |
|||
|
(Amount in Rs. crore) |
|||
|
Interest Range |
As at end-March |
||
|
2003 |
2004 |
2005 |
|
|
1 |
2 |
3 |
4 |
|
Up to 10 per cent |
1,174 |
1,896 |
2,604 |
|
(23.3) |
(43.9) |
(71.4) |
|
|
More than 10 per cent |
|||
|
and up to 12 per cent |
2,101 |
1,586 |
726 |
|
(41.7) |
(36.7) |
(19.9) |
|
|
More than 12 per cent |
|||
|
and up to 14 per cent |
1,137 |
505 |
164 |
|
(22.6) |
(11.7) |
(4.5) |
|
|
More than 14 per cent |
|||
|
and up to 16 per cent |
475 |
254 |
109 |
|
(9.4) |
(5.9) |
(3.0) |
|
|
16 per cent and above |
148 |
76 |
43 |
|
(3.0) |
(1.8) |
(1.2) |
|
|
Total |
5,035 |
4,317 |
3,646 |
|
(100.0) |
(100.0) |
(100.0) |
|
|
Note: Figures in parentheses are |
|||
year’ maturity and the interest rate offered by NBFCs on deposits with the same maturity narrowed down over the years (Table V.23).
Borrowings
5.63 The outstanding borrowings by NBFCs, which declined by 14.8 per cent during the year ended March 2004 on account of decline in the borrowings by equipment leasing companies and
|
Table V.22: Maturity Pattern of Public |
|||
|
(Amount in Rs. crore) |
|||
|
Maturity Period @ |
As at end-March |
||
|
2003 |
2004 |
2005 |
|
|
1 |
2 |
3 |
4 |
|
Less than 1 year |
1,203 |
1,176 |
1,145 |
|
(23.9) |
(27.3) |
(31.4) |
|
|
More than 1 and up |
|||
|
to 2 years |
1,241 |
1,046 |
862 |
|
(24.6) |
(24.2) |
(23.6) |
|
|
More than 2 and up |
|||
|
to 3 years |
1,927 |
1,573 |
1,295 |
|
(38.3) |
(36.4) |
(35.5) |
|
|
More than 3 and up |
|||
|
to 5 years |
619 |
492 |
330 |
|
(12.3) |
(11.4) |
(9.0) |
|
|
5 years and above |
45 |
30 |
14 |
|
(0.9) |
(0.7) |
(0.4) |
|
|
Total |
5,035 |
4,317 |
3,646 |
|
(100.0) |
(100.0) |
(100.0) |
|
|
@ :On the basis of residual maturity of outstanding deposits. Note: Figures in parentheses are percentages to total deposits. |
|||
|
Table V.23: Maximum/Ceiling Interest Rates on Banks and NBFC Deposits |
|||||||
|
(Per cent) |
|||||||
|
Interest Rate |
As at end-March |
||||||
|
2000 |
2001 |
2002 |
2003 |
2004 |
2005 |
||
|
1 |
2 |
3 |
4 |
5 |
6 |
7 |
|
|
1. |
Maximum interest rate on public sector bank deposits |
||||||
|
of 1-3 year maturity |
10.5 |
9.5 |
8.5 |
6.75 |
6.75 |
7.00 |
|
|
2. |
Ceiling interest rate for NBFCs |
16.0 |
14.0 |
12.5 |
11.0 |
11.0 |
11.0 |
|
3. |
Spread (2-1) |
5.5 |
4.5 |
4.0 |
4.25 |
4.25 |
4.00 |
hire purchase companies, increased marginally during the year ended March 2005. Hire purchase companies continued to account for the largest share (59.6 per cent) of total borrowings by all NBFCs (Table V.24).
5.64 Borrowings by NBFCs from banks and FIs and external sources declined, while those by way of debentures increased during 2003-04 and 2004-05. Borrowings from the Government, which had increased marginally during the year ended March 2004, declined sharply in the following year. Borrowings from the Government relate mostly to one State-owned NBFC operating in the Southern region. Hire purchase companies have been the most active in raising resources from banks/FIs and the debt market. Borrowings from banks and financial institutions by equipment leasing and hire purchase companies, which declined sharply during 2003-04, increased marginally in 2004-05. On the other
hand, borrowings by loan companies from banks and FIs after increasing sharply in 2003-04, declined in 2004-05 (Table V.25). Debentures emerged as the most important source of funds for NBFCs during the year ended March 2005, relegating the borrowings from banks and FIs to the second position. Between end-March 2003 and end-March 2005, while the share of borrowings by way of debentures increased from 21.9 per cent to 30.6 per cent, that of borrowings from banks and FIs declined from 36.6 per cent to 27.1 per cent.
Assets of NBFCs
5.65 Advances constitute the main assets of NBFCs. Reflecting the decline in deposits and borrowings, advances extended by all NBFCs declined during the year, barring those by loan companies during the year ended March 2004. While advances by equipment leasing companies and hire
|
Table V.24: Borrowings by NBFCs –Group-wise |
||||||||
|
(Amount in Rs. crore) |
||||||||
|
NBFC Group |
As at end-March |
Percentage |
||||||
|
Variation |
||||||||
|
No. of NBFCs |
Total Borrowings |
|||||||
|
2003 |
2004 |
2005 |
2003 |
2004 |
2005 |
2003-04 |
2004-05 |
|
|
1 |
2 |
3 |
4 |
5 |
6 |
7 |
8 |
9 |
|
Equipment Leasing |
58 |
46 |
38 |
6,472 |
2,811 |
3,112 |
-56.6 |
10.7 |
|
(26.4) |
(13.5) |
(14.2) |
||||||
|
Hire Purchase |
439 |
396 |
316 |
13,650 |
12,141 |
13,008 |
-11.1 |
7.1 |
|
(55.8) |
(58.2) |
(59.6) |
||||||
|
Investment |
19 |
11 |
5 |
1,613 |
1,718 |
1,092 |
6.5 |
-36.4 |
|
(6.6) |
(8.2) |
(5.0) |
||||||
|
Loan |
122 |
87 |
54 |
2,600 |
3,775 |
3,679 |
45.2 |
-2.5 |
|
(10.6) |
(18.1) |
(16.8) |
||||||
|
Others |
232 |
234 |
157 |
145 |
407 |
950 |
180.7 |
133.4 |
|
(0.6) |
(2.0) |
(4.4) |
||||||
|
Total |
870 |
774 |
570 |
24,480 |
20,852 |
21,841 |
-14.8 |
4.7 |
|
(100.0) |
(100.0) |
(100.0) |
||||||
|
Note: Figures in parentheses are percentages to total borrowings. |
||||||||
|
Table V.25: Sources of Borrowings of NBFCs |
||||||||||||||||
|
(Amount in Rs. crore) |
||||||||||||||||
|
NBFC Group |
As at end-March |
|||||||||||||||
|
Government |
External |
Banks and |
Debentures |
Others |
||||||||||||
|
Financial Institutions |
||||||||||||||||
|
2003 |
2004 |
2005 |
2003 |
2004 |
2005 |
2003 |
2004 |
2005 |
2003 |
2004 |
2005 |
2003 |
2004 |
2005 |
||
|
1 |
2 |
3 |
4 |
5 |
6 |
7 |
8 |
9 |
10 |
11 |
12 |
13 |
14 |
15 |
16 |
|
|
Equipment Leasing |
61 |
21 |
– |
571 |
291 |
190 |
3,080 |
1,141 |
1,252 |
1,639 |
893 |
1219 |
1,121 |
465 |
452 |
|
|
(-65.6) |
(-100.0) |
(-49.0) |
(-34.7) |
(-63.0) |
(9.7) |
(-45.5) |
(36.5) |
(-58.5) |
(-2.8) |
|||||||
|
Hire Purchase |
85 |
91 |
– |
124 |
332 |
327 |
5,613 |
4,114 |
4,223 |
2,721 |
3,919 |
4,425 |
5,107 |
3,684 |
4,033 |
|
|
(7.1) |
(-100.0) |
(167.7) |
(-1.5) |
(-26.7) |
(2.6) |
(44.0) |
(12.9) |
(-27.9) |
(9.5) |
|||||||
|
Investment |
1,423 |
1,467 |
885 |
– |
– |
– |
14 |
14 |
10 |
– |
42 |
12 |
176 |
196 |
185 |
|
|
(3.1) |
(-39.7) |
(-28.6) |
(-) |
(-71.4) |
(11.4) |
(-5.6) |
||||||||||
|
Loan |
– |
– |
86 |
– |
– |
– |
245 |
1,132 |
413 |
992 |
1,065 |
1,037 |
1,363 |
1,579 |
2,142 |
|
|
(362.0) |
(-63.5) |
(7.4) |
(-2.6) |
(15.8) |
(35.7) |
|||||||||||
|
Others |
– |
– |
– |
– |
– |
– |
7 |
13 |
31 |
– |
– |
– |
138 |
394 |
920 |
|
|
(85.7) |
(138.5) |
(185.5) |
(133.5) |
|||||||||||||
|
Total |
1,570 |
1,579 |
971 |
695 |
623 |
517 |
8,959 |
6,413 |
5,929 |
5,352 |
5,919 |
6,693 |
7,905 |
6,318 |
7,732 |
|
|
(0.6) |
(-38.5) |
(-10.2) |
(-17.0) |
(-28.4) |
(-7.5) |
(10.6) |
(13.1) |
(-20.1) |
(22.4) |
|||||||
|
– : Nil/Negligible. |
||||||||||||||||
purchase companies increased during the year ended March 2005, those by investment and loan companies declined. Investment by NBFCs also declined during the years ended March 2004 and March 2005, reflecting mainly the impact of decline in investment by two major groups, i.e., equipment leasing and hire purchase companies (Table V.26).
Distribution of NBFCs According to Asset Size
5.66 The asset size of NBFCs varies significantly from less than Rs.25 lakh to above
Rs.500 crore. Most of the companies were in the asset range of more than Rs.50 lakh and up to Rs.10 crore. However, bulk of the assets were held by NBFCs in the large asset size. Sixteen companies with asset size of above Rs.500 crore held 79.4 per cent of total assets of all NBFCs as at end-March 2005 (Table V.27).
Distribution of Assets of NBFCs – Type of Activity
5.67 Assets held by NBFCs in loans and inter-corporate deposits, investments, and equipment and
|
Table V.26: Major Components of Assets of NBFCs – Group-wise |
|||||||||
|
(Amount in Rs. crore) |
|||||||||
|
NBFC Group |
As at end-March |
||||||||
|
Assets |
Advances |
Investment |
|||||||
|
2003 |
2004 |
2005 |
2003 |
2004 |
2005 |
2003 |
2004 |
2005 |
|
|
1 |
2 |
3 |
4 |
5 |
6 |
7 |
8 |
9 |
10 |
|
Equipment Leasing |
7,996 |
3,744 |
4,721 |
7,087 |
3,020 |
3,875 |
1,028 |
348 |
331 |
|
(21.2) |
(11.4) |
(13.9) |
(22.8) |
(11.3) |
(13.9) |
(23.7) |
(9.1) |
(9.4) |
|
|
Hire Purchase |
22,163 |
19,929 |
20,039 |
18,849 |
17,114 |
18,312 |
1,909 |
1,805 |
1,202 |
|
(58.8) |
(60.8) |
(59.2) |
(60.7) |
(64.1) |
(65.8) |
(44.0) |
(47.3) |
(34.3) |
|
|
Investment |
2,208 |
2,422 |
1,890 |
1,520 |
1,617 |
1,061 |
629 |
750 |
788 |
|
(5.9) |
(7.4) |
(5.6) |
(4.9) |
(6.1) |
(3.8) |
(14.5) |
(19.6) |
(22.5) |
|
|
Loan |
4,109 |
5,485 |
5,319 |
2,763 |
4,208 |
3,456 |
527 |
604 |
657 |
|
(10.9) |
(16.7) |
(15.7) |
(8.9) |
(15.8) |
(12.4) |
(12.1) |
(15.8) |
(18.7) |
|
|
Others |
1,233 |
1,173 |
1,874 |
818 |
745 |
1,129 |
245 |
311 |
530 |
|
(3.3) |
(3.6) |
(5.5) |
(2.6) |
(2.8) |
(4.1) |
(5.6) |
(8.1) |
(15.1) |
|
|
Total |
37,709 |
32,753 |
33,843 |
31,037 |
26,704 |
27,833 |
4,338 |
3,818 |
3,508 |
|
(100.0) |
(100.0) |
(100.0) |
(100.0) |
(100.0) |
(100.0) |
(100.0) |
(100.0) |
(100.0) |
|
|
Note: Figures in parentheses represent percentage share in total. |
|||||||||
|
Table V.27: Non-Banking Financial Companies According to Asset Size |
|||||||
|
(Amount in Rs. crore) |
|||||||
|
Asset size |
As at end-March |
||||||
|
2003 |
2004 |
2005 |
2003 |
2004 |
2005 |
||
|
No. of reporting companies |
Assets |
||||||
|
1 |
2 |
3 |
4 |
5 |
6 |
7 |
|
|
1. |
Less than 0.25 |
62 |
59 |
34 |
6 |
6 |
4 |
|
(0.0) |
(0.0) |
(0.0) |
|||||
|
2. |
More than 0.25 and up to 0.50 |
77 |
73 |
41 |
28 |
27 |
15 |
|
(0.1) |
(0.1) |
(0.1) |
|||||
|
3. |
More than 0.50 and 2 |
354 |
317 |
209 |
388 |
352 |
232 |
|
(1.0) |
(1.0) |
(0.7) |
|||||
|
4. |
More than 2 and up to 10 |
245 |
209 |
164 |
1,131 |
964 |
724 |
|
(3.0) |
(2.9) |
(2.1) |
|||||
|
5. |
More than 10 and up to 50 |
68 |
69 |
71 |
1,399 |
1,593 |
1,765 |
|
(3.7) |
(4.9) |
(5.2) |
|||||
|
6. |
More than 50 and up to 100 |
19 |
13 |
18 |
1,315 |
850 |
1,216 |
|
(3.5) |
(2.6) |
(3.6) |
|||||
|
7. |
More than 100 and up to 500 |
28 |
17 |
17 |
6,492 |
3,819 |
3,007 |
|
(17.2) |
(11.7) |
(8.9) |
|||||
|
8. |
Above 500 |
17 |
17 |
16 |
26,950 |
25,143 |
26,880 |
|
(71.5) |
(76.8) |
(79.4) |
|||||
|
Total |
870 |
774 |
570 |
37,709 |
32,754 |
33,843 |
|
|
(100.0) |
(100.0) |
(100.0) |
|||||
|
Note: Figures in parentheses are percentages to total. |
|||||||
leasing declined during 2003-04 and 2004-05. However, assets in hire purchase, which declined during 2003-04, increased sharply in the following year. As a result, assets held in hire purchase
activity accounted for the largest share (42.0 per cent) of total assets of NBFCs, followed by loans, including inter-corporate deposits (33.4 per cent) (Table V.28).
|
Table V.28: Distribution of Assets of NBFCs - Activity-wise |
|||||||
|
(Amount in Rs. crore) |
|||||||
|
Activity |
As at end-March |
Percentage Variation |
|||||
|
2003 |
2004 |
2005 |
2002-03 |
2003-04 |
2004-05 |
||
|
1 |
2 |
3 |
4 |
5 |
6 |
7 |
|
|
1. |
Loans and Inter-corporate deposits |
13,398 |
12,363 |
11,301 |
-2.3 |
-7.7 |
-8.6 |
|
(35.4) |
(37.7) |
(33.4) |
|||||
|
2. |
Investments |
4,338 |
3,818 |
3,508 |
0.1 |
-12.0 |
-8.1 |
|
(11.5) |
(11.7) |
(10.4) |
|||||
|
3. |
Hire Purchase |
13,031 |
11,649 |
14,200 |
-1.3 |
-10.6 |
21.9 |
|
(34.5) |
(35.6) |
(42.0) |
|||||
|
4. |
Equipment and Leasing |
2,011 |
1,115 |
778 |
-35.4 |
-44.6 |
-30.2 |
|
(5.3) |
(3.4) |
(2.3) |
|||||
|
5. |
Bills |
450 |
436 |
464 |
-33.1 |
-3.2 |
6.4 |
|
(1.2) |
(1.3) |
(1.4) |
|||||
|
6. |
Other assets |
4,581 |
3,375 |
3,592 |
-4.6 |
-26.3 |
6.4 |
|
(12.1) |
(10.3) |
(10.6) |
|||||
|
Total |
37,809 |
32,756 |
33,843 |
-5.3 |
-13.4 |
3.3 |
|
|
(100.0) |
(100.0) |
(100.0) |
|||||
|
Note: Figures in parentheses are percentages to total. |
|||||||
Financial Performance of NBFCs
5.68 Financial performance of NBFCs improved during 2003-04 and 2004-05 due mainly to containment of expenditure. Both fund-based and fee-based income of NBFCs declined during the year ended March 2004. During 2004-05, fund-based income and fee-based income improved marginally. Financial and operating expenditure declined during 2003-04 and 2004-05, resulting in improvement in the operating profit and net profit. Increase in net profit for the year ended March 2004, to an extent, was also due to decline in tax provisions. Improvement in net profit combined with decline in total assets led to an improvement in the net profit to asset ratio in 2003-04 and further in 2004-05 (Table V.29 and Chart V.4).
Interest Cost to Total Income
5.69 Interest cost as per cent to total income which increased marginally during 2003-04, declined sharply in the following year. Non-interest costs relative to total income declined in both the years. As a result, cost to income ratio declined
significantly from 88.3 per cent in 2002-03 to 83.8 per cent in 2003-04 and further to 78.8 per cent during 2004-05 (Table V.30).
|
Table V.29: Financial Performance of NBFCs |
||||||||
|
(Amount in Rs. crore) |
||||||||
|
Item |
Percentage Variation |
|||||||
|
2002-03 |
2003-04 |
2004-05 |
2002-03 |
2003-04 |
2004-05 |
|||
|
1 |
2 |
3 |
4 |
5 |
6 |
7 |
||
|
A. |
Income (i+ii) |
5,084 |
4,332 |
4,435 |
-5.1 |
-14.8 |
2.4 |
|
|
(100.0) |
(100.0) |
(100.0) |
||||||
|
(i) |
Fund-based |
4,709 |
4,005 |
4,062 |
-5.9 |
-15.0 |
1.4 |
|
|
(92.6) |
(92.5) |
(91.6) |
||||||
|
(ii) |
Fee-based |
375 |
327 |
373 |
6.5 |
-12.8 |
14.1 |
|
|
(7.4) |
(7.5) |
(8.4) |
||||||
|
B. |
Expenditure (i+ii) |
4,491 |
3,621 |
3,495 |
-15.6 |
-19.4 |
-3.5 |
|
|
(100.0) |
(100.0) |
(100.0) |
||||||
|
(i) |
Financial |
2,757 |
2,099 |
2,054 |
-16.4 |
-23.9 |
-2.1 |
|
|
(61.4) |
(58.0) |
(58.8) |
||||||
|
(ii) |
Operating |
1,734 |
1,522 |
1,441 |
-14.3 |
-12.2 |
-5.3 |
|
|
(38.6) |
(42.0) |
(41.2) |
||||||
|
C. |
Tax |
Provisions |
254 |
180 |
349 |
2.4 |
-29.1 |
93.9 |
|
D. |
Operating Profit (PBT) |
593 |
711 |
940 |
1,547.2 |
19.9 |
32.2 |
|
|
E. |
Net Profit (PAT) |
339 |
531 |
591 |
-259.9 |
56.6 |
11.3 |
|
|
F. |
Total Assets |
37,709 |
32,754 |
33,843 |
-5.3 |
-13.1 |
3.3 |
|
|
G. |
Financial Ratios* |
|||||||
|
(i) |
Income |
13.5 |
13.2 |
13.1 |
||||
|
(ii) |
Fund Income |
12.5 |
12.2 |
12.0 |
||||
|
(iii) |
Fee Income |
1.0 |
1.0 |
1.1 |
||||
|
(iv) |
Expenditure |
11.9 |
11.0 |
10.3 |
||||
|
(v) |
Financial Expenditure |
7.3 |
6.4 |
6.1 |
||||
|
(vi) |
Operating Expenditure |
2.9 |
3.1 |
4.2 |
||||
|
(vii) |
Tax Provisions |
0.7 |
0.5 |
1.0 |
||||
|
(viii) |
Net Profit |
0.9 |
1.6 |
1.7 |
||||
|
* : As percentage to total assets. |
||||||||
|
Table V.30: Interest Cost to Total Income |
||||
|
(Amount in Rs. crore) |
||||
|
Year |
Total |
Total |
Interest |
Non-Interest |
|
Income |
Cost |
Cost |
Cost |
|
|
1 |
2 |
3 |
4 |
5 |
|
2002-03 |
5,084 |
4,491 |
974 |
3,517 |
|
(88.3 ) |
(19.2) |
(69.2) |
||
|
2003-04 |
4,322 |
3,621 |
888 |
2,733 |
|
(83.8) |
(20.5) |
(63.2) |
||
|
2004-05 |
4,435 |
3,495 |
760 |
2,735 |
|
(78.8) |
(17.1) |
(61.7) |
||
|
Note: Figures in parentheses indicate |
||||
Soundness Indicators
Asset Quality of NBFCs
5.70 Gross and net non-performing assets of the reporting NBFCs, as a group, registered a steady decline between end-March 2001 and end-March 2004. While gross NPAs continued to decline during the year ended March 2005, net NPAs increased significantly (Table V.31).
|
Table V.31: Non-Performing |
||
|
(per cent of credit exposure) |
||
|
End-March |
Gross NPAs |
Net NPAs |
|
1 |
2 |
3 |
|
2001 |
11.5 |
5.6 |
|
2002 |
10.6 |
3.9 |
|
2003 |
8.8 |
2.7 |
|
2004 |
8.2 |
2.4 |
|
2005 |
7.0 |
3.4 |
|
* : Excluding MBFCs, MBCs and MNBCs. |
||
5.71 Asset quality of different NBFC groups showed a divergent trend. Gross NPAs as a percentage to total assets of equipment leasing companies, hire purchase companies and investment companies increased during 2003-04, but declined during 2004-05. Gross NPAs of loan companies, however, declined in both the years. More or less the same trend was discernable in respect of net NPAs. Investment companies had the lowest gross NPA ratio at end-March 2005 (1.8 per cent), followed by loan companies (3.7 per cent), hire purchase companies (4.6 per cent) and equipment leasing companies (12.3 per cent) (Table V.32).
|
Table V.32: NPAs of NBFCs - Group-wise |
||||||||
|
(Amount in Rs. crore) |
||||||||
|
NBFC Group/ |
Gross |
Gross NPAs |
Net |
Net NPAs |
||||
|
End-March |
Advances |
Advances |
||||||
|
Amount |
Per cent to |
Per cent to |
Amount |
Per cent to |
Per cent to |
|||
|
Gross Advances |
Assets |
Net Advances |
Assets |
|||||
|
1 |
2 |
3 |
4 |
5 |
6 |
7 |
8 |
9 |
|
Equipment Leasing |
||||||||
|
2001 |
4,118 |
304 |
7.4 |
6.1 |
3,826 |
12 |
0.3 |
0.2 |
|
2002 |
1,625 |
646 |
39.7 |
28.0 |
1,330 |
351 |
26.3 |
15.2 |
|
2003 |
5,969 |
932 |
15.6 |
11.1 |
5,506 |
469 |
8.5 |
5.6 |
|
2004 |
3,306 |
582 |
17.6 |
13.3 |
3,067 |
344 |
11.2 |
7.8 |
|
2005 |
5,611 |
718 |
12.8 |
12.3 |
5,310 |
418 |
7.9 |
7.1 |
|
Hire Purchase |
||||||||
|
2001 |
8,296 |
1,324 |
16.0 |
12.3 |
7,604 |
631 |
8.3 |
5.9 |
|
2002 |
6,825 |
1,167 |
17.1 |
14.8 |
6,068 |
410 |
6.8 |
5.2 |
|
2003 |
16,489 |
1,288 |
7.8 |
6.8 |
15,305 |
104 |
0.7 |
0.5 |
|
2004 |
10,437 |
942 |
9.0 |
7.3 |
9,748 |
253 |
2.6 |
2.0 |
|
2005 |
12,812 |
619 |
4.8 |
4.6 |
12,498 |
306 |
2.4 |
2.3 |
|
Investment |
||||||||
|
2001 |
232 |
53 |
22.9 |
5.1 |
223 |
45 |
20.0 |
4.3 |
|
2002 |
149 |
2 |
1.6 |
0.1 |
147 |
1 |
0.4 |
0.0 |
|
2003 |
93 |
11 |
11.9 |
2.1 |
90 |
8 |
8.9 |
1.5 |
|
2004 |
63 |
15 |
24.2 |
2.6 |
55 |
7 |
12.7 |
1.2 |
|
2005 |
58 |
10 |
17.2 |
1.8 |
58 |
10 |
17.2 |
1.8 |
|
Loan |
||||||||
|
2001 |
7,414 |
595 |
8.0 |
5.9 |
7,118 |
299 |
4.2 |
3.0 |
|
2002 |
3,986 |
549 |
13.8 |
10.1 |
3,615 |
177 |
4.9 |
3.3 |
|
2003 |
2,707 |
144 |
5.3 |
4.8 |
2,503 |
– |
– |
– |
|
2004 |
2,038 |
142 |
7.0 |
4.1 |
1,833 |
– |
– |
– |
|
2005 |
1,906 |
83 |
4.4 |
3.7 |
1,780 |
– |
– |
– |
|
Others |
||||||||
|
2001 |
1,394 |
493 |
35.4 |
24.2 |
1,308 |
407 |
31.1 |
20.0 |
|
2002 |
175 |
9 |
5.1 |
3.0 |
165 |
– |
– |
– |
|
2003 |
294 |
2 |
0.6 |
0.5 |
294 |
1 |
0.5 |
0.4 |
|
2004 |
– |
– |
– |
– |
– |
– |
– |
– |
|
2005 |
– |
– |
– |
– |
– |
– |
– |
– |
|
– : Nil/Negligible. |
||||||||
|
Table V.33: Classification of Assets of NBFCs – Group-wise |
|||||||||||
|
(Amount in Rs. crore) |
|||||||||||
|
Item/End of the Period |
Standard |
Sub-Standard |
Doubtful |
Loss |
Gross |
Total |
|||||
|
Asset |
Asset |
Asset |
Asset |
NPAs |
Assets |
||||||
|
Amount |
per cent |
Amount |
per cent |
Amount |
per cent |
Amount |
per cent |
Amount |
per cent |
||
|
1 |
2 |
3 |
4 |
5 |
6 |
7 |
8 |
9 |
10 |
11 |
12 |
|
Equipment Leasing |
|||||||||||
|
Mar-03 |
5,037 |
84.4 |
520 |
8.7 |
205 |
3.4 |
207 |
3.5 |
932 |
15.6 |
5,969 |
|
Sep-03 |
2,986 |
77.9 |
502 |
13.1 |
194 |
5.1 |
154 |
4.0 |
850 |
22.1 |
3,836 |
|
Mar-04 |
2,724 |
82.4 |
396 |
12.0 |
84 |
2.5 |
102 |
3.1 |
582 |
17.6 |
3,306 |
|
Sep-04 |
3,389 |
87.2 |
365 |
9.4 |
19 |
0.5 |
114 |
2.9 |
498 |
12.8 |
3,887 |
|
Mar-05 |
4,893 |
87.2 |
393 |
7.0 |
98 |
1.7 |
227 |
4.1 |
718 |
12.8 |
5,611 |
|
Hire Purchase |
|||||||||||
|
Mar-03 |
15,201 |
92.2 |
746 |
4.5 |
273 |
1.7 |
269 |
1.6 |
1,288 |
7.8 |
16,489 |
|
Sep-03 |
15,621 |
92.4 |
758 |
4.5 |
245 |
1.5 |
283 |
1.7 |
1,286 |
7.6 |
16,907 |
|
Mar-04 |
9,495 |
91.0 |
613 |
5.9 |
103 |
1.0 |
226 |
2.2 |
942 |
9.0 |
10,437 |
|
Sep-04 |
11,420 |
91.5 |
730 |
5.9 |
118 |
0.9 |
213 |
1.7 |
1,061 |
8.5 |
12,481 |
|
Mar-05 |
12,193 |
95.2 |
401 |
3.1 |
128 |
1.0 |
90 |
0.7 |
619 |
4.8 |
12,812 |
|
Investment |
|||||||||||
|
Mar-03 |
82 |
88.1 |
9 |
9.3 |
2 |
2.4 |
– |
0.2 |
11 |
11.9 |
93 |
|
Sep-03 |
43 |
80.6 |
9 |
16.9 |
1 |
2.4 |
– |
0.1 |
10 |
19.4 |
54 |
|
Mar-04 |
48 |
75.8 |
– |
– |
10 |
15.3 |
6 |
8.9 |
15 |
24.2 |
63 |
|
Sep-04 |
71 |
86.4 |
1 |
1.4 |
10 |
12.1 |
– |
– |
11 |
13.6 |
82 |
|
Mar-05 |
48 |
82.0 |
1 |
1.1 |
10 |
16.7 |
– |
0.2 |
10 |
18.0 |
58 |
|
Loan |
|||||||||||
|
Mar-03 |
2,563 |
94.7 |
37 |
1.3 |
20 |
0.7 |
88 |
3.2 |
145 |
5.3 |
2,708 |
|
Sep-03 |
5,693 |
95.8 |
81 |
1.4 |
59 |
1.0 |
112 |
1.9 |
252 |
4.2 |
5,945 |
|
Mar-04 |
1,896 |
93.0 |
40 |
2.0 |
20 |
1.0 |
82 |
4.0 |
142 |
7.0 |
2,038 |
|
Sep-04 |
1,697 |
93.9 |
28 |
1.6 |
9 |
0.5 |
73 |
4.0 |
110 |
6.1 |
1,807 |
|
Mar-05 |
1,823 |
95.6 |
14 |
0.7 |
41 |
2.1 |
28 |
1.5 |
83 |
4.4 |
1,906 |
|
Others |
|||||||||||
|
Mar-03 |
293 |
99.4 |
1 |
0.4 |
1 |
0.2 |
– |
– |
2 |
0.6 |
295 |
|
Sep-03 |
1 |
55.0 |
– |
25.9 |
– |
19.0 |
– |
– |
1 |
45.0 |
2 |
|
Mar-04 |
– |
– |
– |
– |
– |
– |
– |
– |
– |
– |
– |
|
Sep-04 |
– |
– |
– |
– |
– |
– |
– |
– |
– |
– |
– |
|
Mar-05 |
– |
– |
– |
– |
– |
– |
– |
– |
– |
– |
– |
|
– : Nil/Negligible. |
|||||||||||
5.72 Composition of NPAs of NBFC groups also showed divergent trends during 2003-04 and 2004-05. Composition of NPAs of equipment leasing companies, after showing improvement during the year ended March 2004, deteriorated in the following year. Composition of NPAs of hire purchase companies, investment companies and loan companies deteriorated during 2003-04, but improved in the following year (Table V.33).
Capital Adequacy Ratio
5.73 Capital to risk-weighted assets ratio (CRAR) norms were made applicable to NBFCs in 1998, in terms of which every deposit-taking NBFC is required to maintain a minimum capital
consisting of Tier-I and Tier-II capital of not less than 12 per cent (15 per cent in the case of unrated deposit-taking loan/investment companies) of its aggregate risk-weighted assets and of risk-adjusted value of off-balance sheet items. Total of Tier-II capital, at any point of time, is required not to exceed 100 per cent of Tier-I capital. The number of NBFCs with CRAR less than 12 per cent, which constituted 6.4 per cent of all NBFCs at end-March 2003, declined to 5.2 per cent at end-March 2004, but increased to 19.8 per cent at end-March 2005. On the other hand, number of NBFCs with more than 20 per cent CRAR increased from 85.3 per cent at end-March 2003 to 89.7 per cent at end-March 2004, but declined sharply to 73.5 per cent at end-March 2005 (Table V.34).
|
Table V.34: Capital Adequacy Ratio of NBFCs * |
||||||||||||
|
Range |
As at end-March |
|||||||||||
|
2003 |
2004 |
2005 |
||||||||||
|
EL |
HP |
LC/IC |
Total |
EL |
HP |
LC/IC |
Total |
EL |
HP |
LC/IC |
Total |
|
|
1 |
2 |
3 |
4 |
5 |
6 |
7 |
8 |
9 |
10 |
11 |
12 |
13 |
|
Less than 12 per cent |
10 |
17 |
15 |
42 |
5 |
12 |
8 |
25 |
4 |
55 |
5 |
64 |
|
More than 12 and up to 15 per cent |
1 |
8 |
1 |
10 |
1 |
4 |
1 |
6 |
– |
– |
1 |
1 |
|
More than 15 and up to 20 per cent |
4 |
32 |
9 |
45 |
2 |
15 |
2 |
19 |
2 |
15 |
4 |
21 |
|
More than 20 and up to 30 per cent |
9 |
54 |
11 |
74 |
6 |
38 |
7 |
51 |
5 |
26 |
1 |
32 |
|
Above 30 per cent |
32 |
334 |
121 |
487 |
28 |
300 |
55 |
383 |
25 |
153 |
28 |
206 |
|
Total |
56 |
445 |
157 |
658 |
42 |
369 |
73 |
484 |
36 |
249 |
39 |
324 |
|
– : Nil/Negligible. * : Excluding MBFCs, MBCs and MNBCs. |
||||||||||||
Net Owned Fund vis-à-vis Public Deposits of NBFCs
5.74 Net owned fund (NOF) of NBFCs is the aggregate of paid-up capital and free reserves, netted by (i) the amount of accumulated balance of loss, (ii) deferred revenue expenditure and other intangible assets, if any, and adjusted by investments in shares and loans and advances to (a) subsidiaries, (b) companies in the same group and (c) other NBFCs (in excess of 10 per cent of owned fund). Information of NOFs can complement the information on CRAR. The ratio of public deposits to NOF in respect of almost all NBFC groups except loan companies, after increasing marginally during the year ended March 2004, declined during the year ended March 2005 (Table V.35).
5.75 Net owned funds of NBFCs range from less than Rs.25 lakh to over Rs.500 crore. The
number of companies in nearly all NOF ranges declined during 2003-04 and 2004-05. NOF of NBFCs, which declined marginally during 2003-04, increased during 2004-05. NBFCs in the NOF range of ‘up to Rs.25 lakh’ continued to have negative NOF. One NBFC had NOF above Rs.500 crore at end-March 2005 as against two at end-March 2004. The ratio of public deposits to NOF maintained by NBFCs declined from 1.2 at end-March 2003 to 1.1 at end-March 2004 and further to 0.8 per cent at end-March 2005. NBFCs in the NOF range of Rs.100 crore to Rs.500 crore held the largest share (29.3 per cent) of public deposits (Table V.36).
Residuary Non-Banking Companies (RNBCs)
5.76 Three RNBCs were operating in the country at end-March 2004 and end-March 2005 as against five at end-March 2003. Assets of RNBCs
|
Table V.35: Net Owned Fund vis-à-vis Public deposits of NBFCs* – Group-wise |
|||||||||
|
(Amount in Rs. crore) |
|||||||||
|
NBFC Group |
Net Owned |
Public Deposits |
Public Deposits to |
||||||
|
Fund |
Net Owned Fund |
||||||||
|
2003 |
2004 |
2005 |
2003 |
2004 |
2005 |
2003 |
2004 |
2005 |
|
|
1 |
2 |
3 |
4 |
5 |
6 |
7 |
8 |
9 |
10 |
|
Equipment Leasing |
154 |
96 |
427 |
511 |
344 |
343 |
3.3 |
3.6 |
0.8 |
|
Hire Purchase |
2,979 |
2,235 |
2,597 |
3,539 |
2,963 |
2,315 |
1.2 |
1.3 |
0.9 |
|
Investment |
553 |
607 |
662 |
125 |
106 |
93 |
0.2 |
0.2 |
0.1 |
|
Loan |
367 |
893 |
428 |
177 |
178 |
157 |
0.5 |
0.2 |
0.4 |
|
Others |
88 |
265 |
331 |
683 |
727 |
738 |
7.8 |
2.7 |
2.2 |
|
Total |
4,141 |
4,096 |
4,445 |
5,035 |
4,317 |
3,646 |
1.2 |
1.1 |
0.8 |
|
* : Including MBFCs, MBCs and MNBCs. |
|||||||||
|
Table V.36: Range of Net Owned Funds vis-à-vis Public Deposits of NBFCs* |
|||||||||||||
|
(Amount in Rs. crore) |
|||||||||||||
|
Range of |
As at end-March |
||||||||||||
|
NOF |
|||||||||||||
|
2003 |
2004 |
2005 |
|||||||||||
|
No. of |
Net |
Public |
Public |
No. of |
Net |
Public |
Public |
No. of |
Net |
Public |
Public |
||
|
reporting |
Owned |
Deposits |
Deposits |
reporting |
Owned |
Deposits |
Deposits |
reporting |
Owned |
Deposits |
Deposits |
||
|
companies |
Funds |
as |
companies |
Funds |
as |
companies |
Funds |
as |
|||||
|
multiple |
multiple |
multiple |
|||||||||||
|
of NOFs |
of NOFs |
of NOFs |
|||||||||||
|
1 |
2 |
3 |
4 |
5 |
6 |
7 |
8 |
9 |
10 |
11 |
12 |
13 |
|
|
1. |
Up to 0.25 |
208 |
-1,356 |
843 |
– |
175 |
-881 |
667 |
– |
93 |
-591 |
456 |
– |
|
2. |
More than 0.25 |
||||||||||||
|
and up to 2 |
497 |
309 |
369 |
1.2 |
451 |
289 |
430 |
1.5 |
332 |
228 |
372 |
1.6 |
|
|
3. |
More than 2 |
||||||||||||
|
and up to 10 |
110 |
461 |
467 |
1 |
92 |
394 |
384 |
1 |
97 |
428 |
392 |
0.9 |
|
|
4. |
More than 10 |
||||||||||||
|
and up to 50 |
30 |
677 |
447 |
0.7 |
35 |
683 |
577 |
0.8 |
29 |
661 |
470 |
0.7 |
|
|
5. |
More than 50 |
||||||||||||
|
and up to 100 |
10 |
639 |
255 |
0.4 |
7 |
478 |
204 |
0.4 |
6 |
456 |
158 |
0.3 |
|
|
6. |
More than 100 |
||||||||||||
|
and up to 500 |
15 |
3,411 |
2,654 |
0.8 |
12 |
2,039 |
1,342 |
0.7 |
12 |
2,595 |
1,067 |
0.4 |
|
|
7. |
Above 500 |
– |
– |
– |
– |
2 |
1,094 |
713 |
0.7 |
1 |
669 |
731 |
1.1 |
|
Total |
870 |
4,141 |
5,035 |
1.2 |
774 |
4,096 |
4,317 |
1.1 |
570 |
4,446 |
3,646 |
0.8 |
|
|
– : Nil/Negligible. |
|||||||||||||
declined by 3.5 per cent during the year ended March 2004 and 6.4 per cent during the year ended March 2005. Fixed deposits with banks, bonds/debentures and other fixed income investments, however, increased sharply during 2004-05. Net owned funds of RNBCs increased during 2003-04 and 2004-05.
5.77 Financial performance of RNBCs was lacklustre during 2003-04 and 2004-05. Despite increase in income, their operating profit and net profit declined during 2003-04 due mainly to increase in expenditure. A sharp decline in income of RNBCs during 2004-05 resulted in a further decline in their net profit (Table V.37).
|
Table V.37: Profile of Residuary Non-Banking Companies (RNBCs) |
|||||||
|
(Amount in Rs. crore) |
|||||||
|
Item |
As at end-March |
Percentage Variation |
|||||
|
2003 |
2004 |
2005 |
2003-04 |
2004-05 |
|||
|
1 |
2 |
3 |
4 |
5 |
6 |
||
|
A. |
Assets (i to v) |
21,104 |
20,362 |
19,057 |
-3.5 |
-6.4 |
|
|
(i) |
Unencumbered approved securities |
6,129 |
5,824 |
2,037 |
-5.0 |
-65.0 |
|
|
(ii) |
Fixed deposits with banks |
1,470 |
2,033 |
4,859 |
38.3 |
139.0 |
|
|
(iii) |
Bonds or debentures or commercial papers of Govt. companies/ |
6,553 |
6,048 |
9,225 |
-7.7 |
52.5 |
|
|
public sector banks/ public financial institutions/ corporations |
|||||||
|
(iv) |
Other investments |
912 |
2,059 |
1,639 |
125.8 |
-20.4 |
|
|
(v) |
Other Assets |
6,040 |
4,398 |
1,297 |
-27.2 |
-70.5 |
|
|
B. |
Net Owned Funds |
809 |
1,002 |
1,065 |
23.9 |
6.3 |
|
|
C. |
Total Income (i+ii) |
1,801 |
2,055 |
1,532 |
14.1 |
-25.5 |
|
|
(i) |
Fund Income |
1,801 |
2,055 |
1,530 |
14.1 |
-25.5 |
|
|
(ii) |
Fee Income |
– |
– |
2 |
– |
– |
|
|
D. |
Total Expenses (i+ii+iii) |
1,435 |
1,813 |
1,396 |
26.3 |
-23.0 |
|
|
(i) |
Financial Cost |
1,212 |
1,368 |
1,196 |
12.9 |
-12.6 |
|
|
(ii) |
Operating Cost |
105 |
129 |
146 |
22.9 |
13.2 |
|
|
(iii) |
Other cost |
118 |
316 |
74 |
167.8 |
-76.6 |
|
|
E. |
Taxation |
134 |
32 |
48 |
-76.1 |
50.0 |
|
|
F. |
Operating Profit (PBT) |
366 |
242 |
136 |
-33.9 |
-43.8 |
|
|
G. |
Net profit (PAT) |
232 |
210 |
88 |
-9.5 |
-58.1 |
|
|
– : Nil/Negligible. |
|||||||
Regional Pattern of Deposits of RNBCs
5.78 Of the three RNBCs, two are based in the Eastern region and one in the Central region. While deposits held by RNBCs in the Eastern region declined during the year ended March 2004 and March 2005, those held by RNBCs in the Central region increased in both the years. The RNBCs together held a sizeable portion (82.0 per cent) of total deposits held by all NBFCs at end-March 2005 (Table V.38).
Investment Pattern of RNBCs
5.79 Directions for investments by RNBCs were rationalised in June 2004 with a view to reducing the overall systemic risk in the financial sector and safeguarding the interests of depositors. In this regard, the following road map was prescribed: (a) from the quarter ended June 2005 and onwards, RNBCs were permitted to invest only to the extent of 10 per cent of the aggregated liabilities to the depositors (ALDs) at the second preceding quarter or one time of their net owned fund, whichever is lower, in the manner which in the opinion of the company is safe as per the
approval of its Board of Directors; (b) from the quarter ended June 2006 and onwards, this limit would stand abolished and RNBCs would not be permitted to invest any amount out of the ALDs at the second preceding quarter as per their discretion. Thus, from the quarter ended June 2006 and onwards, RNBCs would be required to invest the entire amount of ALDs at the second preceding quarter in the directed investments.
5.80 Further, the requirement of AA+ rating and listing on the stock exchanges was introduced for bonds/debentures which qualify towards directed investments. These measures are expected to impart greater liquidity and safety to the investments of RNBCs and thus enhance protection available to depositors.
5.81 Aggregated liabilities to depositors (ALDs) increased during the year ended March 2004 and March 2005. Investments in unencumbered approved securities declined sharply, while fixed deposits with banks as also investments in bonds/ debentures increased. As a result, unencumbered approved securities as a percentage of ALDs declined significantly at end-March 2005 from end-March 2003 (Table V.39).
|
Table V.38: Public Deposits held by Registered and Unregistered RNBCs - Region-wise |
||||||
|
(Amount in Rs. crore) |
||||||
|
Region |
2003 |
2004 |
2005 |
|||
|
No. |
Amount |
No. |
Amount |
No. |
Amount |
|
|
1 |
2 |
3 |
4 |
5 |
4 |
5 |
|
Northern |
– |
– |
– |
– |
– |
– |
|
North-Eastern |
– |
– |
– |
– |
– |
– |
|
Eastern |
3 |
7,422 |
2 |
6,523 |
2 |
5,070 |
|
(49.3) |
(42.6) |
(30.5) |
||||
|
Central |
1 |
7,640 |
1 |
8,804 |
1 |
11,530 |
|
(50.7) |
(57.4) |
(69.5) |
||||
|
Western |
– |
– |
– |
– |
– |
– |
|
Southern |
1 |
3 |
– |
– |
– |
– |
|
(0.0) |
||||||
|
Total |
5 |
15,065 |
3 |
15,327 |
3 |
16,600 |
|
Metropolitan cities |
||||||
|
Mumbai |
– |
– |
– |
– |
– |
– |
|
Chennai |
– |
– |
– |
– |
– |
– |
|
Kolkata |
3 |
7,422 |
2 |
6,523 |
2 |
5,070 |
|
New Delhi |
– |
– |
– |
– |
– |
– |
|
Total |
3 |
7,422 |
2 |
6,523 |
2 |
5,070 |
|
– Nil/Negligible. |
||||||
|
Table V.39: Investment Pattern of Residuary Non-Banking Companies |
|||||||
|
(Amount in Rs. crore) |
|||||||
|
Item |
End-March |
Per cent to ALDs |
|||||
|
2003 |
2004 |
2005 |
2003 |
2004 |
2005 |
||
|
1 |
2 |
3 |
4 |
5 |
6 |
7 |
|
|
Aggregated Liabilities to the Depositors (ALDs): |
15,065 |
15,327 |
16,600 |
100 |
100 |
100 |
|
|
a) |
Unencumbered approved securities |
6,129 |
3,702 |
2,036 |
40.7 |
24.2 |
12.3 |
|
b) |
Fixed deposits with banks |
1,470 |
2,431 |
4,859 |
9.8 |
15.9 |
29.3 |
|
c) |
Bonds or debentures or commercial papers of |
||||||
|
Government companies/ public sector banks/ public |
|||||||
|
financial institutions/ corporations |
6,553 |
8,319 |
9,225 |
43.5 |
54.3 |
55.6 |
|
|
d) |
Other investments |
913 |
2,059 |
1,639 |
6.1 |
13.4 |
9.9 |
NBFCs not Accepting Public Deposits and With Assets Size of Rs.500 crore and Above
5.82 In terms of Section 45IA of the RBI Act, 1934 as amended on January 8, 1997, the companies carrying on NBFI activities are required to obtain a Certificate of Registration (CoR) from the Reserve Bank. Further, companies accepting public deposits are required to submit regulatory returns such as Annual Return on public deposits (NBS-1), Half-yearly Return on Prudential Norms (NBS-2) and Quarterly Return on Statutory Liquidity Ratio (NBS-3) as per the NBFC Directions issued on January 31, 1998.
5.83 The Reserve Bank issued CoR to 13,261 NBFCs as on June 30, 2005, out of which only 507 NBFCs are accepting public deposits and submitting the regulatory returns prescribed under the Directions. In order to assess the operations of large non-deposit taking companies, a quarterly return was introduced with effect from September 2004.
To begin with, NBFCs with asset size of Rs.500 crore and above were advised to submit quarterly return covering information on their sources and applications of funds as also on their exposures to the capital market, NPAs and profitability.
5.84 Information based on the returns received from nearly 50 NBFCs with asset size of Rs.500 crore and above for the quarters ended March and June 2005 suggests a marginal increase in their assets/liabilities. Unsecured loans constituted the single largest source of funds for NBFCs, followed by secured loans (Table V.40).
Borrowings
5.85 Borrowings constitute the single most important source of funds (74.2 per cent) for large sized NBFCs. Total borrowing (secured and unsecured) by NBFCs for the quarter ended March and June 2005 were placed at Rs.1,26,823 crore
|
Table V.40: Liabilities of Large Sized NBFCs* |
|||||
|
(Amount in Rs. crore) |
|||||
|
Item |
Quarter Ended |
||||
|
March 2005 |
June 2005 |
||||
|
Amount |
Per cent to |
Amount |
Per cent to |
||
|
total Assets |
total Assets |
||||
|
1 |
2 |
3 |
4 |
5 |
|
|
Total Liabilities |
1,70,957 |
100.0 |
1,79,311 |
100.0 |
|
|
of which : |
|||||
|
a) |
Paid up Capital |
11,233 |
6.6 |
11,294 |
6.3 |
|
b) |
Preference Shares |
689 |
0.4 |
689 |
0.4 |
|
c) |
Reserve & Surplus |
22,827 |
13.4 |
22,976 |
12.8 |
|
d) |
Secured Loans |
52,774 |
30.9 |
56,233 |
31.4 |
|
e) |
Unsecured Loans |
74,049 |
43.3 |
76,758 |
42.8 |
|
* : NBFCs not accepting public deposits with |
|||||
|
Table V.41: Borrowings by Large Sized NBFCs* |
|||||||
|
(Amount in Rs. crore) |
|||||||
|
Item |
Quarter Ended |
||||||
|
March 2005 |
June 2005 |
||||||
|
Amount |
Per cent to |
Amount |
Per cent to |
||||
|
total Borrowings |
total Borrowings |
||||||
|
1 |
2 |
3 |
4 |
5 |
|||
|
A) |
Secured Borrowings (i to vi) |
52,774 |
41.6 |
56,233 |
42.3 |
||
|
i) |
Debentures |
30,777 |
24.3 |
31,914 |
24.0 |
||
|
ii) |
Deferred Credit |
– |
– |
– |
– |
||
|
iii) |
Term Loans from Banks |
11,043 |
8.7 |
11,893 |
8.9 |
||
|
iv) |
Term Loans from FIs |
4,411 |
3.5 |
6,574 |
4.9 |
||
|
v) |
Others |
5,433 |
4.3 |
5,169 |
3.9 |
||
|
vi) |
Interest accrued |
1,110 |
0.8 |
683 |
0.6 |
||
|
B) |
Unsecured Borrowings (i to viii) |
74,049 |
58.4 |
76,758 |
57.7 |
||
|
i) |
Loans from |
Relatives |
1,310 |
1.0 |
1,221 |
0.9 |
|
|
ii) |
ICDs |
7,993 |
6.3 |
7,866 |
5.9 |
||
|
iii) |
Loans from Banks |
19,717 |
15.5 |
21,661 |
16.3 |
||
|
iv) |
Loans from FIs |
2,326 |
1.8 |
2,723 |
2.0 |
||
|
v) |
Commercial Papers |
12,487 |
9.8 |
13,382 |
10.1 |
||
|
vi) |
Debentures |
13,769 |
10.9 |
14,256 |
10.7 |
||
|
vii) |
Others |
15,419 |
12.3 |
14,512 |
10.9 |
||
|
viii) |
Loans Interest accrued |
1,028 |
0.8 |
1,137 |
0.9 |
||
|
Total Borrowings |
1,26,823 |
100.0 |
1,32,991 |
100.0 |
|||
|
– : Nil/Negligible. |
|||||||
and Rs.1,32,991 crore, respectively. Secured borrowings by way of debentures and term loans from banks/FIs increased significantly during the quarter ended June 2005. Unsecured borrowings in the form of loans from banks, debentures and commercial papers also increased during the quarter. Increased borrowings enabled large NBFCs to expand their operations on the asset side (Table V.41).
Application of Funds
5.86 Loans (both secured and unsecured) by NBFCs, which is the single largest item on the asset side, increased by 4.6 per cent during the quarter ended June 2005. A sharp increase (23.7 per cent) was also noticed in their current investment. Long-term investments and hire purchase financing declined marginally. Capital market exposure of large NBFCs also declined marginally (Table V.42).
|
Table V.42: Select Indicators on Application of Funds by Large Sized NBFCs* |
||||||
|
(Amount in Rs. crore) |
||||||
|
Item |
Quarter Ended |
|||||
|
March 2005 |
June 2005 |
|||||
|
Amount |
Per cent to |
total |
Amount |
Per cent to total |
||
|
application of funds |
application of funds |
|||||
|
1 |
2 |
3 |
4 |
5 |
||
|
1. |
Secured Loan |
42,552 |
28.4 |
44,502 |
28.5 |
|
|
2. |
Unsecured Loan |
60,855 |
40.6 |
63,669 |
40.7 |
|
|
3. |
Hire Purchase |
20,763 |
13.9 |
19,982 |
12.8 |
|
|
4. |
Long-term Investment |
14,847 |
9.9 |
14,689 |
9.4 |
|
|
5. |
Current Investment |
10,883 |
7.2 |
13,466 |
8.6 |
|
|
Total |
1,49,900 |
100.0 |
1,56,308 |
100.0 |
||
|
Memo Item: |
||||||
|
Capital Market Exposure |
17,874 |
11.9 |
17,132 |
11.0 |
||
|
of which: |
in Equity |
12,242 |
8.2 |
11,817 |
7.6 |
|
|
* : NBFCs not accepting public deposits with asset size of Rs.500 crore and above. |
||||||
|
Table V.43: Financial Performance of |
||||
|
(Amount in Rs. crore) |
||||
|
Item |
Quarter Ended |
|||
|
March 2005 |
June 2005 |
|||
|
Amount |
Per cent |
Amount |
Per cent |
|
|
to total |
to total |
|||
|
Assets |
Assets |
|||
|
1 |
2 |
3 |
4 |
5 |
|
Total Income |
12,954 |
7.6 |
4,225 |
2.4 |
|
Total Expenses |
9,612 |
5.6 |
2,753 |
1.5 |
|
Net Profit |
2,255 |
1.3 |
1,059 |
0.6 |
|
Total Assets |
1,70,957 |
100.0 |
1,79,311 |
100.0 |
|
* : NBFCs not accepting public deposits with |
||||
Financial Performance
5.87 Total income and expenditure of large NBFCs worked out to 7.6 per cent and 5.6 per cent of total assets, respectively, for the year ended March 2005. Net profit to asset ratio was 1.3 per cent during the year ended March 2005. Large NBFCs earned a sizeable profit of Rs.1,059 crore during the quarter ended June 2005, which was little less than 50 per cent of the total profit earned during the year ended March 2005 (Table V.43).
Asset Quality
5.88 While gross NPAs/total assets ratio remained unchanged, gross NPAs/credit exposure ratio increased significantly during the quarter ended June 2005. Net NPAs relative to both total assets and credit exposure declined during the quarter ended June 2005 (Table V.44).
|
Table V.44: Gross and Net NPAs of |
||||
|
(Per cent) |
||||
|
Item |
End- |
End- |
||
|
March |
June |
|||
|
2005 |
2005 |
|||
|
1 |
2 |
3 |
||
|
1. |
Gross NPAs to Total Assets |
2.3 |
2.3 |
|
|
2. |
Gross NPAs to Total Credit Exposure |
6.3 |
7.9 |
|
|
3. |
Net NPAs to Total Assets |
1.2 |
1.1 |
|
|
4. |
Net NPAs to Total Credit Exposure |
3.4 |
2.5 |
|
|
* :NBFCs not accepting public deposits with asset size of |
||||
4. PRIMARY DEALERS
5.89 The primary dealer (PD) system, created in 1996 continues to be important from the perspective of successful completion of the Government borrowing programme, the size of which is substantial, and the need to further develop the debt markets in India. PDs (at present 17 in number) deal largely in Government securities and other interest rate products and support the borrowing programme of the Central and the State Governments. A number of measures were initiated during 2004-05 to further strengthen the role of PDs in the Government securities market.
Policy Developments
5.90 Prudential guidelines were issued to PDs in June 2004 on dividend distribution policy with focus on pay-out ratio and capital adequacy ratio. Dividend pay-out ratio for PDs, having capital to risk-weighted assets ratio (CRAR) at 20.0 per cent or above in all the four quarters of the previous year, was capped at 50.0 per cent and at 33.3 per cent for PDs not fulfilling the above conditions. A primary dealer cannot declare dividend if the CRAR in any of the four quarters is below the minimum prescribed CRAR of 15 per cent.
5.91 PDs were advised to hold all their equity investments only in dematerialised form by the end of December 2004 and make all fresh investments only in dematerialised form thereafter.
5.92 Guidelines allowing PDs to issue subordinated debt instruments for Tier-II capital and Tier-III capital were issued in October 2004. The guidelines provided for the amount of subordinated debt to be decided by the Board of Directors, ceiling on interest rate spread, restrictions on the type of instrument, mandatory credit rating, compliance with SEBI guidelines, obtaining permission from the Reserve Bank for issuing instruments to NRIs/FIIs, assignment of 100 per cent risk weight for investments in other PDs/ banks and disclosure requirements.
5.93 Since the Reserve Bank would no longer play the role of an underwriter of the last resort from 2006-07, PDs would need to be adequately prepared to ensure success of the market borrowing programme.
5.94 An Internal Technical Group in the Reserve Bank, which examined primary issuance process under the FRBM period, recommended that PDs
must underwrite the entire issuance amount of each auction. Given this significantly higher responsibility for PDs, the Group proposed adoption of risk mitigating measures such as short-selling, introduction of ‘when-issued’ market and exclusivity in primary auctions. In consonance with the proposed incentives, the Group recommended certain market-making obligations for PDs, particularly in the mid-segment. Earlier, another Group (Chairman: Dr. R.H. Patil) had examined the role of PDs in the Government securities market. Both the Reports were discussed in the Technical Advisory Committee (TAC) and certain recommendations were accepted by the Reserve Bank for implementation. Accordingly, several measures were proposed in the Annual Policy Statement for 2005-06. These included: (i) permitted structures of PD business to be expanded to include banks which fulfill certain minimum criteria subject to safeguards and in consultation with banks, PDs
and the Government; (ii) to consider the recommendations of the Technical Group on restructuring the underwriting obligations of PDs, allowing exclusivity to PDs in primary auctions, introduction of ‘when issued’ market and limited short-selling in Government securities in consultation with the Government.
5.95 The operationalisation of these proposed measures is being examined by the TAC and the Reserve Bank/Government of India. The role of PDs in the Government securities market in the post-implementation of FRBM Act, 2003 is envisaged to be more important not only from the debt management perspective, but also from the viewpoint of market development (Box V.2). The risk mitigation tools that are being contemplated by the Reserve Bank and the proposal to expand permitted structures of PD business to include banks might require changes in the regulatory guidelines.
Box V.2: Role of Primary Dealers (PDs) under the FRBM Environment
The primary dealer system, with its current underwriting and bidding commitments, ensured to a great extent the smooth execution of Government borrowing programmes. However, there have been a few instances when some auctions of Government securities remained undersubscribed and devolved on the Reserve Bank. The Reserve Bank’s participation in the primary auction process so far, albeit at the margin, has ensured that (i) the Government borrows as and when it requires funds; and (ii) irrational bidding behavior is avoided.
Under the FRBM Act, 2003, the Reserve Bank with effect from April 1, 2006, will not be allowed to participate in primary auctions. As such the current institutional mechanism requires a relook to ensure that debt management objectives are met and the Government is able to borrow under all market conditions without exacerbating market volatility.
The Internal Technical Group on Central Government Securities Market, which deliberated on various issues concerning Government securities market, suggested that the Reserve Bank’s role in the primary market be replaced by a more active and dynamic participation by PDs. This has necessitated some restructuring of current institutional processes.
Since the current system of annual bidding commitments does not guarantee the success of notified amount being sold at each auction, the Group felt that a system of bidding commitments for each auction is preferable, whereby all PDs put together must commit to bid 100 per cent of each auction, ensuring that the notified amount is sold at each auction. However, since 100 per cent bidding commitments by PDs per se do not ensure that the cost of issuance is minimised or is in line with price discovery, the Group felt that instead of bidding commitments, PDs could be required to underwrite the entire notified amount of an auction. The
methodology for such arrangement was also broadly suggested by the Group.
Recognising that the envisaged system casts a much larger responsibility on the PDs than under the current arrangements, it was suggested by the Group to compensate PDs with appropriate incentives over and above those already available such as access to the call market, cash and securities account with the Reserve Bank, refinance facility and access to the Liquidity Adjustment Facility (LAF). The Group also suggested that the possibility of providing PDs with a facility to repo their auctioned stock with the Reserve Bank for a limited period after the auction allotment, be examined to help them tide over temporary funding risk.
The Group suggested that the participation in the PD system be expanded to include banks to undertake PD activity departmentally. In almost all countries, the concept of primary dealers is limited to an activity and not an entity. That is, institutions such as commercial banks and investment banks, financial institutions and broker-dealers are designated as primary dealers, and no separate entity is required to be formed for this purpose. The Group, therefore, recommended that in addition to current eligibility norms, permitted structures for PD business be expanded to include banks directly undertaking PD activity as a department with independent subsidiary books of account. The operations of the bank may be kept scrupulously distinct from the PD activities. The Group, therefore, recommended that appropriate restructuring of the PD system be encouraged, with smaller PDs either raising the capital base or merging with parent banks, where there are bank subsidiaries.
The Group further suggested that the primary dealers be granted exclusivity in primary auctions and such exclusivity be granted in phases commencing with Treasury Bills and a few auctions of dated securities.
Operations and Performance of the PDs
5.96 PDs continued to be important players in the Government securities market during 2004-05. The liquidity support limits for PDs for 2004-05 were fixed at Rs.3,000 crore as against Rs.4,500 crore for the previous year. The liquidity support was made available at the Reserve Bank’s Repo Rate.
5.97 Bidding commitments in Treasury Bill auctions for all PDs taken together for 2004-05 were fixed at 123 per cent of the issue amount. Total bids received at Rs.1,10,112 crore amounted to 205.8 per cent of the total Treasury Bill issues of Rs.53,500 crore and 74.1 per cent of the total Treasury Bill issues of Rs.1,48,500 crore (inclusive of Market Stabilisation Scheme). For dated securities auctions, the bidding commitments for all PDs taken together were originally fixed at Rs.1,20,300 crore. Subsequently, the bidding commitments were reduced to Rs.77,900 crore on account of reduction in the market-borrowing programme of the Government. The actual bids tendered by the PDs were for Rs.85,474 crore. PDs offered to underwrite the primary issues to the tune of Rs.58,335 crore during the year, out of which bids for Rs.34,720 crore were accepted by the Reserve Bank. The shares of total primary purchases by PDs for Treasury Bills and dated securities at 63 per cent and 47 per cent, respectively, during the year were marginally lower than those of 67 per cent and 50 per cent, respectively, in the preceding year.
5.98 The turnover of transactions by PDs (both outright and repo) in the secondary market for Treasury Bills and Government dated securities at Rs.4,66,242 crore and Rs.12,69,454 crore, respectively, constituted 28.0 per cent and 18.6 per cent, respectively, of the total market turnover of Rs.16,66,020 crore and Rs.68,23,054 crore, respectively.
Sources and Application of Funds
5.99 The investments by PDs in Government securities and corporate bonds declined sharply. Among sources of funds unsecured loans declined sharply (Table V.45).
5.100 The share of Government securities in total assets of PDs declined sharply from 82.3 per cent at end-March 2004 to 69.3 per cent at end-March 2005. Capital funds of the PDs declined to
|
Table V.45: Sources and Application of Funds of |
|||||
|
(Amount in Rs. crore) |
|||||
|
Item |
2003- |
2004- |
Percentage |
||
|
04 |
05# |
Variation |
|||
|
2003-04 |
2004-05 |
||||
|
1 |
2 |
3 |
4 |
5 |
|
|
Sources of Funds |
17,135 |
11,911 |
2.2 |
-30.5 |
|
|
1. |
Capital |
2,354 |
2,332 |
17.5 |
-0.9 |
|
2. |
Reserves and Surplus |
3,675 |
3,334 |
32.3 |
-9.3 |
|
3. |
Loans (a+b) |
11,106 |
6,245 |
-7.4 |
-43.8 |
|
a) Secured |
1,654 |
2,445 |
-70.2 |
47.8 |
|
|
b) Unsecured |
9,452 |
3,800 |
47.0 |
-59.8 |
|
|
Application of Funds |
17,135 |
11,911 |
2.2 |
-30.5 |
|
|
1. |
Fixed Assets |
71 |
75 |
6.0 |
5.6 |
|
2. |
Investments (a to d) |
16,436 |
10,224 |
3.6 |
-37.8 |
|
a) Government Securities |
14,094 |
8,255 |
-2.2 |
-41.4 |
|
|
b) Commercial papers |
123 |
443 |
16.0 |
260.2 |
|
|
c) Corporate Bonds |
2,055 |
1,176 |
75.9 |
-42.8 |
|
|
d) Others |
164 |
350 |
– |
113.4 |
|
|
3. |
Loans and Advances |
2,567 |
2,322 |
41.8 |
-9.5 |
|
4. |
Non Current Assets |
– |
– |
– |
– |
|
5. |
Others* |
-1,939 |
-710 |
100.8 |
-63.4 |
|
– : Nil/Negligible. |
|||||
Rs.5,603 crore at end-March 2005 from Rs.6,015 crore at end-March 2004 (Table V.46). Despite this decline, however, PDs were able to maintain capital to risk weighted assets ratios far in excess of the minimum requirement of 15 per cent (Table V.46 and Appendix Table V.7).
|
Table V.46: Select Indicators of |
|||
|
(Amount in Rs. crore) |
|||
|
Item |
End-March |
||
|
2004 |
2005 # |
||
|
1 |
2 |
3 |
|
|
Total Assets* |
17,135 |
11,911 |
|
|
Of which: |
Government securities |
14,094 |
8,255 |
|
Government securities as |
|||
|
percentage of total assets |
82.3 |
69.3 |
|
|
Total Capital Funds |
6,015 |
5,603 |
|
|
CRAR |
42.7 |
54.3 |
|
|
Liquidity Support Limit |
2,250 |
3,000 |
|
|
(normal) |
(normal) |
||
|
2,250 |
|||
|
(backstop) |
|||
|
*: Net of current liabilities and provisions. |
|||
|
Table V.47: Financial Performance of |
|||||
|
(Amount in Rs. crore) |
|||||
|
Item |
2003- |
2004- |
Percentage |
||
|
04 |
05# |
Variation |
|||
|
2003-04 |
2004-05 |
||||
|
1 |
2 |
3 |
4 |
5 |
|
|
A. Income (i to iv) |
2,845 |
574 |
5.4 |
-79.8 |
|
|
i) |
Interest |
1,132 |
778 |
1.8 |
-31.3 |
|
ii) |
Discount |
174 |
44 |
-4.4 |
-74.7 |
|
iii) |
Trading Profit |
1,131 |
-700 |
-1.4 |
-161.9 |
|
iv) |
Others |
408 |
452 |
57.5 |
10.8 |
|
B. Expenses (i+ii) |
977 |
769 |
-2.6 |
-21.3 |
|
|
i) |
Interest |
655 |
459 |
-9.3 |
-29.9 |
|
ii) |
Administrative Costs |
322 |
310 |
14.6 |
-3.7 |
|
C. Profit Before Tax |
1,868 |
-195 |
10.1 |
-110.4 |
|
|
D. Net Profit |
1,229 |
-250 |
14.8 |
-120.3 |
|
|
# : Unaudited. |
|||||
Financial Performance of PDs
5.101 Net interest income of PDs declined during 2004-05. This combined with trading losses incurred during the year due to hardening of
|
Table V.48: Financial Indicators of |
||||||
|
(Amount in Rs. crore) |
||||||
|
Indicator |
2003-04 |
2004-05 |
||||
|
1 |
2 |
3 |
||||
|
i) |
Net Profit |
1,229 |
-250 |
|||
|
ii) |
Average Assets |
18,860 |
15,228 |
|||
|
iii) |
Return on Average Assets (per cent) |
6.5 |
-1.6 |
|||
|
iv) |
Net Worth |
5,998 |
5,592 |
|||
|
Note:1. Average net worth is the average of |
||||||
interest rates resulted in net losses before and after taxes (Table V.47). Ten PDs out of 17 posted net profits during the year (Appendix Table V.8).
5.102 The return on average assets of PDs was negative during the year, reflecting the impact of net losses. The losses suffered by PDs eroded their net worth which declined to Rs.5,592 crore at end-March 2005 from 5,998 crore in the previous year (Table V.48).

આ પેજ શેર કરો:


રિઝર્વ બેંક ઑફ ઇન્ડિયા મોબાઇલ એપ્લિકેશન ઇન્સ્ટૉલ કરો અને લેટેસ્ટ ન્યૂઝનો ઝડપી ઍક્સેસ મેળવો!
અમારી એપ ઇન્સ્ટોલ કરવા માટે QR કોડ સ્કેન કરો


પેજની છેલ્લી અપડેટની તારીખ:


