Chapter III
Operations
and Performance of Commercial Banks Introduction
3.1 The business and financial performance of scheduled commercial banks
(SCBs)1 during 2007-08 continued to be shaped by the strong macroeconomic performance
during the year. In line with the policy initiatives undertaken by the Reserve
Bank, the growth in credit by SCBs exhibited some moderation during the year.
The moderation in credit was observed across all the sectors, barring services.
On the liability side, deposit growth continued to be strong, albeit
it was marginally lower than that in the previous year mainly on account of deceleration
in term deposits. Banks' investments in government and other securities recorded
a higher growth during 2007-08, partly on account of a large issuance of MSS securities
during the year. However, as percentage of net demand and time liabilities (NDTL),
investment by banks in Government and other approved securities remained more
or less at the previous year's level. Overall, the credit-deposit ratio of banks
declined during the year as a result of continued strong growth in deposits combined
with moderation in credit.
3.2 Net interest margins of banks continued
to decline during the year, reflecting the increase in competitive pressures.
However, sharp increase in non-interest income and subdued growth in operating
costs resulted in sharp increase in net profits of SCBs during the year. Consequently,
return on assets showed a marginal improvement in 2007-08. Despite increase in
gross non-performing assets (NPAs) in absolute terms during the year, asset quality
(gross NPAs as percentage of gross loans and advances) of banks in general and
of public sector banks in particular continued to improve. The capital to risk-weighted
assets ratio of the banking sector also showed marked improvement during the year,
both on account of large capital raised by banks from the capital market during
2007-08 and increase in reserves.
3.3 Against this backdrop, this
chapter profiles the operations and financial performance of SCBs at the aggregate
as well as bank group levels. The chapter is organised into eleven sections. Section
2 analyses the balance sheet operations of SCBs on an aggregate basis, while Section
3 delineates their off-balance sheet operations. Financial performance of SCBs
is analysed in Section
4. Section 5 delineates the trends in soundness indicators.
Operations of SCBs in the capital market are detailed in Section 6, while technological
developments in banking during the year are covered in Section 7. Regional spread
of banking is set out in Section 8. Section 9 presents an update on customer service
and financial inclusion. Apart from the SCBs, 91 regional rural banks (RRBs)2
and four local area banks (LABs) were also operating in the country. While the
performance of SCBs forms the core of this chapter, the performance of RRBs and
LABs is detailed separately in Section 10 and Section 11, respectively. 2.
Liabilities and Assets of Scheduled Commercial Banks
3.4 As the process of consolidation of banks continued during 2007-08, the number
of SCBs declined from 82 at end-March 2007 to 79 at end-March 2008 due to merger
of two old private sector banks and amalgamation of a foreign bank. The Sangli
Bank Ltd. was amalgamated with ICICI Bank Ltd. under Section 44A of the Banking
Regulation Act, 1949 effective April 19, 2007. Under the same Section, the Reserve
Bank, on August 27, 2007 sanctioned the Scheme of Amalgamation of Lord Krishna
Bank Ltd. with Centurion Bank of Punjab Ltd. The Scheme came into force with effect
from the commencement of business on August 29, 2007. Subsequently, the Scheme
of Amalgamation of Centurion Bank of Punjab Ltd. with HDFC Bank Ltd. was sanctioned
by the Reserve Bank on May 20, 2008; the Scheme came into force with effect from
the commencement of business on May 23, 2008.
3.5 Consequent upon
the global acquisition of banking business (excluding credit card and travel related
business) of American Express Bank Ltd. (AEBL) by Standard Chartered Bank as a
stock sale, the Reserve Bank sanctioned amalgamation of the Indian branches of
AEBL with the Indian branches of Standard Chartered Bank on March 5, 2008. Furthermore,
American Express Banking Corporation (AEBC), the parent bank of AEBL, was issued
a banking license under Section 22 of the BR Act, 1949 to open its maiden branch
in New Delhi for conducting the business relating to credit cards, travel related
services and institutional deposits of AEBL, which was transferred to it prior
to the sale of AEBL’s banking business to Standard Chartered Bank.
3.6 The aggregate balance sheet of SCBs expanded by 25.0 per cent during
2007-08 as compared with 24.2 per cent in the previous year (Table
III.1). The continued higher growth in assets of SCBs than the growth rate
of the economy resulted in the increase in the ratio of assets of SCBs to GDP
(at current market prices) to 91.8 per cent at end-March 2008 from 83.5 per cent
at end-March 2007. As banks improved their capital base during 2007-08, the leverage
(measured by the equity multiplier, which is defined as total assets divided by
the total equity) of the banking system during the year declined significantly
to 13.7 at end-March 2008 from 15.8 a year ago.
Table
III.1: Consolidated Balance Sheet of Scheduled Commercial Banks |
(Amount
in Rs. crore) | Item | As
at end-March |
| 2007 | 2008 |
| Amount
Per cent | Amount | Per
cent |
| to
Total |
| to
Total | 1 | 2 | 3 | 4 | 5 |
Liabilities | | | | |
1. | Capital | 29,559 | 0.9 | 39,900 | 0.9 |
2. | Reserve
and Surplus | 1,89,619 | 5.5 | 2,75,657 | 6.4 |
3. | Deposits | 26,96,936 | 77.9 | 33,20,054 | 76.7 |
| 3.1. | Demand
Deposits | 3,54,895 | 10.3 | 4,42,055 | 10.2 |
| 3.2. | Savings
Bank | | | | |
| | Deposits | 6,31,651 | 18.3 | 7,44,051 | 17.2 |
| 3.3. | Term
Deposits | 17,10,388 | 49.4 | 21,33,947 | 49.3 |
4. | Borrowings | 2,43,010 | 7.0 | 2,97,349 | 6.9 |
5. | Other
Liabilities and Provisions | 3,00,836 | 8.7 | 3,93,523 | 9.1 |
Total Liabilities/Assets | 34,59,961 | 100.0 | 43,26,486 | 100.0 |
Assets |
1. | Cash
and Balances | | | | |
| with
RBI | 1,95,265 | 5.6 | 3,22,997 | 7.5 |
2. | Balances
with Banks | | | | |
| and
Money at Call and | | | | |
| Short
Notice | 1,58,302 | 4.6 | 1,10,326 | 2.6 |
3. | Investments | 9,50,981 | 27.5 | 11,76,154 | 27.2 |
| 3.1 | Government | | | | |
| | Securities
(a+b) | 7,54,446 | 21.8 | 9,25,799 | 21.4 |
| | a)
In India | 7,50,722 | 21.7 | 9,20,241 | 21.3 |
| | b)
Outside India | 3,723 | 0.1 | 5,558 | 0.1 |
| 3.2 | Other
Approved | | | | |
| | Securities | 12,764 | 0.4 | 10,587 | 0.2 |
| 3.3 | Non-Approved | | | | |
| | Securities | 1,83,771 | 5.3 | 2,39,767 | 5.5 |
4. | Loans
and Advances | 19,81,236 | 57.3 | 24,77,039 | 57.3 |
| 4.1 | Bills
purchased | | | | |
| | and
Discounted | 1,24,292 | 3.6 | 1,50,983 | 3.5 |
| 4.2 | Cash
Credits, | | | | |
| | Overdrafts,
etc. | 7,09,803 | 20.5 | 8,89,663 | 20.6 |
| 4.3 | Term
Loans | 11,47,140 | 33.2 | 14,36,391 | 33.2 |
5. | Fixed
Assets | 31,362 | 0.9 | 42,395 | 1.0 |
6. | Other
Assets | 1,42,812 | 4.1 | 1,97,573 | 4.6 |
Note: Data
for 2006-07 are as reported in the balance sheets of banks for 2007-08 and hence
may not match with those reported in the Report on Trend and Progress of Banking
in India, 2006-07, as the figures for 2006-07
were revised by some banks.
Source: Balance Sheets of respective banks. | 3.7
The composition of assets of SCBs during 2007-08 remained more or less the same
as in the previous year. On the liability side, the share of reserves and surplus
increased, while that of deposits declined. Aggregate deposits of SCBs continued
to show strong growth during 2007-08, though it was lower than the previous year.
Capital and reserves grew at a significantly higher rate in 2007-08 in comparison
with 2006-07. The growth rate of loans and advances moderated as compared with
that in the previous year, partly reflecting the impact of measures taken by the
Reserve Bank such as increase in cash reserve ratio (CRR), which, in turn, was
reflected in the significant increase in cash and balances with the Reserve Bank.
Banks' investments in Government securities grew at a much higher rate in comparison
with the last year [Table III.1, Table III.2
and Appendix Table III.1 (A) to (C)]. 3.8 Among the banks groups, the balance
sheets of foreign and new private sector banks expanded at a higher rate as compared
with other bank groups (Table III.2). As a result, the combined
share of foreign and new private sector bank groups in total assets of SCBs increased
further to 25.6 per cent at end-March 2008 from 24.8 per cent at end-March 2007.
The growth rates in the assets of public sector banks and old private sector banks
during 2007-08 at 23.9 per cent and 21.2 per cent, respectively, were higher than
those during the previous year. However, their assets grew at a lower rate than
those of SCBs as a whole [Appendix Table III.1 (A) to (C)].
Table
III.2: Growth of Balance Sheet of Scheduled Commercial Banks - Bank Group-wise
| (Per
cent) | Item | As
at end-March |
| 2007 | 2008 |
| Public
Sector Banks | Old
Private Sector Banks | New
Private Sector Banks | Foreign
Banks | All
SCBs | Public
Sector
Banks | Old
Private Sector Banks | New
Private Sector Banks | Foreign
Banks | All
SCBs | 1 | 2 | 3 | 4 | 5 | 6 | 7 | 8 | 9 | 10 | 11 |
1. | Capital | 0.7 | 4.4 | 5.6 | 45.4 | 17.3 | 5.2 | 1.8 | 14.6 | 71.0 | 35.0 |
2. | Reserve
and Surplus | 20.0 | 11.6 | 17.4 | 30.6 | 20.0 | 31.3 | 47.1 | 97.9 | 35.0 | 45.4 |
3. | Deposits | 22.9 | 6.0 | 38.8 | 32.5 | 24.6 | 23.1 | 19.8 | 23.1 | 26.8 | 23.1 |
| 3.1. | Demand
Deposits | 19.3 | 3.9 | 36.7 | 19.3 | 21.1 | 20.4 | 23.4 | 38.6 | 28.3 | 24.6 |
| 3.2. | Saving
Bank Deposits | 15.0 | 6.7 | 33.3 | 16.3 | 16.4 | 14.9 | 16.2 | 40.5 | 20.2 | 17.8 |
| 3.3. | Term
Deposits | 27.3 | 6.1 | 40.6 | 47.1 | 28.7 | 27.0 | 20.2 | 16.0 | 27.7 | 24.8 |
4. | Borrowings | 5.7 | 22.3 | 42.8 | 33.0 | 19.6 | 24.1 | 8.0 | 26.1 | 14.2 | 22.4 |
5. | Other
Liabilities and Provisions | 16.3 | 16.1 | 51.1 | 72.4 | 28.1 | 28.5 | 21.3 | 17.5 | 65.5 | 30.8 |
Total Liabilities/Assets | 21.1 | 7.1 | 38.7 | 37.6 | 24.2 | 23.9 | 21.2 | 27.5 | 32.7 | 25.0 |
1. | Cash
and Balances with RBI | 26.1 | 25.9 | 93.7 | 49.8 | 35.2 | 61.5 | 74.4 | 74.3 | 81.2 | 65.4 |
2. | Balances
with Banks and Money | | | | | | | | | | |
| at
Call and Short Notice | 26.8 | 5.8 | 91.9 | 41.9 | 35.9 | -31.7 | -20.2 | -33.7 | -25.1 | -30.3 |
3. | Investments | 4.9 | -3.6 | 26.4 | 36.4 | 9.7 | 20.2 | 23.1 | 31.3 | 38.4 | 23.7 |
| 3.1 | Government
Securities (a+b) | 3.6 | -2.2 | 33.0 | 37.5 | 9.3 | 20.5 | 20.0 | 21.8 | 47.5 | 22.7 |
| | a.
In India | 3.6 | -2.0 | 32.9 | 37.5 | 9.4 | 20.3 | 20.0 | 21.9 | 47.5 | 22.6 |
| | b.
Outside India | -8.6 | -100.0 | 125.0 | 0.0 | -5.9 | 58.3 | 0.0 | -53.6 | 0.0 | 49.3 |
| 3.2 | Other
Approved Securities | -7.8 | -30.9 | -10.3 | 0.2 | -8.5 | -16.7 | -20.7 | 12.0 | -60.9 | -17.0 |
| 3.3 | Non-Approved
Securities | 13.8 | -7.6 | 11.4 | 32.8 | 13.3 | 22.6 | 37.7 | 57.0 | 5.2 | 30.5 |
4. | Loans
and Advances | 30.2 | 12.0 | 39.9 | 29.5 | 30.6 | 24.8 | 20.2 | 26.4 | 27.5 | 25.0 |
| 4.1 | Bills
Purchased and Discounted | 22.4 | -15.4 | 20.7 | 21.3 | 19.9 | 16.3 | 36.9 | 36.8 | 36.5 | 21.5 |
| 4.2 | Cash
Credits, Overdrafts, etc. | 25.6 | 11.6 | 42.3 | 20.9 | 25.6 | 24.3 | 20.3 | 31.0 | 33.8 | 25.3 |
| 4.3 | Term
Loans | 34.6 | 16.5 | 40.7 | 38.7 | 35.3 | 26.2 | 18.3 | 24.6 | 21.2 | 25.2 |
5. | Fixed
Assets | 37.7 | -5.6 | 4.2 | 24.4 | 25.0 | 42.6 | 26.2 | 15.9 | 32.3 | 35.2 |
6. | Other
Assets | 7.1 | 0.7 | 33.9 | 72.9 | 22.5 | 31.2 | -1.5 | 28.1 | 67.0 | 38.3 |
Source :
Balance Sheets of respective banks. | 3.9 The impact of
differential growth rate across different banks groups was broadly reflected in
their market shares in terms of major indicators of balance sheets (Table
III.3).
Deposits
3.10
Aggregate deposits of scheduled commercial banks showed a lower growth of 23.1
per cent during 2007-08 as compared with 24.6 per cent in the previous year. The
deceleration in aggregate deposits was on account of moderation in the growth
of term deposits (24.8 per cent) as compared with that in the previous year (28.7
per cent). Demand deposits and saving bank deposits showed a higher growth than
that in the previous year.
3.11 The trend of increasing dependence
of banks on certificates of deposit (CDs) continued during 2007-08. The amount
of CDs outstanding increased by 58.5 per cent to Rs.1,47,792 crore by end-March
2008. CDs outstanding as percentage of aggregate deposits increased to 4.5 per
cent as on March 28, 2008 from 3.5 per cent a year ago (Appendix Table III.2). 3.12
Bank groups-wise analysis reveals that deposits of foreign sector banks grew at
the highest rate (26.8 per cent). While deposits of public sector banks and new
private sector banks showed a growth of 23.1 per cent each, old private sector
banks’ deposits increased by 19.8 per cent during 2007-08. Though the growth
in deposits of old private sector banks was significantly higher than that in
the previous year, their share in aggregate deposits of SCBs declined further,
albeit marginally during 2007-08. The share of foreign banks in aggregate
deposits increased marginally during 2007-08, while that of public and new private
sector banks remained at the previous year’s level (Chart
III.1).
Non-Deposit Resources
3.13
Among the non-deposit resources, borrowings by banks increased by 22.4 per cent
during 2007-08 as compared with a growth of 19.6 per cent in the previous year
(Table III.2). Resources raised from the capital market through
public issues (excluding offer for sale) in the domestic capital market increased
sharply by Rs.30,455 crore during 2007-08 as compared with Rs.1,066 crore during
2006-07. This was mainly on account of good performance of banking scrips in the
secondary market, strong financial results of banks, increased need to raise capital
in the face of sharp expansion of balance sheets, ensuing implementation of Basel
II norms and tightening of capital adequacy norms for sensitive sectors (refer
Section 6 for details).
Table
III.3: Major Components of Balance Sheets of Scheduled Commercial Banks -
Bank
Group-wise | (As
at end-March) | (Per
cent) | Bank
Group | Assets | Deposits | Advances | Investments |
| 2007 | 2008 | 2007 | 2008 | 2007 | 2008 | 2007 | 2008 |
1 | 2 | 3 | 4 | 5 | 6 | 7 | 8 | 9 |
Public Sector Banks | 70.5 | 69.9 | 73.9 | 73.9 | 72.7 | 72.6 | 69.9 | 67.9 |
Nationalised Banks | 44.2 | 43.5 | 48.8 | 48.4 | 45.2 | 45.3 | 44.9 | 42.7 |
State Bank Group | 23.3 | 23.4 | 23.5 | 23.3 | 24.3 | 24.0 | 22.3 | 22.4 |
Other Public Sector Bank | 3.0 | 3.0 | 1.6 | 2.2 | 3.2 | 3.3 | 2.7 | 2.8 |
Private Sector Banks | 21.5 | 21.7 | 20.5 | 20.3 | 20.9 | 20.9 | 22.6 | 23.7 |
Old Private Sector Banks | 4.6 | 4.5 | 5.1 | 5.0 | 4.7 | 4.5 | 4.6 | 4.6 |
New Private Sector Banks | 16.9 | 17.2 | 15.3 | 15.3 | 16.2 | 16.4 | 18.0 | 19.1 |
Foreign Banks | 7.9 | 8.4 | 5.6 | 5.8 | 6.4 | 6.5 | 7.5 | 8.4 |
Scheduled Commercial Banks | 100.0 | 100.0 | 100.0 | 100.0 | 100.0 | 100.0 | 100.0 | 100.0 |
Source : Balance
sheets of respective banks. | 
International
Liabilities of Banks
3.14 International liabilities of banks
grew at a slower rate of 8.4 per cent during 2007-08 as compared with 17.6 per
cent in the previous year. The slowdown was mainly due to decline in FCNR(B) deposits,
NRE deposits, own issues of securities and lower growth in ADRs/GDRs and equities
of banks held by non-residents. On the other hand, NRO rupee deposits, foreign
currency borrowings, and capital/remittable profits of foreign banks in India
increased at a higher rate (Table III.4).
Table
III.4: International Liabilities of Banks - By Type |
(Amount
in Rs. crore) | Item |
| As
at end-March |
| 2006 | 2007 | 2008 |
1 | 2 | 3 | 4 |
1. | Deposits
and Loans | 2,46,246 | 2,71,403 | 2,89,362 |
| | | (80.3) | (75.2) | (74.0) |
| of
which: | | | |
| a) | Foreign
Currency Non-Resident Bank [FCNR(B)] | 58,110 | 68,086 | 60,340 |
| | | (19.0) | (18.9) | (15.4) |
| b) | Foreign
currency Borrowings * | 63,722 | 61,470 | 77,257 |
| | | (20.8) | (17.0) | (19.8) |
| c) | Non-resident
External Rupee (NRE) A/C | 100,310 | 112,907 | 111,301 |
| | | (32.7) | (31.3) | (28.5) |
| d) | Non-Resident
Ordinary (NRO) Rupee Deposits | 5,449 | 6,855 | 11,387 |
| | | (1.8) | (1.9) | (2.9) |
2. | Own
Issues of Securities/Bonds (including IMD/RIBs) | 4,856 | 10,036 | 9,166 |
| | | (1.6) | (2.8) | (2.3) |
3. | Other
Liabilities | 55,506 | 79,258 | 92,329 |
| | | (18.1) | (22.0) | (23.6) |
| of
which: | | | |
| a) | ADRs/GDRs | 14,835 | 23,515 | 25,111 |
| | | (4.8) | (6.5) | (6.4) |
| b) | Equity
of banks held by non-residents | 28438 | 40328 | 45603 |
| | | (9.3) | (11.2) | (11.7) |
| c) | Capital/remittable
profits of foreign banks in India and other unclassified international liabilities | 12,233 | 15,415 | 21,615 |
| (4.0) | (4.3) | (5.5) |
Total International
Liabilities | 3,06,609 | 3,60,698 | 3,90,857 |
| (100.0) | (100.0) | (100.0) |
* : Inter-bank borrowings in
India and from abroad and external commercial borrowings of banks.
Note
: Figures in parentheses are percentages to total.
Source
: Locational Banking Statistics. | 3.15 The share
of foreign currency deposits in total international liabilities continued to decline
during 2007-08, whereas that of borrowings increased to 19.8 per cent from 17.0
per cent in the previous year (Chart III.2).
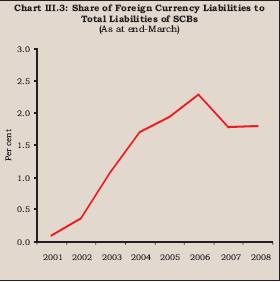
3.16
The share of foreign currency liabilities of scheduled commercial banks in their
total liabilities in 2007-08 remained unchanged at the previous year’s level
(Chart III.3).
Bank Credit
3.17 Growth rate in aggregate loans and advances of
SCBs decelerated to 25.0 per cent during 2007-08 from 30.6 per cent in 2006-07
and an average growth of 31.9 per cent during 2004-05 to 2006-07. This was mainly
on account of sharp deceleration in growth of terms loans (which constituted 58.0
per cent of total loans and advances) to 25.2 per cent in 2007-08 from 35.3 per
cent in the previous year. Notwithstanding the deceleration in terms loans, the
ratio of term loans to gross domestic capital formation (GDCF) in the country
increased to 89.9 per cent in 2007-08 from 77.1 per cent in the previous year
(Chart III.4). Among the other major components, bills purchased
and discounted witnessed a higher growth in the 2007-08, while cash credit and
overdraft grew broadly at the same rate as in the previous year. 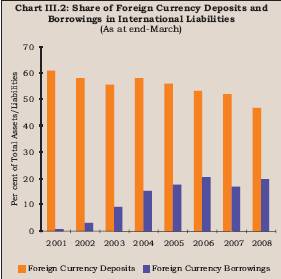
Sectoral
Deployment of Bank Credit
3.18 The overall deceleration in bank
credit during 2007-08 was reflected in the flow of credit to all the major sectors,
barring the services sector. The deceleration was more pronounced in respect of
agriculture and allied activities and personal loans, whereas credit to industry
showed a marginal slowdown. Apart from general moderation of overall credit, drought
in certain pockets of the country, lower demand for credit in anticipation of
waiver under Debt Waiver Scheme, exclusion of loans to bodies such as Electricity
Boards from the category of agricultural lending under the revised priority sector
guidelines and lower investment credit may have contributed to the deceleration
in credit to agriculture (Table III.5 and Appendix Table
III.3). 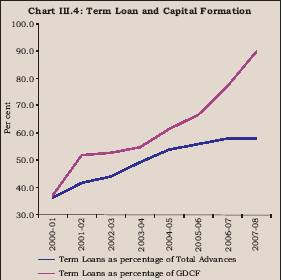
Table
III.5 Sectoral Deployment of Gross Bank | Credit:
Flows | (Variations
over the year) | (Amount
in Rs. crore) | Sector | 2006-07 | 2007-08 |
| Absolute | Per
cent | Absolute | Per
cent | 1 | 2 | 3 | 4 | 5 |
1. | Agriculture
and | | | | | |
| Allied
Activities | | 56,426 | 32.4 | 43,260 | 18.8 |
2. | Industry
(Small, | | | | | |
| Medium
and Large) | | 1,46,890 | 26.7 | 1,74,566 | 25.0 |
| Of
which: Small | | 25,888 | 28.4 | 27,924 | 32.2 |
3. | Personal
Loans | | 96,486 | 26.8 | 48,656 | 10.7 |
| Of
which: Housing | | 45,791 | 24.7 | 24,659 | 10.7 |
4. | Other
Services | | 96,596 | 30.2 | 1,29,743 | 31.1 |
| Of
which: | | | | | |
| (i) | Wholesale
Trade | | 10,422 | 26.3 | 4,472 | 8.9 |
| | (other
than food | | | | | |
| | procurement) | | | | | |
| (ii) | Real
Estate Loans | | 18,483 | 69.2 | 17,070 | 37.8 |
| (iii) | Non-Banking | | | | | |
| | Financial
Companies | 14,722 | 42.9 | 26,274 | 53.6 |
Total | Non-Food
Gross | | | | | |
Bank Credit (1 to 4) | 3,96,399 | 28.2 | 4,01,799 | 22.3 |
Of which, Priority
Sector | 1,23,404 | 24.2 | 1,04,544 | 16.5 |
Notes
: 1. Data are provisional and relate to select scheduled commercial banks
which account for more than 90 per cent of bank credit of all scheduled commercial
banks. Data include the figures of Bharat Overseas Bank,which was merged with
Indian Overseas Bank on March 31, 2007.
2. Gross bank credit data include
bills rediscounted with Reserve Bank, Exim Bank, other financial institutions
and inter-bank participations. | 3.19 Provisional data
on sectoral deployment of credit up to September 28, 2008 indicate that, on a
year-on-year basis, overall credit growth was higher at 26.9 per cent as compared
with 22.2 per cent a year ago. Bank credit growth to agriculture and personal
loans decelerated to 20.6 per cent and 15.3 per cent (23.2 per cent and 18.5 per
cent a year ago), respectively, while credit to industry and services increased
at a higher rate of 33.1 per cent and 32.2 per cent (23.2 per cent and 24.1 per
cent a year ago), respectively. Credit growth to real estate remained high at
45.9 per cent, notwithstanding a sharp deceleration. Priority
Sector Advances
3.20 The Reserve Bank has taken several
initiatives in recent years to enhance the credit flow to the sectors considered
to be constrained by the inadequate credit availability. The priority sector definition
was modified from time to time to take into account the structural changes in
the economy. As per the revised guidelines, the priority sector broadly comprises
agriculture, small enterprises sector, micro credit, education and housing. The
targets and sub-targets for all banks are now linked to the adjusted net bank
credit (ANBC) or credit equivalent amount of off-balance sheet exposures (CEOBSE),
whichever is higher (refer Chapter II).
3.21 The growth in priority
sector lending by banks during 2007-08 decelerated to 16.9 per cent in line with
the deceleration in overall bank credit. Among bank groups, the outstanding priority
sector advances of public sector banks at end-March 2008 increased by 16.8 per
cent as compared with a growth of 27.2 per cent a year ago. Deceleration in priority
sector advances was mainly due to lower growth in lending to agriculture and other
priority sector advances, including micro credit and housing. Advances to micro
and small enterprises sector by PSBs, however, exhibited a significantly higher
growth of 45.0 per cent in 2007-08 as compared with an increase of 24.4 per cent
during 2006-07. Notwithstanding some deceleration, total priority sector advances
by PSBs during 2007-08 as a percentage of their ANBC/CEOBSE improved significantly
to 44.6 per cent as compared with 39.7 per cent in the previous year (Table III.6).
Among the other priority sector advances by PSBs, advances to housing constituted
the largest share (10.8 per cent ANBC/CEOBSE) followed by retail credit (3.0 per
cent of ANBC/CEOBSE), education (1.5 per cent of ANBC/CEOBSE) and micro-credit
(0.2 per cent of ANBC/CEOBSE) (Appendix Table III.4 and III.5). Total priority
sector advances extended by private sector banks during 2007-08 grew by 12.9 per
cent as compared with a rise of 35.6 per cent in the previous year. While advances
to micro and small enterprises sector by private sector banks in 2007-08 increased
by around two and half times, advances to agriculture registered a lower growth
of 10.9 per cent as compared with 41.7 per cent in the previous year. Total priority
sector advances by private sector banks, as on the last reporting Friday of March
2008, constituted 47.5 per cent of ANBC or CEOBSE (Appendix Table
III.6 and III.7).
Table
III.6: Priority Sector Lending by Public | and
Private Sector Banks | (As
on the last reporting Friday of March) | (Amount
in Rs. crore) | Item | Public
Sector | Private
Sector |
| Banks | Banks |
| 2007 | 2008@ | 2007 | 2008@ |
1 | 2 | 3 | 4 | 5 |
Priority Sector Advances | 5,21,376 | 6,08,963 | 1,44,549
1,63,223 | | (39.7) | (44.6) | (42.9) | (47.5) |
of which: | | | | |
Agriculture | 2,02,614 | 2,48,685 | 52,034 | 57,702 |
| (15.4) | (17.4^) | (12.7) | (15.4) |
Micro and Small Enterprises* | 1,02,550 | 1,48,651 | 13,136 | 46,069 |
| (7.8) | (10.9) | (3.9) | (13.4) |
Other Priority Sector# | 2,06,661 | 2,11,627 | 76,919 | 59,452 |
| (15.7) | (15.5) | (22.9) | (17.3) |
@ : Provisional.
*: The revised guidelines on priority sector advances issued on April 30,2007
take into account the revised definition of small and micro enterprises as per
the Micro, Small and Medium Enterprises Development Act, 2006.
# : Includes
retail trade, micro-credit, education and housing.
^ : Indirect agriculture
is reckoned up to 4.5 per cent of ANBC for calculation of percentage.
Note
: Figures in parentheses represent percentages to net bank credit/ANBC/CEOBSE. |
3.22 As on the last reporting Friday of March 2008, lending to the
priority sector by foreign banks constituted 39.5 per cent of their ANBC/CEOBSE
as against the target of 32 per cent. Of this, credit to the micro and small enterprises
(MSE) and export sectors constituted 12.2 per cent and 22.8 per cent, respectively,
of ANBC/CEOBSE (Table III.7 and Appendix Table
III.8).
3.23 At individual bank-level, 12 banks achieved the
overall target of lending to the priority sector and sub-targets of lending to
agriculture and weaker sections. Twenty seven banks (12 public sector banks and
15 private sector banks) achieved the overall target, but did not achieve the
sub-targets. Only two private sector banks did not achieve the overall target
as also the sub-targets (Table III.8; Appendix Table III.5(A),
III.7(A) and III8(A)].
Special Agricultural Credit Plans (SACP)
3.24 With a view to increasing the flow of credit to agriculture, the Reserve
Bank in 1994-95 had advised public sector banks to prepare special agricultural
credit plans (SACP) on an annual basis. Under SACP, banks are required to fix
self-set targets for achievement during the year (April-March). The targets are
generally fixed by the banks showing an increase of about 20-25 per cent over
the disbursements made in the previous year. During 2005-06 and 2006-07, public
sector banks disbursed Rs.94,278 crore and Rs.1,22,443 crore, respectively, surpassing
the targets under the plan. The disbursements under the plan during 2007-08 aggregated
Rs.1,33,226 crore, constituting 87.6 per cent of the target of Rs.1,52,133 crore.
Drought in certain regions, lower investment credit, lower demand for credit in
anticipation of waiver under Debt Waiver Scheme and general moderation of overall
credit growth would have contributed to the shortfall. The SACP mechanism was
also made applicable to private sector banks from 2005-06. The disbursements to
agriculture by private sector banks under SACP during 2006-07 aggregated Rs.44,093
crore, surpassing the target of Rs.40,656 crore by 8.3 per cent. As against the
target of Rs.41,427 crore for 2007-08, disbursements to agriculture by private
sector banks aggregated Rs.47,862 crore, exceeding the target by 15.5 per cent.
Table
III.7: Priority Sector Lending by Foreign Banks |
(As
on the last reporting Friday of March) |
(Amount
in Rs. crore) | Sector | 2006 | 2007 | 2008@ |
| Amount | Percentage | Amount | Percentage | Amount | Percentage |
|
| to
ANBC/ |
| to
ANBC/ |
| to
ANBC/ |
|
| CEOBSE |
| CEOBSE |
| CEOBSE |
1 | 2 | 3 | 4 | 5 | 6 | 7 |
Priority
Sector Advances | 30,439 | 34.4 | 37,831 | 33.4 | 50,301 | 39.5 |
of which: | | | | | | |
| Export
credit | 17,326 | 19.6 | 20,711 | 18.3 | 29,007 | 22.8 |
| Micro
and Small Enterprises* | 8,430 | 9.5 | 11,637 | 10.3 | 15,489 | 12.2 |
@:Provisional.
*:The revised guidelines on priority sector advances issued on April 30, 2007
take into account the revised definition of small and micro enterprises as per
the Micro, Small and Medium Enterprises Development Act, 2006. |
3.25 Public sector banks were advised to earmark 5 per cent of their ANBC to women.
At end-March 2008, aggregate credit to women by public sector banks constituted
6.12 per cent of their ANBC with 24 banks reaching the target. Eight PSBs opened
19 specialised women branches.
Table
III.8: Achievement of Targets under the Priority Sector |
(Number
of banks) | Target/Sub-target | Public | Private | Total |
| Sector | Sector |
|
1 | 2 | 3 | 4 |
1.Overall/Agriculture/Weaker
Sections | 12 | - | 12 |
2. Only Overall | 12 | 15 | 27 |
3. Overall and Agriculture | 3 | 6 | 9 |
4. Overall and Weaker Sections | 3 | - | 3 |
5. Agriculture and Weaker Sections | - | - | - |
6. Only Agriculture | - | - | - |
7. Only Weaker Sections | - | - | - |
8. None | - | 2 | 2 |
- : Nil. | | | |
Micro finance
3.26 The SHG-Bank Linkage Programme
has emerged as a major micro finance programme in the country. It is being implemented
by commercial banks, RRBs and co-operative banks. At end-March 2008, 2.9 million
SHGs were having outstanding bank loans of Rs.12,366 crore. During the year 2007-08,
552,992 new SHGs were provided with bank loans and 186,883 existing SHGs with
repeat loans. Total bank loans disbursed during the year were Rs.4,228 crore,
of which repeat bank loans existing SHGs were Rs.1,686 crore (see Chapter VI for
details).
Credit to Industry
3.27 Growth in
credit to industry (small, medium and large) decelerated marginally to 25.0 per
cent in 2007-08 from 26.7 per cent in the previous year. As credit growth to industry
grew faster than the overall credit growth, the share of outstanding credit to
industry in non-food gross bank credit increased to 39.6 per cent at end-March
2008 from 38.7 per cent at end-March 2007.Infrastructure, which has the largest
share in credit outstanding, also accounted for the largest share of incremental
bank credit to industry in absolute terms, followed by basic metals and metal
products, and textiles. In terms of growth rates, credit to cement and cement
products showed the highest growth rate (51.3 per cent), followed by construction
(41.7 per cent) and infrastructure (41.5 per cent) (Chart III.5
and Appendix Table III.9). Compared to the previous year, credit growth to most
of the sectors decelerated during 2007-08, barring a few sectors including infrastructure,
leather and leather products, chemical and chemical products, and cement and cement
products.
Credit to Micro and Small Enterprises (MSE) Sector
3.28 The total credit provided by public sector banks to the micro and
small enterprises (MSE) as on last reporting Friday of March 2008 was Rs.1,48,651
crore, representing 10.9 per cent of ANBC/CEOBSE and 24.4 per cent of their total
priority sector advances. Within the MSE sector, advances to manufacturing enterprises
and service enterprises were at Rs.1,14,146 crore and Rs.32,094 crore constituting
76.8 per cent and 21.6 per cent, respectively, of the total advances to the small
enterprises sector. The total credit extended by private sector banks to the MSE
sector as on last reporting Friday of March 2008 was Rs.46,069 crore, constituting
13.4 per cent of ANBC/CEOBSE and 28.2 per cent of their total priority sector
advances. Out of these advances, advances to manufacturing enterprises and service
enterprises amounted to Rs.16,526 crore (35.9 per cent of MSE advances) and Rs.29,178
crore (63.3 per cent of SME advances). The total credit provided by foreign banks
to the MSE sector as on last reporting Friday of March 2008 was Rs. 15,489 crore,
representing 12.2 per cent of ANBC/CEOBSE and 30.8 per cent of their total priority
sector advances. 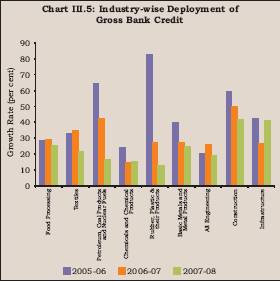
3.29 At end-March 2008, credit extended by scheduled commercial banks to 85,187
sick MSE units was at Rs.13,849 crore. Of these, 4,210 units with their outstanding
bank credit at Rs.247 crore were found to be viable, of which, banks placed 1,262
units, involving an outstanding credit of Rs.127 crore under nursing programmes.
75,829 units with outstanding credit of Rs.13,462 crore were found non-viable.
Credit extended by scheduled commercial banks to 14,754 sick medium enterprises
(MEs) during the year was Rs.1,740 crore. Out of these, 495 MEs with outstanding
bank credit at Rs.328 crore were found to be viable, of which, banks placed 50
MEs, involving an outstanding credit of Rs.185 crore under nursing programmes.
14,226 ME units with outstanding credit of Rs.1,302 crore were found non-viable
.
Credit to Khadi and Village Industries Commission
3.30 A consortium of select public sector banks was formed with the State Bank
of India as the leader of the consortium to provide credit to the Khadi
and Village Industries Commission (KVIC). These loans are provided at 1.5 per
cent below the average prime lending rates of five major banks in the consortium.
At end-September 2008, an amount of Rs.306 crore was outstanding out of Rs.738
crore disbursed by the consortium of banks under the scheme.
Retail
Credit
3.31 Growth in retail credit by banks decelerated further
during 2007-08 to 17.1 per cent from 29.9 per cent in 2006-07 and 40.9 per cent
in 2005-06. It also remained lower than the growth in overall credit by the banking
sector (23.2 per cent). As a result, the share of retail credit in total loans
and advances declined to 24.5 per cent at end-March 2008 from 25.8 per cent at
end-March 2007. Deceleration in the retail portfolio of banks was on account of
decline in credit for consumer durables and deceleration in the growth of auto
loans, housing loans and other personal loans (Table III.9).
The outstanding amount under credit card receivables, however, increased by almost
50 per cent during 2007-08 reflecting the increase in the usage of credit cards
for various payments.
Lending to Sensitive Sectors
3.32 SCBs lending to sensitive sectors (capital market, real estate and
commodities) showed a significant deceleration during 2007-08, though it was marginally
higher than the overall credit growth. Lending to real estate, which constituted
87.4 per cent of total lending to sensitive sectors, showed a significantly lower
growth during 2007-08, partly on account of tightening of prudential norms by
the Reserve Bank. The lending to capital market increased significantly during
2007-08. While exposure to commodities showed a significant growth, it remained
relatively low (Table III.10). The Reserve Bank in its Annual
Policy Statement for 2008-09 had advised banks to exercise caution while extending
advances to traders in agricultural commodities to ensure that bank finance was
not used for hoarding (Box III.1) Overall exposure of SCBs
to sensitive sectors as percentage of aggregate bank loans remained at the previous
year’s level (20.6 per cent) (Appendix Table III.11).
Table
III.9: Retail Portfolio of Banks |
(Amount in
Rs. crore) | Item | Outstanding
as at end-March | Percentage
Variation |
| 2007 | 2008 | 2006-07 | 2007-08 |
1 | 2 | 3 | 4 | 5 |
1. | Housing
Loans | 2,24,481 | 2,52,932 | 25.4 | 12.7 |
2. | Consumer
Durables | 7,296 | 4,802 | 63.3 | -34.2 |
3. | Credit
Card Receivables | 18,317 | 27,437 | 47.3 | 49.8 |
4. | Auto
Loans | 82,562 | 87,998 | 34.5 | 6.6 |
5. | Other
Personal Loans | 1,55,204 | 1,97,879 | 31.1 | 27.5 |
Total Retail Loans
(1 to 5) | 4,87,860 | 5,71,048 | 29.9 | 17.1 |
| | (25.8) | (24.5) | | |
Total Loans and Advances
of SCBs | 18,93,775 | 23,32,490 | 28.5 | 23.2 |
Note: Figures
in parentheses represent percentage share in total loans and advances.
Source:
Off-site Returns (domestic, unaudited and provisional). |
Table
III.10: Lending to the Sensitive Sectors by
Scheduled Commercial
Banks | (As
at end-March) | (Amount
in Rs. crore) | Item | 2007 | 2008 |
| Amount | Per
cent to Total | Amount | Per
cent to
Total | 1 | 2 | 3 | 4 | 5 |
1. Capital Market | 35,106 | 8.6 | 62,998 | 12.3 |
| (57.4) | | (79.5) | |
2. Real Estate Market | 3,72,874 | 91.2 | 4,46,758 | 87.4 |
| (42.3) | | (19.8) | |
3. Commodities | 862 | 0.2 | 1,237 | 0.2 |
| (-39.0) | | (43.5) | |
Total (1+2+3) | 4,08,842 | 100.0 | 5,10,994 | 100.0 |
-: negligible. | (43.1) | | (25.0) | |
Note: Figures in parentheses
are percentage variations over the previous year. | 3.33
Bank group-wise pattern of lending to sensitive sectors indicates that new private
sector banks had the largest exposure to sensitive sectors in 2007-08 in terms
of their share in total loans and advances, mainly on account of higher lending
to the real estate sector, followed by foreign banks, old private sector banks
and public sector banks (Table III.11 and Appendix
Table III.11).
Investments
3.34
Investments by banks recorded a high growth of 23.7 per cent in 2007-08 as compared
with 9.7 per cent in 2006-07 and a decline of 0.4 per cent in 2005-06 (Table
III.12). This broadly reflected the pattern of banks’ investment in
SLR securities, which constitute the bulk of their investments. In relation to
total assets of SCBs, the share of Government securities declined marginally to
21.4 per cent (27.8 per cent of NDTL) during 2007-08 from 21.8 per cent (27.9
per cent of NDTL) in the previous year whereas that of non-approved securities
increased from 5.3 per cent as at end-March 2007 to 5.5 per cent as at end-March
2008 (Table III.1).
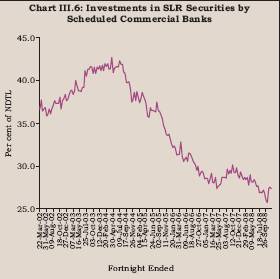
3.35 Although the banking
sector held excess SLR investment at Rs.98,033 crore (above the then prescribed
minimum requirement of 25.0 per cent) at end-March 2008, several banks were operating
their statutory liquidity ratio portfolio very close to the prescribed minimum
level. The prescribed SLR which was 25.0 per cent of NDTL since October 1997 was
revised to 24.0 per cent of NDTL with effect from November 8, 2008. Excess SLR
investments of SCBs increased to Rs.1,30,736 crore on November 21, 2008 (including
the collateral securities received by banks from the RBI under LAF reverse repo).
SLR investments in relation to NDTL declined to 26.9 per cent (Chart
III.6).
Non-SLR investments
3.36 Banks’
investments in non-SLR securities (i.e., bonds/debentures/shares and
commercial papers) increased by 14.3 per cent (Rs.11,961 crore) during 2007-08
as compared with a decline of 5.1 per cent (Rs.4,081 crore) in the previous year.
While investments in bonds/debentures declined, those in shares (mutual funds
in particular) and commercial paper increased (Table III.13).
The total flow of funds from SCBs to the commercial sector comprising credit and
non-SLR investments increased by 22.6 per cent (Rs.4,44,807 crore) in 2007-08
as compared with 27.3 per cent (Rs.4,22,363 crore) in the previous year. Box
III.1: Exposure of Banks to the Commodity Sector The turnover in
the commodity futures market has shown a significant growth in recent years. Along
with the trading volumes, banking sector exposure to commodity market had also
shown a noticeable growth. In view of the public policy concerns in regard to
trading in food items, the Reserve Bank in the Annual Policy Statement for the
year 2008-09 advised the banks to review their advances to traders in agricultural
commodities including rice, wheat, oilseeds and pulses as also advances against
warehouse receipts. Banks were further advised to exercise caution while extending
such advances to ensure that bank finance was not used for hoarding. The first
such review was required to be completed by May 15, 2008 and forwarded to the
Reserve Bank for carrying out supervisory review.
Accordingly, banks
had carried out review of their exposure to agricultural commodities as on March
31, 2008. The data submitted by banks revealed that the advances to traders in
agricultural commodities including advances against warehouse receipts as on March
31, 2008 constituted less than one per cent of their gross advances. Banks have
confirmed that they are exercising due caution while extending advances to agricultural
commodities so as to ensure that bank finance is not used for hoarding. Another
review carried out with reference to the position as on June 30, 2008 revealed
no significant change in such exposure of banks.
Table
III.11: Lending to the Sensitive Sectors - Bank Group-wise* |
(As
at end-March) | (Per
cent) | Sector/Bank
Group | Public
Sector Banks | New
Private Sector Banks | Old
Private Sector Banks | Foreign
Sector Banks |
| 2007 | 2008 | 2007 | 2008 | 2007 | 2008 | 2007 | 2008 |
1 | 2 | 3 | 4 | 5 | 6 | 7 | 8 | 9 |
Capital Market# | 1.4 | 1.8 | 2.8 | 5.6 | 1.8 | 2.0 | 3.0 | 3.3 |
Real Estate Market@ | 15.3 | 15.3 | 32.3 | 28.5 | 16.8 | 16.5 | 26.5 | 23.1 |
Commodities | 0.0 | 0.0 | 0.0 | 0.0 | 0.5 | 0.4 | 0.0 | 0.1 |
Total Advances to Sensitive Sectors | 16.7 | 17.2 | 35.1 | 34.1 | 19.1 | 18.9 | 29.5 | 26.4 |
*: Advances to the sensitive
sector as percentage to total loans and advances of the concerned bank group.
#: Exposure to the capital market is inclusive of both investments and advances.
@: Exposure to real estate sector is inclusive of both direct and indirect lending. |
3.37 In terms of instruments, bank’s investments in bonds and
debentures declined in recent years, while it increased in shares, commercial
papers and units of mutual funds (Table III.14).
International Assets of Banks
3.38 Prevailing macroeconomic
and financial market conditions globally have influenced international assets
position of banks in India. Overall, there was a deceleration in international
assets due to decline in ‘nostro balances’, holding of debt securities
and other assets. Banks reduced their ‘nostro balances’ in 2007-08
partly on account of increase in domestic deposit rates. Banks' foreign currency
loans to residents recorded a substantially higher growth during 2007-08. As a
result, the share of foreign currency loans to residents in total international
assets of SCBs increased to 48.7 per cent as at end-March 2008 from 37.0 per cent
at end-March 2007. The share of outstanding export bills held by banks (drawn
by residents on non-residents) also increased significantly between end-March
2007 and end-March 2008 (Table III.15).
Table
III.12: Growth in Investments and Deposits of SCBs |
(Per cent) |
Year | SLR | SLR | Total | Deposits | Loans |
| Invest- | Invest- | Invest- |
|
|
| ments | ments | ments |
|
|
| as
per cent |
|
|
|
|
| of
NDTL
(end-March) |
|
|
|
|
1 | 2 | 3 | 4 | 5 | 6 |
2002-03 | 38.8 | 24.9 | 17.9 | 12.7 | 14.5 |
2003-04 | 41.3 | 23.8 | 15.8 | 16.2 | 16.8 |
2004-05 | 38.2 | 9.1 | 8.3 | 16.6 | 33.3 |
2005-06 | 31.3 | -2.9 | -0.4 | 17.8 | 31.8 |
2006-07 | 27.9 | 10.3 | 9.7 | 24.6 | 30.6 |
2007-08 | 27.8 | 22.8 | 23.7 | 23.1 | 25.0 |
Table
III.13: Non-SLR Investments of Scheduled Commercial Banks |
(Amount
in Rs. crore) | Instrument | As
on March | Per
cent | As
on March | Per
cent | As
on | Per
cent | As
on | Per
cent |
| 30,
2007 | to
Total | 28,2008 | to
Total | Oct.
12, 2007 | to
Total | Oct.
10, 2008 | to
Total | 1 | 2 | 3 | 4 | 5 | 6 | 7 | 8 | 9 |
1. | Commercial
Paper | 8,978 | 9.0 | 13,045 | 11.4 | 6,582 | 4.7 | 10,640 | 10.5 |
2. | Investment
in shares | 18,352 | 19.3 | 26,410 | 23.1 | 20,350 | 14.3 | 27,691 | 27.7 |
| of
which: | | | | | | | | |
| a) | Public
sector | | | | | | | | |
| | undertakings | 2,127 | 2.2 | 3,023 | 2.6 | 1,485 | 1.4 | 3,405 | 3.4 |
| b) | Private
corporate sector | 16,225 | 17.0 | 23,387 | 20.5 | 18,364 | 13.0 | 24,364 | 24.3 |
3. | Investment
in | | | | | | | | |
| bonds/debentures | 56,215 | 59.0 | 56,051 | 49.1 | 49,353 | 35.7 | 52,741 | 52.6 |
| of
which: | | | | | | | | |
| a) | Public
sector | | | | | | | | |
| | undertakings | 28,595 | 30.0 | 27,382 | 24.0 | 24,867 | 17.5 | 23,661 | 21.8 |
| b) | Private
corporate sector | 27,620 | 29.0 | 28,669 | 25.1 | 24,666 | 17.5 | 29,080 | 29.0 |
4. | Units
of MFs | 11,659 | 12.3 | 18,692 | 16.4 | 64,628 | 45.8 | 9,124 | 9.1 |
Total Non-SLR Investment | | | | | | | | |
(1+2+3+4) | 95,204 | 100.0 | 1,14,198 | 100.0 | 1,25,399 | 100.0 | 1,00,244 | 100.0 |
Source: Section
42(2) returns submitted by SCBs. | 3.39 The consolidated
international claims of banks, based on immediate country risk, showed a lower
growth of 13.5 per cent during 2007-08 as compared with 61.0 per cent during 2006-07.
The share of short-term claims (with residual maturity less than one year) in
the consolidated international claims declined during 2007-08, with corresponding
increase in long-term claims.
3.40 Sector-wise disaggregation of
consolidated international claims of banks indicated a decline in the share of
banks (36.8 per cent at end-March 2008 from 46.8 per cent at end-March 2007).
The share of ‘non-bank private’ showed a corresponding increase of
10 percentage points during 2007-08 (Table III.16). 3.41
The country-wise consolidated international claims of banks, based on immediate
country risk, showed some variations during 2007-08. Continuing the recent trend,
the shares of claims on the US and the UK in total consolidated international
claims declined, while those on Singapore and Germany increased. The claims on
the US, the UK, Singapore, Germany and Hong Kong collectively accounted for over
50 per cent of total international claims (Table III.17).
Developments during 2008-09
3.42 During 2008-09
so far (up to October 24, 2008), aggregate deposits of SCBs increased by 21.0
per cent, year-on-year, as compared with 25.9 per cent a year ago. While demand
deposits increased by 15.1 per cent (14.8 per cent a year ago), time deposits
increased by 22.0 per cent (28.0 per cent a year ago). Non-food credit growth
accelerated to 28.9 per cent, year-on-year, from 23.1 per cent a year ago. In
view of the increased demand for credit, banks reduced their incremental investments
in Government and other approved securities. As on October 24, 2008, the investments
in Government and other approved securities showed a lower growth of 11.1 per
cent, year-on-year, as compared with 25.0 per cent a year ago.
Table
III.14: Composition of Non-SLR Investments |
(Per
cent) | Instrument | 2001-02 | 2002-03 | 2003-04 | 2004-05 | 2005-06 | 2006-07 | 2007-08 | up
to | up
to |
|
|
|
|
|
|
|
| Oct
26, | Oct
24, |
|
|
|
|
|
|
|
| 2007 | 2008 |
1 | 2 | 3 | 4 | 5 | 6 | 7 | 8 | 9 | 10 |
Commercial Paper | 7.2 | 3.1 | 2.7 | 2.7 | 5.4 | 9.4 | 11.4 | 4.6 | 14.3 |
Bonds/debentures | 81.7 | 84.2 | 81.5 | 79.2 | 68.9 | 59.0 | 49.1 | 34.2 | 47.5 |
Shares | 6.6 | 7.9 | 7.3 | 9.4 | 14.2 | 19.3 | 23.1 | 13.9 | 25.7 |
Units of Mutual Funds | 4.5 | 4.9 | 8.5 | 8.7 | 11.5 | 12.2 | 16.4 | 47.3 | 12.5 |
Source : Section
42(2) returns submitted by SCBs. |
Table
III.15: International Assets of Banks - By Type |
(Amount
in Rs. crore) | Asset | 2006 | 2007 | 2008 |
1 | 2 | 3 | 4 |
International Assets
(1+2+3) | 1,58,201 | 2,02,973 | 2,22,711 |
1. | Loans
and Deposits | 1,46,014 | 1,90,888 | 2,12,126 |
| | | (92.3) | (94.0) | (95.2) |
| of
which : | | | |
| a) | Loans
to Non-Residents* | 6,270 | 7,122 | 8,565 |
| | | (4.0) | (3.5) | (3.8) |
| b) | Foreign
Currency Loans to Residents ** | 63,231 | 75,000 | 108,440 |
| | | (40.0) | (37.0) | (48.7) |
| c) | Outstanding
Export Bills
drawn on Non-Residents | | | |
| | by
Residents | 31,556 | 40,846 | 49,011 |
| | | (19.9) | (20.1) | (22.0) |
| d) | Nostro
Balances@ | 44,515 | 67,487 | 45,752 |
| | | (28.1) | (33.2) | (20.5) |
2. | Holdings
of Debt Securities | 2,079 | 1,761 | 334 |
| | | (1.3) | (0.9) | (0.1) |
3. | Other
Assets @@ | 10,109 | 10,324 | 10,250 |
| | | (6.4) | (5.1) | (4.6) |
*: Includes
rupee loans and foreign currency (FC) loans out of non-residents (NR) deposits.
**: Includes loans out of FCNR (B) deposits, PCFC's, FC lending to and FC deposits
with banks in India.
@: Includes placements made abroad and balances in
term deposits with non-resident banks.
@@:Capital supplied to and receivable
profits from foreign branches/subsidiaries of Indian banks and other unclassified
international assets.
Note :Figures in parentheses are
percentages to total.
Source : Locational Banking Statistics. |
Table
III.16: Classification of Consolidated International Claims of Banks - By Maturity
and Sector | (As
at end-March) | (Amount
in Rs. crore) | Residual
Maturity/Sector | 2006 | 2007 | 2008 |
1 | 2 | 3 | 4 |
Total Consolidated
International Claims | 92,711 | 1,49,258 | 1,69,481 |
a) | Maturity-wise | | | |
| 1) | Short-term
(residual maturity less than one year) | 73,176 | 1,09,481 | 1,17,279 |
| | | (78.9) | (73.4) | (69.2) |
| 2) | Long-term
(residual maturity of one year and above) | 18,627 | 39,775 | 50,232 |
| | | (20.1) | (26.6) | (29.6) |
| 3) | Unallocated | 907 | 2 | 1,970 |
| | | (1.0) | (0.0) | (1.2) |
b) | Sector-wise | | | |
| 1) | Bank | 43,050 | 69,781 | 62,394 |
| | | (46.4) | (46.8) | (36.8) |
| 2) | Non-Bank
Public | 1,248 | 871 | 748 |
| | | (1.3) | (0.6) | (0.4) |
| 3) | Non-Bank
Private | 48,413 | 78,607 | 106,339 |
| | | (52.2) | (52.7) | (62.7) |
Notes
:1. Figures in parentheses are percentages to total.
2. Unallocated
residual maturity comprises maturity not applicable (e.g.,for equities)
and maturity information not available from reporting bank branches.
3.
Bank sector includes official monetary institutions (e.g., IFC, ECB,
etc.) and central banks.
4. Prior to the quarter ended March 2005,
non-bank public sector comprised of companies/ institutions other than banks in
which shareholding of state/central governments was at least 51 per cent, including
state/central governments and their departments. From March 2005 quarter, 'Non-bank
public' sector comprises only state/central governments and their departments
and, accordingly, all other entities excluding banks are classified under 'Non-bank
private' sector.
Source : Consolidated Banking Statistics
- Immediate Country Risk Basis. |
Table
III.17: Consolidated International Claims
of Banks on Countries
other than India | (As
at end-March) | (Amount
in Rs. crore) | Item | 2006 | 2007 | 2008 |
1 | 2 | 3 | 4 |
Total Consolidated | | | |
International Claims | 92,711 | 1,49,258 | 1,69,481 |
of which: | | | |
a) | United
States of America | 23,176 | 32,875 | 35,374 |
| | (25.0) | (22.0) | (20.9) |
b) | United
Kingdom | 14,212 | 22,598 | 21,899 |
| | (15.3) | (15.1) | (12.9) |
c) | Singapore
| 4,182 | 8,921 | 11,918 |
| | (4.5) | (6.0) | (7.0) |
d) | Germany
| 4,678 | 7,234 | 10,607 |
| | (5.0) | (4.8) | (6.3) |
e) | Hong
Kong | 6,652 | 8,977 | 9,792 |
| | (7.2) | (6.0) | (5.8) |
f) | United
Arab Emirates | 4,059 | 6,686 | 7,990 |
| | (4.4) | (4.5) | (4.7) |
Note:Figures
in the parentheses are percentage shares in
total international claims.
Source :Consolidated Banking Statistics - Immediate Country Risk
Basis. | Quarterly Trends–Commercial Banking
Survey3
3.43 A quarterly analysis of developments in scheduled
commercial banks revealed several features during 2007-08 (Table
III.18). Mobilisation of deposits by banks across all the quarters was higher
than that during 2006-07. On the other hand, credit expansion, which was lower
in the first two quarters, picked up during the third and fourth quarters of 2007-08.
Banks’ investments in other approved securities declined in all the quarters
of the year. 3.44 During Q1 of 2007-08, notwithstanding a decline in demand
deposits, aggregate deposits of SCBs increased. The decline in demand deposits
mainly reflected the unwinding of large accretion during the previous quarter.
Time deposits, however, increased sharply reflecting attractive interest rates
on bank deposits. However, during the quarter, bank credit declined, while credit
to government increased sharply. Banks also liquidated foreign currency assets.
3.45 In Q2 of 2007-08, bank credit picked up, but net accretion to deposits
remained higher than the expansion of credit to the commercial sector, thus, accommodating
an increase in credit to government as well. Higher growth in deposits was largely
led by increase in time deposits. Banks increased their overseas borrowings and
also reduced their investments in foreign currency assets.
3.46 In
Q3 of 2007-08, accretion to aggregate deposits and credit offtake declined sharply.
The outstanding demand deposits declined and time deposits increased at a much
lower rate. Credit to the commercial sector was higher than the fresh accretions
in aggregate deposits. To meet the increased credit offtake, banks slowed down
their investments in government securities. Furthermore, the SCBs increased their
overseas foreign currency borrowings and liquidated their foreign currency assets.
3.47 During Q4 of 2007-08, both aggregate deposits and credit to the commercial
sector increased sharply. Accretion to deposits was higher than the expansion
in credit to the commercial sector. Higher growth in deposits was led by time
deposits, while demand deposits after remaining subdued for most part of 2007-08
recorded robust expansion particularly in January and February 2008, when there
was also increased volatility in the equity market. Commercial banks increased
their overseas foreign currency borrowings, while reducing their investment in
foreign currency assets. The movements in bank reserves during the fourth quarter
as also for the year as a whole, reflected, apart from movements in deposits,
the increase in the cash reserve ratio (CRR).
Table
III.18: Operations of Scheduled Commercial Banks |
(Amount
in Rs. crore) | Item | Outstanding
as on | Variation |
| March
28, 2008 | 2006-07 | 2007-08 | 2008-09 |
|
| Q1 | Q2 | Q3 | Q4 | Q1 | Q2 | Q3 | Q4 | Q1 | Q2 |
1 | 2 | 3 | 4 | 5 | 6 | 7 | 8 | 9 | 10 | 11 | 12 |
Components | | | | | | | | | | | |
1. | Aggregate
Deposits | | | | | | | | | | | |
| of
Residents (a+b) | 31,40,004 | 30,677 | 1,66,396 | 31,469 | 2,66,158 | 58,993 | 2,08,191 | 67,544 | 2,60,803 | 53,155 | 1,86,384 |
| a. | Demand
Deposits | 5,24,310 | -41,272 | 43,300 | -8,905 | 71,967 | -41,898 | 57,771 | -7,894 | 86,600 | -77,630 | 49,993 |
| b. | Time
Deposits of | | | | | | | | | | | |
| | Residents | 26,15,695 | 71,949 | 1,23,096 | 40,374 | 1,94,190 | 1,00,890 | 1,50,420 | 75,439 | 1,74,204 | 1,30,785 | 1,36,391 |
2. | Call/Term
Funding from | | | | | | | | | | | |
| Financial
Institutions | 1,06,504 | 3,118 | -1,576 | -4,468 | 5,618 | -2,984 | 5,756 | 7,441 | 10,455 | -1,116 | 4,506 |
Sources | | | | | | | | | | | |
1. | Credit
to the Government | 9,58,661 | 23,238 | 10,723 | 602 | 40,753 | 50,067 | 68,965 | 27,436 | 36,136 | 33,245 | -23,374 |
2. | Credit
to the Commercial | | | | | | | | | | | |
| Sector
(a to d) | 25,49,097 | 22,606 | 1,41,465 | 64,777 | 1,97,555 | -13,527 | 1,34,775 | 94,969 | 2,42,980 | 40,471 | 1,27,214 |
| a. | Bank
Credit | 23,61,914 | 14,050 | 1,40,364 | 74,213 | 1,95,485 | -36,348 | 1,42,638 | 87,012 | 2,37,422 | 31,325 | 1,49,229 |
| | i.
Food Credit | 44,399 | 607 | -7,840 | 8,171 | 4,891 | -2,564 | -6,948 | 3,259 | 4,131 | 5,478 | 1,11,865 |
| | ii.
Non-food Credit | 23,17,515 | 13,443 | 1,48,204 | 66,042 | 1,90,593 | -33,784 | 1,49,586 | 83,752 | 2,33,291 | 25,557 | 37,364 |
| b. | Net
Credit to Primary | | | | | | | | | | | |
| | Dealers | 3,521 | -1,963 | 3,988 | -2,783 | -812 | -282 | 780 | 1,370 | -1,146 | -797 | -1,500 |
| c. | Investments
in Other | | | | | | | | | | | |
| | Approved
Securities | 13,053 | 526 | -1,132 | -352 | -297 | -384 | -1,010 | -654 | -357 | -194 | 5,848 |
| d. | Other
Investments | | | | | | | | | | | |
| | (in
non-SLR Securities) | 1,70,609 | 9,993 | -1,756 | -6,301 | 3,178 | 23,487 | -7,634 | 7,241 | 7,061 | 10.136 | -26,363 |
3. | Net
Foreign Currency | | | | | | | | | | | |
| Assets
of Commercial | | | | | | | | | | | |
| Banks
(a-b-c) | -70,196 | -21,137 | 10,844 | 13,322 | 1,974 | 2,817 | -16,584 | 974 | -16,793 | -19,924 | -4,481 |
| a. | Foreign
Currency | | | | | | | | | | | |
| | Assets | 31,189 | -13,919 | 8,830 | 11,781 | 8,567 | -8,312 | -9,934 | -781 | -8,537 | -8,383 | 3,044 |
| b. | Non-resident
Foreign | | | | | | | | | | | |
| | Currency
Repatriable | | | | | | | | | | | |
| | Fixed
Deposits | 56,935 | 3,917 | 1,671 | 1,233 | 1,364 | -4,202 | -1,181 | -3,490 | -1,653 | 2,048 | 3,611 |
| c. | Overseas
Foreign | | | | | | | | | | | |
| | Currency
Borrowings | 44,451 | 3,301 | -3,685 | -2,774 | 5,229 | -6,928 | 7,830 | 1,734 | 9,909 | 9,494 | 3,914 |
4. | Net
Bank Reserves | 2,71,166 | -6,090 | 20,381 | -15,423 | 52,629 | 6,468 | 76,009 | -22,695 | 21,268 | 28,526 | 35,163 |
5. | Capital
Account | 2,72,622 | 12,025 | 6,168 | 2,250 | 4,630 | 26,813 | 24,184 | 6,887 | 11,937 | 47,618 | 1,479 |
Note : Data
relate to last reporting Friday of each quarter. | 3.48
During Q1 of 2008-09, accretion to aggregate deposits was lower than in the previous
year while demand deposits registered a negative growth. Bank credit, however,
remained strong compared with its first quarter performance in last year. Credit
to government also remained strong. In order to finance the increased activity,
banks resorted to drawdown of foreign currency assets and substantial recourse
to overseas borrowings. 3.49 In the Q2 of 2008-09, accretion to aggregate
deposits increased sharply led by both demand and time deposits. Increase in aggregate
deposits, however, remained lower than the Q2 of last year. Bank credit also increased
sharply. Banks reduced their investment in government securities and also in non-SLR
securities. During the quarter, commercial banks reduced their investment in foreign
currency assets and also overseas foreign currency borrowings. Credit-Deposit
Ratio
3.50 The credit-deposit ratio (CDR) and the investment-deposit
ratio (IDR) of SCBs reflected the trend in the credit and deposit growth rates.
On account of the strong credit growth during the previous three years (2004-05
to 2006-07), investment by banks showed a significantly lower average growth of
about 6 per cent. In fact, banks liquidated some investments in 2005-06 leading
to a sharp decline in incremental IDR. During 2007-08, however, with the moderation
in credit growth and strong growth in deposits, the incremental credit-deposit
ratio, as on March 28, 2008, declined to 73.6 per cent as compared with 84.3 per
cent as on March 30, 2007. Incremental IDR, on the other hand, increased sharply
to 30.8 per cent as on March 28, 2008 from 14.7 per cent as on March 30, 2007.
The intra-year movement in the incremental CDR and IDR indicates that the gap
between the two ratios, which narrowed during the last quarter of 2007, widened
again after February 2008 (Chart III.7). 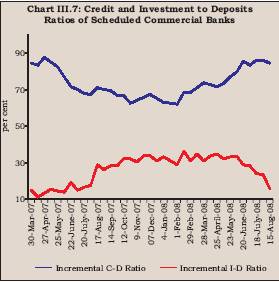
3.51
The CDR and IDR, based on the outstanding amount, which moved more or less in
the same direction between 1999 and the third quarter of 2004-05, tended to move
in the opposite directions thereafter. This pattern continued in 2007-08 as the
CDR increased further to reach an all-time high level of 74.6 per cent at end-March
2008. The IDR, on the other hand, which had declined to a low of 30.3 per cent
as at end-March 2007, increased to 35.4 per cent at end-March 2008 (Chart
III.8).
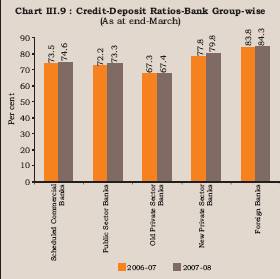
3.52 Among bank-groups, the CDR (in terms of outstanding
amount) of foreign banks was the highest at end-March 2008, followed by new private
sector banks, public sector banks and old private sector banks (Chart
III.9).
3.53 At individual bank level, the CDR at end-March 2008
showed significant variations, particularly in the case of foreign banks. The
CDR of public sector banks ranged between 59.3 per cent (United Bank of India)
and 71.6 per cent (State Bank of Travancore), barring IDBI Bank Ltd. whose CDR
was 112.6 per cent. In the case of old private sector banks, the CDR ranged between
53.2 per cent (Ratnakar Bank) and 75.1 per cent (Karur Vysya Bank). The CDR of
new private sector banks ranged between 62.9 per cent (HDFC Bank) and 94.7 per
cent (Kotak Mahindra Bank). In the case of foreign banks, the CDR ranged between
a low of 0.8 per cent (Oman International Bank) to a high of 597.8 per cent (Antwerp
Diamond Bank). Of the 28 foreign banks, the CDR of as many as 10 banks was over
100 per cent (Appendix Table III.13). 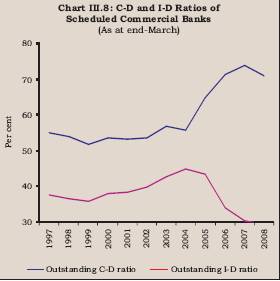
Maturity
Profile of Assets and Liabilities of Banks
3.54 The maturity
structure of commercial banks’ assets and liabilities at end-March 2008
remained broadly the same as in the previous year, barring minor variations (Table
III.19). The share of deposits of up to one year maturity of all bank groups
(barring new private sector banks) increased moderately, while that of other maturity
buckets (1-3 years and 3-5 years) declined (except foreign banks whose share of
deposits maturing between 3-5 years remained unchanged). The share of borrowings
up to one year maturity increased across all bank groups (barring
Table
III.19: Bank Group-wise Maturity Profile of Select Liabilities /Assets
| (As
at end -March) | (Per
cent to Total) | Assets/Liabilities | Public
Sector | Old
Private | New
Private | Foreign |
|
|
| Banks | Sector
Banks | Sector
Banks | Banks |
|
|
| 2007 | 2008 | 2007 | 2008 | 2007 | 2008 | 2007 | 2008 |
1 |
|
| 2 | 3 | 4 | 5 | 6 | 7 | 8 | 9 |
I. | Deposits | | | | | | | | |
| a) | Up
to 1 year | 42.4 | 44.1 | 47.0 | 50.9 | 60.4 | 57.1 | 64.0 | 64.7 |
| b) | Over
1 year and up to 3 years | 29.0 | 26.5 | 39.0 | 35.5 | 35.5 | 34.3 | 35.6 | 33.3 |
| c) | Over
3 years and up to 5 years | 11.2 | 10.3 | 7.8 | 7.7 | 2.6 | 2.5 | 0.4 | 0.4 |
| d) | Over
5 years | 17.5 | 19.1 | 6.1 | 6.0 | 1.5 | 6.0 | 0.0 | 1.6 |
II. | Borrowings | | | | | | | | |
| a) | Up
to 1 year | 52.7 | 69.6 | 76.3 | 79.1 | 50.4 | 48.9 | 88.7 | 90.9 |
| b) | Over
1 year and up to 3 years | 19.3 | 16.5 | 8.3 | 5.4 | 26.7 | 25.6 | 11.2 | 8.4 |
| c) | Over
3 years and up to 5 years | 13.5 | 6.0 | 1.7 | 3.0 | 19.9 | 22.0 | 0.1 | 0.3 |
| d) | Over
5 years | 14.5 | 7.9 | 13.7 | 12.5 | 3.0 | 3.5 | 0.0 | 0.3 |
III. | Loans
and Advances | | | | | | | | |
| a) | Up
to 1 year | 36.8 | 38.0 | 40.0 | 40.4 | 30.4 | 33.6 | 52.2 | 49.6 |
| b) | Over
1 year and up to 3 years | 33.1 | 33.3 | 37.2 | 36.1 | 39.9 | 34.3 | 31.2 | 34.4 |
| c) | Over
3 years and up to 5 years | 12.6 | 11.2 | 11.0 | 11.5 | 12.0 | 12.2 | 6.1 | 6.6 |
| d) | Over
5 years | 17.5 | 17.6 | 11.9 | 12.0 | 17.6 | 20.0 | 10.5 | 9.4 |
IV. | Investment | | | | | | | | |
| a) | Up
to 1 year | 13.6 | 19.0 | 20.4 | 21.3 | 51.1 | 55.8 | 52.2 | 62.2 |
| b) | Over
1 year and up to 3 years | 14.6 | 19.0 | 11.5 | 16.5 | 25.0 | 21.1 | 29.7 | 25.9 |
| c) | Over
3 years and up to 5 years | 15.1 | 13.8 | 9.9 | 12.2 | 7.6 | 5.4 | 11.2 | 4.1 |
| d) | Over
5 years | 56.6 | 48.2 | 58.2 | 50.0 | 16.3 | 17.6 | 6.9 | 7.8 |
|
 IST,
IST,


