|
Introduction
3.1 Robust macroeconomic performance continued to underpin the business and financial performance of scheduled commercial banks (SCBs)1 during 2006-07. The operations of SCBs were marked by a large expansion of credit for the third year in succession, albeit with some moderation. A noteworthy development of credit growth was the increased flow of credit to the SSI sector. Credit to the retail sector, particularly housing and commercial real estate, slowed down significantly. On the liability side, deposit growth accelerated mainly on account of sharp increase in term deposits. This enabled banks to comfortably finance the strong credit demand. In contrast to the previous year, banks’ investment in Government securities increased during the year. However, as percentage of both total assets and net demand and time liabilities (NDTL), investment by banks in Government securities continued to decline. Net profits of SCBs increased sharply, underpinned by the sharp increase in net interest income due to strong growth in credit volumes and containment of operating expenses. The asset quality of SCBs improved further during 2006-07 as reflected in the decline in gross and net non-performing assets as a percentage of loans and advances. The capital to risk-weighted assets ratio of the banking sector remained at the previous year’s level, despite sharp increase in risk-weighted assets.
3.2 This Chapter profiles the operations and financial performance of SCBs at the aggregate as well as bank group levels. The Chapter is organised into eleven Sections. Section 2 analyses the balance sheets of SCBs on an aggregate basis, while Section 3 outlines their off-balance sheet operations. Financial performance of SCBs is analysed in Section 4. Section 5 details the trends in soundness indicators. Operations of SCBs in the capital market are delineated in Section 6, while technological developments in the banking sector during the year are covered in Section 7. Regional spread of banking is set out in Section 8. Section 9 presents the update on customer service and financial inclusion. Apart from the SCBs, there exist 96 regional rural banks (RRBs)2 and four local area banks (LABs). While the performance of SCBs forms the core of this Chapter, the performance of RRBs and LABs is detailed separately in Section 10 and Section 11, respectively.
2. Liabilities and Assets of Scheduled Commercial Banks
3.3 The number of SCBs declined to 82 at end-March 2007 from 85 at end-March 2006 due to merger of three old private sector banks. During 2006-07, Bharat Overseas Bank Ltd. was merged with Indian Overseas Bank on March 31, 2007 in terms of Section 9(2) (c) of the Banking Companies (Acquisition & Transfer of Undertakings) Act, 1970. In view of the deteriorating financial condition of the Ganesh Bank of Kurundwad Ltd., the Central Government, on the recommendations of the Reserve Bank, placed the bank under an Order of Moratorium for a period of three months from the close of business on January 7, 2006. With a subsequent notification, after completion of some legal procedures by the Government on September 1, 2006, Ganesh Bank of Kurundwad Ltd. was amalgamated with Federal Bank Ltd. with effect from September 2, 2006. Similarly, the United Western Bank Ltd. (UWB) was put under an Order of Moratorium under sub-Section (2) of Section 45 of the Banking Regulation Act, 1949. On completion of procedural course, the UWB was amalgamated with Industrial Development Bank of India Ltd. on September 30, 2006. The amalgamation came into force on October 3, 2006.
The names of two banks were changed during 2006-07, i.e., UTI Bank was remained as Axis Bank, while Chohung Bank was renamed as Shinhan Bank. Besides three amalgamations during 2006-07, the Sangli Bank Ltd. was amalgamated with the ICICI Bank Ltd. under Section 44A of the Banking Regulation Act, 1949 effective April 19, 2007.
3.4 The aggregate balance sheet of SCBs expanded by 24.3 per cent during 2006-07 as compared with 18.2 per cent in 2005-06 (Tables III.1 and III.2).
Table III.1: Consolidated Balance Sheet of |
Scheduled Commercial Banks |
(Amount in Rs. crore) |
Item |
As at end-March |
|
2006 |
2007 |
|
Amount |
Per cent
to total |
Amount |
Per cent to
total |
1 |
2 |
3 |
4 |
5 |
Liabilities |
1. |
Capital |
25,206 |
0.9 |
29,559 |
0.9 |
2. |
Reserve and Surplus |
1,57,974 |
5.7 |
1,89,615 |
5.5 |
3. |
Deposits |
21,64,681 |
77.7 |
26,96,980 |
77.9 |
|
3.1. Demand Deposits |
2,92,945 |
10.5 |
3,51,998 |
10.2 |
|
3.2. Saving Bank |
|
|
|
|
|
Deposits |
5,42,874 |
19.5 |
6,31,651 |
18.2 |
|
3.3. Term Deposits |
13,28,861 |
47.7 |
17,13,330 |
49.5 |
4. |
Borrowings |
2,03,147 |
7.3 |
2,42,870 |
7.0 |
5. |
Other Liabilities and |
|
|
|
|
|
Provisions |
2,34,852 |
8.4 |
3,04,381 |
8.8 |
Total Liabilities/Assets |
27,85,863 |
100.0 |
34,63,406 |
100.0 |
Assets |
1. |
Cash and Balances |
|
|
|
|
|
with RBI |
1,44,475 |
5.2 |
1,95,372 |
5.6 |
2. |
Balances with Banks |
|
|
|
|
|
and Money at Call and |
|
|
|
|
|
Short Notice |
1,16,443 |
4.2 |
1,58,413 |
4.6 |
3. |
Investments |
8,66,508 |
31.1 |
9,50,769 |
27.5 |
|
3.1 Government |
|
|
|
|
|
Securities (a+b) |
6,90,421 |
24.8 |
7,54,456 |
21.8 |
|
a. In India |
6,86,464 |
24.6 |
7,50,733 |
21.7 |
|
b. Outside India |
3,957 |
0.1 |
3,723 |
0.1 |
|
3.2 Other Approved |
|
|
|
|
|
Securities |
13,949 |
0.5 |
12,760 |
0.4 |
|
3.3 Non-Approved |
|
|
|
|
|
Securities |
1,62,137 |
5.8 |
1,83,551 |
5.3 |
4. |
Loans and Advances |
15,16,811 |
54.4 |
19,81,216 |
57.2 |
|
4.1 Bills Purchased |
|
|
|
|
|
and Discounted |
1,03,657 |
3.7 |
1,24,424 |
3.6 |
|
4.2 Cash Credits, |
|
|
|
|
|
Overdrafts, etc. |
5,65,001 |
20.3 |
7,12,866 |
20.6 |
|
4.3 Term Loans |
8,48,152 |
30.4 |
11,43,924 |
33.0 |
5. |
Fixed Assets |
25,081 |
0.9 |
31,362 |
0.9 |
6. |
Other Assets |
1,16,542 |
4.2 |
1,46,271 |
4.2 |
Note : Data for 2005-06 are as reported in the balance sheets of banks for 2006-07
and hence may not match with those reported in the
Report on Trend and Progress of Banking in India, 2005 06,
as the figures for 2005-06, were revised by some banks.
Source : Balance sheets of respective banks. |
3.5 The faster growth of the banking system in relation to the real economy resulted in significant increase in the ratio of assets of SCBs to GDP (at factor cost at current prices) to 92.5 per cent at end-March 2007 from 85.7 per cent at end-March 2006. The degree of leverage enjoyed by the banking system as reflected in the equity multiplier (measured as total assets divided by total equity) increased to 15.8 at end-March 2007 from 15.2 at end-March 2006.
3.6 The pattern of liabilities and assets of SCBs underwent some changes during the year. For the third year in succession, loans and advances grew by over 30 per cent (i.e., 30.6 per cent as compared with
31.8 per cent in 2005-06 and 33.2 per cent in 2004-05), underpinned by robust macroeconomic performance. Reversing the trend of the previous two years, the increase in deposits in absolute terms was significantly higher than that in loans and advances, even as the deposit growth at 24.6 per cent was lower than the growth in loans and advances. A part of the surplus funds, therefore, was deployed in Government securities unlike the last year, when banks liquidated investments in Government securities to meet the increased credit demand. Despite incremental investments, the share of Government securities (as also overall investments) in total assets declined significantly, suggesting that the increase in investments did not keep pace with the increase in overall assets [Table III.2 and Appendix Tables III.1 (A) to (C)].
3.7 Among bank groups, the balance sheets of foreign banks and new private sector banks expanded by 39.5 and 38.7 per cent, respectively, taking their combined share in total assets of the banking sector to 24.9 per cent at end-March 2007 from 22.3 per cent at end-March 2006 (Table III.2). The combined balance sheet of public sector banks expanded by 21.1 per cent as compared with 24.3 per cent increase in the balance sheet of the entire banking sector, resulting in a decline in their share to 70.5 per cent at end-March 2007 from 72.3 per cent a year ago. The balance sheet of old private sector banks grew by 7.1 per cent as a result of which their market share declined further to 4.6 per cent at end-March 2007 from 5.4 per cent at end-March 2006 [Appendix Table III.1(A) to (C)]. The changes in the market shares of various bank groups broadly reflected the changes in their shares in deposits (Table III.3).
Table III.2: Growth of Balance Sheet of Scheduled Commercial Banks – Bank Group-wise |
(Per cent) |
Item |
As at end-March |
|
|
|
2006 |
2007 |
|
|
|
Public |
Old |
New |
Foreign |
All |
Public |
Old |
New |
Foreign |
All |
|
|
|
Sector |
Private |
Private |
Banks |
SCBs |
Sector |
Private |
Private |
Banks |
SCBs |
|
|
|
Banks |
Sector |
Sector |
|
|
Banks |
Sector |
Sector |
|
|
|
|
|
|
Banks |
Banks |
|
|
|
Banks |
Banks |
|
|
1 |
|
|
2 |
3 |
4 |
5 |
6 |
7 |
8 |
9 |
10 |
11 |
1. |
Capital |
-20.6 |
25.9 |
14.2 |
27.5 |
-2.7 |
0.7 |
4.4 |
5.6 |
45.4 |
17.3 |
2. |
Reserve and Surplus |
21.7 |
19.5 |
55.2 |
28.5 |
27.7 |
20.0 |
11.6 |
17.4 |
30.6 |
20.0 |
3. |
Deposits |
12.9 |
11.6 |
50.7 |
31.7 |
17.8 |
22.9 |
6.0 |
38.8 |
32.6 |
24.6 |
|
3.1. |
Demand Deposits |
20.8 |
15.7 |
29.3 |
48.8 |
24.9 |
19.3 |
3.9 |
36.7 |
11.8 |
20.2 |
|
3.2. |
Saving Bank Deposits |
19.0 |
20.4 |
60.6 |
21.1 |
22.0 |
15.0 |
6.7 |
33.3 |
16.3 |
16.4 |
|
3.3. |
Term Deposits |
8.9 |
8.9 |
53.9 |
25.4 |
14.7 |
27.3 |
6.1 |
40.6 |
52.3 |
28.9 |
4. |
Borrowings |
23.7 |
22.5 |
11.0 |
24.5 |
20.7 |
5.7 |
22.3 |
42.8 |
32.7 |
19.6 |
5. |
Other Liabilities and Provisions |
12.3 |
13.8 |
34.0 |
31.4 |
17.4 |
16.2 |
16.1 |
51.1 |
88.7 |
29.6 |
Total Liabilities/Assets |
13.6 |
12.4 |
43.2 |
29.8 |
18.3 |
21.1 |
7.1 |
38.7 |
39.5 |
24.3 |
1. |
Cash and Balances with RBI |
25.3 |
-0.3 |
16.1 |
20.0 |
22.4 |
26.1 |
25.9 |
94.3 |
49.8 |
35.2 |
2. |
Balances with Banks and Money |
|
|
|
|
|
|
|
|
|
|
|
at Call and Short Notice |
14.0 |
7.5 |
37.4 |
64.3 |
22.1 |
26.9 |
5.8 |
91.9 |
42.2 |
36.0 |
3. |
Investments |
-7.7 |
1.1 |
41.1 |
22.2 |
-0.4 |
4.9 |
-3.6 |
26.4 |
36.4 |
9.7 |
|
3.1 |
Government Securities (a+b) |
-8.4 |
3.2 |
50.4 |
20.1 |
-1.2 |
3.6 |
-2.2 |
33.0 |
37.5 |
9.3 |
|
|
a. In India |
-8.5 |
3.2 |
50.3 |
20.1 |
-1.3 |
3.6 |
-2.0 |
32.9 |
37.5 |
9.4 |
|
|
b. Outside India |
15.3 |
2.6 |
255.2 |
– |
17.7 |
-8.6 |
-100.0 |
125.0 |
– |
-5.9 |
|
3.2 |
Other Approved Securities |
-13.5 |
-14.4 |
-60.9 |
-60.6 |
-14.4 |
-7.8 |
-30.9 |
-20.7 |
0.2 |
-8.5 |
|
3.3 |
Non-Approved Securities |
-2.8 |
-5.8 |
24.1 |
32.8 |
4.8 |
13.6 |
-7.6 |
11.4 |
32.7 |
13.2 |
4. |
Loans and Advances |
29.5 |
21.7 |
50.2 |
29.5 |
31.8 |
30.2 |
12.0 |
39.9 |
29.5 |
30.6 |
|
4.1 |
Bills Purchased and Discounted |
16.5 |
8.1 |
-10.4 |
27.0 |
12.8 |
22.4 |
-15.4 |
21.8 |
21.3 |
20.0 |
|
4.2 |
Cash Credits, Overdrafts, etc. |
26.9 |
21.4 |
64.2 |
33.7 |
29.3 |
25.7 |
11.6 |
42.0 |
27.7 |
26.2 |
|
4.3 |
Term Loans |
33.5 |
24.3 |
54.4 |
26.6 |
36.4 |
34.5 |
16.5 |
40.7 |
32.8 |
34.9 |
5. |
Fixed Assets |
9.1 |
7.4 |
2.5 |
28.1 |
8.8 |
37.7 |
-5.6 |
4.2 |
24.4 |
25.0 |
6. |
Other Assets |
12.8 |
14.3 |
31.3 |
30.7 |
18.4 |
7.1 |
0.7 |
33.3 |
90.6 |
25.5 |
Source : Balance sheets
of respective banks. |
3.8 Recognising the importance of transparency of financial statements as an important tool for supervision, the Reserve Bank has taken a number of steps to bring the disclosure standards of Indian banks closer to the international best practices (Box III.1).
Table III.3: Major Components of Balance
Sheets of Scheduled Commercial Banks – Bank Group-wise |
(Per cent) |
Bank Group |
Assets |
Deposits |
Advances |
Investments |
|
2006 |
2007 |
2006 |
2007 |
2006 |
2007 |
2006 |
2007 |
1 |
2 |
3 |
4 |
5 |
6 |
7 |
8 |
9 |
Public Sector Banks |
72.3 |
70.5 |
75.0 |
73.9 |
72.9 |
72.7 |
73.1 |
69.9 |
Nationalised Banks |
44.3 |
44.2 |
48.7 |
48.8 |
45.0 |
45.2 |
44.3 |
44.9 |
State Bank Group |
24.8 |
23.3 |
25.1 |
23.5 |
24.5 |
24.3 |
25.9 |
22.3 |
Other Public Sector Bank |
3.2 |
3.0 |
1.2 |
1.6 |
3.5 |
3.2 |
2.9 |
2.7 |
Private Sector Banks |
20.5 |
21.5 |
19.8 |
20.5 |
20.6 |
20.9 |
20.8 |
22.6 |
Old Private Sector Banks |
5.4 |
4.6 |
6.0 |
5.1 |
5.5 |
4.7 |
5.2 |
4.6 |
New Private Sector Banks |
15.1 |
16.9 |
13.8 |
15.3 |
15.2 |
16.2 |
15.6 |
18.0 |
Foreign Banks |
7.2 |
8.0 |
5.3 |
5.6 |
6.4 |
6.4 |
6.0 |
7.5 |
Scheduled Commercial
Banks |
100.0 |
100.0 |
100.0 |
100.0 |
100.0 |
100.0 |
100.0 |
100.0 |
Source: Balance sheets of respective banks. |
Box III.1: Disclosure and Transparency in Banks’ Balance Sheets
Disclosures and transparency in financial statements have become more important, as banks' activities have become more complex and dynamic. Banks are special. Banks are financial intermediaries critical for mobilising savings, deploying the same taking into account safety of funds and decent return to the savers. Banks thus have fiduciary role and responsibility. They are crucial for operation of the payment system. The sustained, stable and continuing operations of banks depend on the public confidence in individual bank and the banking system. Full disclosure of the financial position of banks and financial institutions is considered essential for an objective assessment of the stability of the banking system. The level of transparency of the annual accounts of banks and financial institutions has therefore, received considerable attention from international organisations, rating agencies and other market participants. Effective public disclosure enhances market discipline. Market discipline and improved public scrutiny can provide strong incentives to banks to conduct their business in a safe, sound and efficient manner; to conform to stated business objectives; and to maintain sound risk management practices and internal controls. Market discipline which is achieved through better disclosures have been given due importance under Basel II by recognising it as one of its three Pillars.
In pursuance of the financial sector reforms introduced since 1991, the Reserve Bank has initiated a number of measures for bringing about greater or full disclosure in the published accounts of banks having regard to the need for disclosure, public accountability of banks, maintenance of confidentiality between banker and customer and the requirement of maintaining the reputation of creditworthiness of banks. The Formats of Balance Sheet and Profit and Loss Accounts of banks were amended in 1991 having regard to (i) the need for greater or full disclosure, (ii) expansion of banking operations both area-wise and sector-wise over the period and (iii) the need for improving the presentation of accounts. The thrust of the amendment was to bring the true financial position of banks to pointed focus and to enable the user of financial statements to study and have a meaningful comparison of their positions. Banks were required to disclose the accounting policies regarding key area of operations in one place along with Notes on Accounts in their Financial Statements for the Accounting Year.
In the interest of full and complete disclosure, some very useful information is better provided, or can only be provided, by way of notes to the financial statements. The use of notes and supplementary information provides the means to explain and document certain items, which are either presented in the financial statement or otherwise affect the financial position and performance of the reporting enterprise. The Reserve Bank has recognised the need for improving the disclosure requirements prescribed for banks. Keeping in view factors like computerisation and the level of MIS in banks, development of the market, etc., it has been agreed that the level of transparency needs to be brought on par with international best practices. In line with the above approach, the disclosure standards of banks have gradually been enhanced. In addition to the 16 detailed schedules to their Balance Sheet, banks are required to furnish in the "Notes to Account" details such as:
• Capital Adequacy Ratio; Tier I capital; Tier II capital;
• Percentage of share holding of the Government of India in the nationalised banks;
• Amount of subordinated debt raised as Tier-II capital;
• The gross value of investments separately on investments in India and outside India and the net value of investments in India and outside India;
• Percentage of net NPAs to net advances;
• Provisions made towards depreciation in the value of investments and the movement of such provisions;
• Percentage of net NPAs to net advances. Provisions made towards NPAs and the movement of such provisions;
• Details of loan assets subjected to restructuring; restructuring under CDR; details of financial assets sold to an SC/RC for Asset Reconstruction; details of non-performing asset purchased/sold;
• Details of 'Provisions and Contingencies'; provisions made during the year towards income-tax, standard asset, floating provisions, etc.;
• Disclosures of business ratios such as interest income as a percentage of working funds; operating profit as a percentage to working funds; return on assets; business (deposits plus advances) per employee, and profit per employee;
• Asset Liability Management - maturity pattern of loans and advances; investment securities; deposits; borrowings; and foreign currency assets and liabilities;
• Lending to sensitive sectors, which are sensitive to asset price fluctuations. These should include advances to sectors such as capital market, real estate, etc., and such other sectors to be defined as sensitive by the Reserve Bank from time to time;
• Exposure to country risk;
• Details of single borrower/group borrower limit exceeded by the bank;
• Disclosures relating to repo transactions; non-SLR investment portfolio; forward rate agreement/interest rate swaps; exchange traded interest rate derivatives; and risk exposure in derivatives.
Banks are required to comply with the disclosure norms stipulated under the various Accounting Standards issued by the Institute of Chartered Accountants of India.
Deposits
3.9 Aggregate deposits of scheduled commercial banks during 2006-07 grew by 24.6 per cent as compared with 17.8 per cent last year. While the growth of demand deposits and saving bank deposits slowed down, that of time deposits accelerated. This was in contrast to the trend in the last year when banks’ efforts to raise deposits to fund increased credit demand led to a significant shortening of the maturity profile of deposits, which was reflected in the accelerated growth of demand and saving bank deposits. Several factors contributed to the accelerated growth in term deposits during 2006-07. First, there was a clear shift from postal savings to term deposits of banks due to favourable interest rate differentials and extension of tax benefits to long-term bank deposits. Two, the demand for term deposits also increased from cash-rich private and public sector companies, which on the back of high profitability, parked their surplus funds with banks. Three, non-resident deposits registered a higher growth during 2006-07 as compared with the previous year.
3.10 The sharp growth in the issuance of certificates of deposit (CDs) registered in recent years continued during 2006-07. The amount of CDs outstanding more than doubled from Rs.43,568 crore at end-March 2006 to Rs.93,272 crore by end-March 2007 and further to Rs.1,18,481 crore (September 28, 2007). The CDs outstanding constituted 2.7 per cent of aggregate deposits of SCBs at end-March 2007 as compared with 1.6 per cent a year ago. Increased issuance of CDs during 2006-07 reflected the pressure that banks faced in raising deposits in view of the strong credit offtake. The flexibility of return that can be offered by the cash-strapped banks to attract bulk deposits made CDs the preferred route for mobilising resources. Private sector banks and foreign banks with limited branch network and limited retail customer base continued to be the major issuers of CDs (Appendix Table III.2).
3.11 Bank group-wise, deposits of new private sector banks grew at the highest rate (38.8 per cent), followed by foreign banks (32.6 per cent), public sector banks (22.9 per cent) and old private sector banks (6.0 per cent). Continuing the trend of the last few years, the share of new private sector banks in total deposits increased further during the year, while that of PSBs and old private sector banks declined (Chart III.1).
Non-Deposit Resources
3.12 Resources raised by banks from the capital market in the form of public issues of equity and debt declined sharply to Rs.1,066 crore during 2006-07 from Rs.11,067 crore during 2005-06. However, banks continued to mobilise large funds from the private placement market (Rs.30,994 crore from 90 issues as compared with Rs.30,151 crore from 97 issues in the previous year) (refer Section 6 for details).
International Liabilities of Banks
3.13 The international liabilities of banks grew by 17.6 per cent during 2006-07 as against the increase of 20.2 per cent during 2005-06. The slowdown in the growth of international liabilities was mainly due to decline in foreign currency borrowings and lower growth in NRE deposits. However, FCNR(B) deposits, NRO rupee deposits, own issues of securities and other liabilities consisting mainly of proceeds raised by way of ADRs/GDRs and equities of banks held by nonresidents increased at a higher rate (Table III.4).
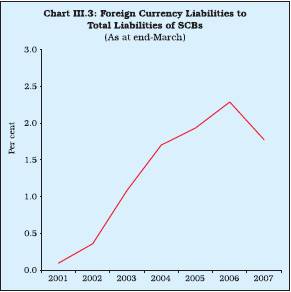
3.14 Reversing the trend of the last few years, the share of foreign currency deposits and borrowings in total international liabilities declined during the year (Chart III.2).
Table III.4: International Liabilities of Banks – By Type |
(Amount in Rs. crore) |
Item |
As at end-March |
|
2005 |
2006 |
2007 |
1 |
2 |
3 |
4 |
1. |
Deposits and Loans |
2,03,154 |
2,46,246 |
2,71,403 |
|
|
(79.7) |
(80.3) |
(75.2) |
|
of which: |
|
|
|
|
a) Foreign Currency
Non-Resident Bank [FCNR(B)] |
50,796 |
58,110 |
68,086 |
|
|
(19.9) |
(19.0) |
(18.9) |
|
b) Foreign currency Borrowings * |
45,539 |
63,722 |
61,470 |
|
|
(17.9) |
(20.8) |
(17.0) |
|
c) Non-resident External
Rupee (NRE) A/c |
85,811 |
1,00,310 |
1,12,907 |
|
|
(33.7) |
(32.7) |
(31.3) |
|
d) Non-Resident Ordinary
(NRO) Rupee Deposits |
6,393 |
5,449 |
6,855 |
|
|
(2.5) |
(1.8) |
(1.9) |
2. |
Own Issues of Securities/Bonds
(including IMD/RIBs) |
29,235 |
4,856 |
10,036 |
|
|
(11.5) |
(1.6) |
(2.8) |
3. |
Other Liabilities |
22,609 |
55,506 |
79,258 |
|
|
(8.9) |
(18.1) |
(22.0) |
|
of which: |
|
|
|
|
a) ADRs/GDRs |
9,910 |
14,835 |
23,515 |
|
|
(3.9) |
(4.8) |
(6.5) |
|
b) Equity of Banks Held
by Non-residents |
3,230 |
28,438 |
40,328 |
|
|
(1.3) |
(9.3) |
(11.2) |
|
c) Capital/Remittable Profits of Foreign
Banks in India and other Unclassified
International Liabilities |
9,469 |
12,233 |
15,415 |
|
|
(3.7) |
(4.0) |
(4.3) |
Total International Liabilities |
2,54,999 |
3,06,609 |
3,60,698 |
|
|
(100.0) |
(100.0) |
(100.0) |
* : Inter-bank borrowings in India and from abroad
and external commercial borrowings of banks.
Note : Figures in brackets are percentages to total.
Source: Locational Banking Statistics. |
3.15 The share of external (international) sources of funds of scheduled commercial banks in their total liabilities, which rose almost consistently between end-March 2001 and end-March 2006, declined during the year (Chart III.3).

Bank Credit
3.16 Loans and advances of SCBs registered a robust growth of 30.6 per cent during 2006-07, on top of the high growth 31.8 per cent during 2005-06 and 33.2 per cent in 2004-05. Among the major components of bank credit, term loans which constituted the major component of loans and advances portfolio, continued to grow at a strong pace (34.9 per cent) during the year. As a result, the share of term loans in both total advances and gross domestic capital formation (GDCF) increased further during the year (Chart III.4). The other components of loans and advances portfolio, viz., cash credit and overdrafts and bill purchased and discounted grew at a lower rate as compared with the growth of overall bank credit.
Sectoral Deployment of Bank Credit
3.17 The modest slowdown in overall credit3 was reflected in all the four major sectors, viz., agriculture, industry, services and personal loans. There has been a greater deceleration in respect of services (especially in real estate loans) and personal loans. Credit growth to the SSI sector, however, accelerated sharply (Table III.5 and Appendix Table III.3).
3.18 Provisional data on sectoral deployment of credit up to August 17, 2007 indicate that on a

Table III.5: Sectoral Deployment of |
Non-food Credit: Flows |
(Variations over the year) |
(Amount in Rs. crore) |
Sector |
2005-06 |
2006-07 |
|
Absolute |
Per cent |
Absolute |
Per cent |
1 |
2 |
3 |
4 |
5 |
1. Agriculture and |
|
|
|
|
Allied Activities |
49,606 |
39.9 |
56,305 |
32.4 |
2. Industry (Small, |
|
|
|
|
Medium and Large) |
1,26,804 |
30.0 |
1,41,543 |
25.7 |
of which: SSI |
16,831 |
22.7 |
25,888 |
28.4 |
3. Personal Loans |
1,03,733 |
40.5 |
95,422 |
26.5 |
of which: Housing |
51,273 |
38.3 |
45,508 |
24.6 |
4. Other Services |
1,18,254 |
58.8 |
98,857 |
31.0 |
of which: |
|
|
|
|
i) |
Wholesale trade |
8,025 |
25.4 |
9,922 |
25.1 |
ii) |
Real Estate |
13,147 |
97.1 |
18,635 |
69.8 |
iii) |
Non-Banking |
|
|
|
|
Financial Companies |
11,463 |
50.3 |
14,226 |
41.5 |
Total Non-Food Gross |
|
|
|
|
Bank Credit (1 to 4) |
3,98,396 |
39.6 |
3,92,128 |
27.9 |
of which, Priority Sector |
1,35,222 |
36.1 |
1,22,472 |
24.0 |
Notes :
1. Data are provisional and relate to select scheduled
commercial banks which account for more than 90 per cent of bank
credit of all scheduled commercial banks.
2. Due to reclassification of sectors, data for March 2006
onwards are not strictly comparable with the earlier
periods.
3. Variations for 2005-06 cover data for 27 fortnights (instead
of 26 fortnights in a year).
4. Gross bank credit data include bills rediscounted with
Reserve Bank, EXIM Bank, other approved
financial institutions and inter-bank participations. |
year-on-year basis bank credit to agriculture, industry, services and personal loans slowed down to 24.4 per cent, 24.6 per cent, 24.5 per cent and 19.8 per cent, respectively. Growth of real estate loans remained high, notwithstanding some deceleration to 52.9 per cent.
Priority Sector Advances
3.19 The performance of banks in priority sector lending has improved in recent years, although substantial variations have been observed in the performance of various bank groups as also in meeting the sub-targets within the priority sector (Box III.2).
3.20 At individual bank-level within public and private sector, only five public sector banks achieved the overall target of lending to the priority
Box III.2: Performance of Banks in Priority Sector Lending
An enunciation of the need to channelise the flow of credit to certain sectors of the economy, known as the priority sectors, in the larger interest of the country, can be traced to the Reserve Bank’s credit policy for the year 1967-68. The severe imbalances had developed in the economy in 1965-66 and 1966-67 as a result of shortfalls in agricultural output and slowing down of industrial production. The Government of India initiated measures for social control over banks in 1967-68 with a view to securing a better adaptation of the banking system to the needs of economic planning and its playing a more active and positive role in aiding sectors like agriculture and small scale industries (SSI). One of the objectives of nationalisation of banks was to ensure that no viable productive endeavour should falter for lack of credit support, irrespective of the fact whether the borrower was big or small. Thus, the concept of priority sector lending was evolved further to ensure that assistance from the banking system flowed in an increasing measure to the vital sectors of the economy and according to national priorities.
The description of the priority sectors was formalised in 1972 on the basis of the report submitted by the Informal Study Group on Statistics relating to advances to the priority sector, constituted by the Reserve Bank. Although initially there were no specific targets fixed in respect of priority sector lending, in November 1974, public sector banks were advised that their priority sector lending should reach a level of not less than one-third of the outstanding credit by March 1979. In November 1978, the private sector banks were also advised to lend a minimum of 33 1/3 per cent of their total advances to the priority sectors by the end of March 1980. Subsequently, the target was enhanced to 40 per cent of aggregate advances. In achieving this overall target, sub-targets for lending to agriculture sector and weaker sections were also stipulated for the banks. At present banks are required to lend at least 18 per cent and 10 per cent, respectively, of their NBC to the agriculture sector and weaker sections of society, respectively.
Foreign banks operating in India were also advised to progressively increase their advances to the priority sector to reach a level of 15 per cent of their net bank credit (NBC) by end March 1992. In April 1993, this ratio was further raised to 32 per cent of NBC to be achieved by March 1994. Within the enhanced target of 32 per cent, two sub-targets of 10 per cent in respect of SSI and 12 per cent for exports were fixed. On the basis of the revised guidelines on lending to the priority sector, the priority sector lending target/sub-targets have now been linked to adjusted net bank credit (ANBC) or credit equivalent amount of off-balance sheet exposures, whichever is higher, with effect from April 30, 2007 (refer Box II.2).
Credit growth to the priority sector by all scheduled commercial banks decelerated to 24.0 per cent in 2006-07 from 36.1 per cent in the previous year. Credit to ‘other priority sector’, which witnessed a sharp growth in recent years, also decelerated sharply during 2006-07. However, while credit growth to agriculture decelerated, credit growth to small scale industries accelerated (Table 1).
Public Sector Banks
The outstanding advances granted by public sector banks to the priority sector were at Rs.5,21,180 crore as on the last
Table 1: Credit to the Priority Sector |
(Amount in Rs. crore) |
|
Outstanding as on |
Category |
March 19, |
March 18, |
March 31, |
March 30, |
|
2004 |
2005 |
2006 |
2007 |
1 |
2 |
3 |
4 |
5 |
Priority Sector |
2,63,834 |
3,74,953 |
5,10,175 |
6,32,647 |
(a+b+c) |
(24.7) |
(42.1) |
(36.1) |
(24.0) |
a) |
Agriculture |
90,541 |
1,24,269 |
1,73,875 |
2,30,180 |
|
|
(23.2) |
(37.3) |
(39.9) |
(32.4) |
b) |
Small Scale |
65,855 |
74,189 |
91,020 |
1,16,908 |
|
Industries |
(9.0) |
(12.7) |
(22.7) |
(28.4) |
c) |
Other Priority |
1,07,438 |
1,76,495 |
2,45,280 |
2,85,559 |
|
Sectors |
(38.3) |
(64.3) |
(39.0) |
(16.4) |
Notes:
1. Figures in parentheses are annual growth rates in per cent.
2. Owing to reclassification of sectors and increase in coverage of banks,
data for 2004-05 (47 banks) are
not strictly comparable with those in the subsequent years.
3. Data in this table may not match with those in
Table 2 and Table 3 due to different data sources. |
reporting Friday of March 2007. The outstanding priority sector advances of public sector banks, which increased by 27.2 per cent during 2006-07 as compared with 33.4 per cent in 2005-06, constituted 39.6 per cent of net bank credit - against the target of 40 per cent. Advances to agriculture constituted 15.6 per cent of NBC as on the last reporting Friday of March 2007 (Table III.2 and Appendix Table III.5). The PSBs, as a group, did not achieve the priority sector lending target of 40 per cent till March 1999. The target was first achieved in 2000 and the PSBs, as a group, continued to meet the target till 2005-06. Priority sector lending by the PSBs, as a group, however, marginally fell short of the target of 40 per cent by 0.4 per cent as on the last reporting Friday of March 2007. Seven PSBs (Allahabad Bank, Oriental Bank of Commerce, Syndicate Bank, IDBI Ltd., State Bank of India, State Bank of Mysore and State Bank of Patiala) did not achieve the priority sector lending target of 40 per cent as on the last reporting Friday of March 2007 (Appendix Table III.5 and III.5A). Out of 28 PSBs, only eight banks (Allahabad Bank, Andhra Bank, Bank of India, Indian Bank, Indian Overseas Bank, Punjab National Bank, State Bank of Bikaner and Jaipur and State Bank of Saurashtra) could achieve the agricultural lending target of 18 per cent. In the case of lending to weaker sections, only seven PSBs (Bank of India, Indian Bank, Indian Overseas Bank, Punjab National Bank, Syndicate Bank, State Bank of Bikaner and Jaipur and State Bank of Indore) achieved the sub-target of 10 per cent as on the last reporting Friday of March 2007.
Private Sector Banks
The outstanding priority sector advances extended by private sector banks as on the last reporting Friday of March 2007 were at Rs.1,43,768 crore, constituting 42.7 per cent of NBC (Table 2 and Appendix Table III.7). The private sector banks, as a group, did not achieve the overall priority sector
Table 2: Priority Sector Lending by Public and |
Private Sector Banks |
(As on the last reporting Friday of March) |
(Amount in Rs. crore) |
Item |
Public Sector Banks |
Private Sector Banks |
|
2006 |
2007@ |
2006 |
2007@ |
1 |
2 |
3 |
4 |
5 |
Priority Sector |
4,09,748 |
5,21,180 |
1,06,586 |
1,43,768 |
Advances |
(40.3) |
(39.6) |
(42.8) |
(42.7) |
of which: |
|
|
|
|
Agriculture |
1,55,220 |
2,05,091 |
36,712 |
52,056 |
|
(15.3) |
(15.6) |
(13.6) |
(12.8) |
Small-scale |
82,434 |
1,04,703 |
10,421 |
13,063 |
Industries |
(8.1) |
(8.0) |
(4.2) |
(3.9) |
Other Priority |
1,63,756 |
2,01,023 |
57,777 |
76,925 |
Sector |
(16.1) |
(15.3) |
(23.2) |
(22.9) |
@: Provisional.
Note:
1. Figures in parentheses represent percentages
to net bank credit for the respective groups.
2. Indirect agriculture is reckoned up to 4.5 per cent
of net bank credit for calculation of percentage of agriculture.
3. Data in this table may not match with those in
Table 1 and Table 3 due to different data sources. |
lending target of 40 per cent till 2001-02. The target was first achieved during 2002-03. Out of 26 private sector banks, four banks (Bank of Rajasthan Ltd., Centurian Bank of Punjab Ltd., Jammu and Kashmir Bank Ltd. and Karnataka Bank Ltd.) did not achieve the target as on the last reporting Friday of March 2007 (Appendix Table III.7and III.7A). Lending by private sector banks to the agriculture sector improved from 8.3 per cent of NBC at end-March 2000 to 13.6 per cent at end-March 2006, before declining to 12.8 per cent of NBC as on the last reporting
Friday of March 2007. Only three banks (Yes Bank, Lakshmi Vilas Bank and Sangli Bank) could achieve the 18 per cent sub-target for agriculture as on the last reporting Friday of March 2007. Lending to agriculture by another six banks ranged between 15 per cent and 18 per cent. No private sector banks could achieve the 10 per cent target for lending to weaker sections.
Foreign Banks
The outstanding priority sector advances by foreign banks, having offices in India, increased from Rs.14,555 crore as on the last reporting Friday of March 2003 to Rs.37,835 crore as on the last reporting Friday of March 2007, constituting 33.4 per cent of net bank credit (Table 3 and Appendix Table III.8). The share of export credit in total net bank credit at 18.3 per cent was significantly above the prescribed sub-target of 12.0 per cent. Foreign banks also reached the sub-target of 10.0 per cent in respect of lending to SSI (Table III.8). Foreign banks, as a group, have been achieving the overall priority sector lending target of 32 per cent of NBC since 1997. Out of 29 foreign banks operating in India, five banks (Abu Dhabi Commercial Bank, Bank of Tokyo-Mitsubishi, Citibank, HSBC Ltd. and Mizuho Corporate Bank) could not achieve the priority sector lending target of 32 per cent of NBC as on the last reporting Friday of March 2007. Seven foreign banks (Bank of Nova Scotia, Bank of Tokyo-Mitsubishi, Citibank, HSBC Ltd., JP Morgan Chase Bank, Mizuho Corporate Bank and Shinhan Bank) did not achieve the SSI lending targets at end-March 2007, while three foreign banks (American Express Bank, Bank International Indonesia and Mizuho Corporate Bank) did not achieve the sub-target of lending for exports (Appendix Table III.8A).
Non-achievement of agriculture lending target by many public and private sector banks is due to low capital formation in agriculture resulting in poor credit absorption and write-off of non-performing loans leading to reduction in the outstanding advances in the case of some banks.
Table.3: Priority Sector Lending by Foreign Banks |
(As on the last reporting Friday of March) |
(Amount in Rs. crore) |
Sector |
2005 |
2006 |
2007@ |
|
Amount |
Percentage |
Amount |
Percentage |
Amount |
Percentage |
|
|
to net bank |
|
to net bank |
|
to net bank |
|
|
credit |
|
credit |
|
credit |
1 |
2 |
3 |
4 |
5 |
6 |
7 |
Priority Sector Advances # |
23,843 |
35.3 |
30,439 |
34.4 |
37,835 |
33.4 |
of which: |
|
|
|
|
|
|
Export credit |
12,339 |
18.3 |
17,326 |
19.6 |
20,714 |
18.3 |
Small-scale industries |
6,907 |
10.2 |
8,430 |
9.5 |
11,648 |
10.3 |
@ : Provisional.
# : Inclusive of advances for setting up industrial estates,
loan to software industries, food and agro-processing sector,
self-help groups and venture capital.
Note : Data in this table may not match with those
in Table 1 and Table 2 due to different data sources. |
sector and sub-targets of lending to agriculture and weaker sections. Thirty one banks (12 public sector banks and 19 private sector banks) achieved the overall target, but did not achieve the sub-targets. Ten banks (six public sector banks and four private sector) did not achieve the overall target as also the sub-targets (Table III.6; Appendix Table III.5A and Appendix Table III.7A).
Special Agricultural Credit Plans
3.21 The Reserve Bank had advised public sector banks to prepare special agricultural credit plans (SACP) on an annual basis beginning 1994-95 with a view to achieving distinct and marked improvement in the flow of credit to agriculture. Under SACP, banks are required to fix self-set targets for achievement during the year (April-March). The targets are generally fixed by banks showing an increase of about 20-25 per cent over the disbursements made in the previous year. In recent years, public sector banks have largely met the SACP targets. For the financial year 2006-07, disbursements to agriculture under the plan aggregated Rs.1,22,443 crore as against the target of Rs.1,18,160 crore, constituting 103.6 per cent of the target. The SACP mechanism was also made applicable to private sector banks from the year 2005-06. Disbursements to agriculture by private sector banks during 2005-06 were Rs.31,199 crore as against the target of Rs.24,222 crore. During 2006-07, private sector banks disbursed Rs.35,585 crore to the agriculture sector under the plan, as against a self-set target of Rs.40,656 crore.
3.22 Public sector banks were advised to earmark 5 per cent of their net bank credit to women. At end-March 2007, aggregate credit to women by public sector banks stood at 4.95 per cent of their net bank credit with 21 banks reaching the target. Eight PSBs have opened 15 specialised women branches.
Table III.6: Achievement of Targets under the |
Priority Sector |
(Number of banks) |
Target/Sub-target |
Public |
Private |
Total |
|
Sector |
Sector |
|
1 |
2 |
3 |
4 |
1. |
Overall/Agriculture/Weaker Sections |
5 |
– |
5 |
2. |
Only Overall |
12 |
19 |
31 |
3. |
Overall and Agriculture |
2 |
3 |
5 |
4. |
Overall and Weaker Sections |
1 |
– |
1 |
5. |
Agriculture and Weaker Sections |
– |
– |
– |
6. |
Only Agriculture |
1 |
– |
1 |
7. |
Only Weaker Sections |
1 |
– |
1 |
8. |
None |
6 |
4 |
10 |
– : Nil. |
Micro-finance
3.23 The SHG-Bank Linkage Programme has emerged as the major micro-finance programme in the country. It is being implemented by commercial banks, RRBs and co-operative banks. At end-March 2007, cumulatively 2.9 million SHGs were linked to banks and the total flow of credit to these SHGs was Rs.18,041 crore. Total bank loans extended during the year were at Rs.6,643 crore, of which repeat loans to SHGs amounted to Rs.3,599 crore. Banks provided loans to 686,408 new SHGs during 2006-07 (see Chapter IV for details).
Credit to Industry
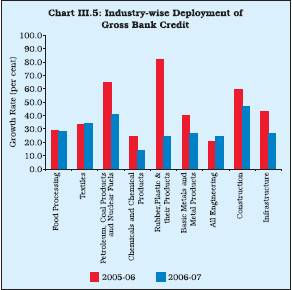
3.24 Growth in credit to industry (small, medium and large) decelerated to 25.7 per cent in 2006-07 from 30.0 per cent in the previous year. As credit growth to industry did not keep pace with the overall credit growth, the share of outstanding credit to industry in non-food gross bank credit declined to 38.5 per cent at end-March 2007 from 39.2 per cent at end-March 2006 and 42.1 per cent at end-March 2005. Infrastructure accounted for the largest share of incremental bank credit to industry (21.4 per cent), followed by textiles (14.1 per cent) and basic metals and metal products (12.4 per cent) (Appendix Table III.9). Power (within infrastructure) and iron and steel (within metal and metal products industry) accounted for the largest increase. The other major industries to which flow of bank credit increased were petroleum, food processing, engineering, chemicals and construction (Chart III.5).
Credit to the Small Scale Industries (SSI) Sector
3.25 Total credit provided by public sector banks (as per special return submitted by banks) to the SSI sector as on the last reporting Friday of March 2007 was at Rs.1,04,703 crore, constituting 8.0 per cent of net bank credit and 20.1 per cent of total priority sector advances of these banks. Within the SSI sector, advances to cottage industries, artisans and tiny industries aggregated Rs.44,311 crore, constituting 42.3 per cent of the advances to the SSI sector. The total credit provided by private sector banks to the SSI sector as on the last reporting Friday of March 2007 was Rs.13,063 crore, constituting 3.9 per
cent of net bank credit and 9.1 per cent of the total priority sector advances of these banks. The total credit provided by foreign banks to the SSI sector as on the last reporting Friday of March 2007 was Rs.11,648 crore, constituting 10.3 per cent of net bank credit and 30.8 per cent of total priority sector advances of these banks.
3.26 At end-March 2007, credit extended by scheduled commercial banks to 114,132 sick SSI units was at Rs.5,267 crore. Of the sick SSI units, 4,287 units with their outstanding bank credit at Rs.427 crore were found to be viable. Of these, banks placed 588 units under the nursing programmes, involving an outstanding credit of Rs.269 crore. In all, 109,011 units with outstanding credit of Rs.4,757 crore were found non-viable.
Credit to Khadi and Village Industries Commission
3.27 A consortium of select public sector banks was formed with State Bank of India as the leader of the consortium to provide credit to the Khadi and Village Industries Commission (KVIC). These loans are provided at 1.5 per cent below the average prime lending rate of five major banks in the consortium. At end-April 2007, an amount of around Rs.310 crore was outstanding out of Rs.738 crore disbursed by the consortium of banks under the scheme.
Retail Credit
3.28 Although the growth of retail portfolio of banks decelerated to 29.9 per cent during 2006-07 from 40.9 per cent in 2005-06, it still grew faster than the overall credit portfolio of the banking sector (28.5 per cent). As a result, their share in total loans and advances increased somewhat to 25.8 per cent at end-March 2007 from 25.5 per cent at end-March 2006. Within the retail portfolio, credit for consumer durables experienced the highest growth during 2006-07 in sharp contrast to the last year when it experienced the lowest growth. Growth of credit card receivables, auto loans and other personal loans (comprising loans mainly to professionals and for educational purposes) slowed down during the year. Housing loans, the largest component with a share of 46.0 per cent of retail portfolio of banks, also decelerated (Table III.7).
3.29 Although lending by SCBs to the sensitive sectors (capital market, real estate and commodities) decelerated sharply during 2006-07 from the high growth of the previous year, it grew
Table III.7: Retail Portfolio of Banks |
(Amount in Rs. crore) |
Item |
Outstanding as at end-March |
Percentage Variation |
|
2006 |
2007 |
2005-06 |
2006-07 |
1 |
2 |
3 |
4 |
5 |
1. |
Housing Loans |
1,79,060 |
2,24,481 |
33.4 |
25.4 |
2. |
Consumer Durables |
4,469 |
7,296 |
17.3 |
63.3 |
3. |
Credit Card Receivables |
12,434 |
18,317 |
47.9 |
47.3 |
4. |
Auto Loans |
61,369 |
82,562 |
75.1 |
34.5 |
5. |
Other Personal Loans |
1,18,351 |
1,55,204 |
39.1 |
31.1 |
Total Retail Loans (1+2+3+4+5) |
3,75,683 |
4,87,860 |
40.9 |
29.9 |
|
(25.5) |
(25.8) |
|
|
Total Loans and Advances of SCBs |
14,73,723 |
18,93,775 |
31.0 |
28.5 |
Note : Figures within brackets represent percentage share in total loans and advances.
Source : Off-site returns (domestic, unaudited and provisional). |
Table III.8: Lending to the Sensitive Sector by |
Scheduled Commercial Banks |
(As at end-March) |
(Amount in Rs. crore) |
Sector |
2006 |
2007 |
|
Amount |
Per cent to Total |
Amount |
Per cent
to Total |
1 |
2 |
3 |
4 |
5 |
1. Capital Market |
22,303 |
7.8 |
30,637 |
7.6 |
|
(40.6) |
|
(37.4) |
|
2. Real Estate Market |
2,62,053 |
91.7 |
3,70,689 |
91.9 |
|
(80.0) |
|
(41.5) |
|
3. Commodities |
1,413 |
0.5 |
2,206 |
0.6 |
|
(-40.3) |
|
(56.1) |
|
Total (1+2+3) |
2,85,770 |
100.0 |
4,03,533 |
100.0 |
|
(74.4) |
|
(41.2) |
|
Note : Figures in brackets are percentage variations over the previous year. |
at a significantly higher rate than the overall credit growth. Of the components, while credit to the real estate market decelerated sharply, credit for commodities increased sharply in contrast to the decline in the previous year (Table III.8). Total exposure of SCBs to the sensitive sectors constituted 20.4 per cent of aggregate bank loans and advances (comprising 18.7 per cent to real estate, 1.5 per cent to the capital market and 0.1 per cent to commodities) as compared with 18.8 per cent last year.
3.30 Among bank groups, new private sector banks had the highest exposure to the sensitive sectors (measured as percentage to total loans and advances of banks) mainly due to the high exposure to the real estate market, followed by foreign banks, old private sector banks and public sector banks (Table III.9 and Appendix Table III.11). Investments
3.31 Investments by banks registered a moderate growth of 10.6 per cent during 2006-07, spurred mainly by investment in Government securities, thus, reversing the trend of the last year when for the first time after the nationalisation of banks in 1969, banks’ investment in Government securities declined even in absolute terms. Within the investment portfolio, the non-SLR investments registered a higher growth than the SLR portfolio. During 2006-07, investment in Government and other approved securities by all SCBs increased by 10.2 per cent (Rs.72,977 crore) as compared with a decline of 3.1 per cent (Rs.22,809 crore) during 2005-06. Although credit offtake remained strong, robust deposit growth enabled banks to increase their exposure to investments. During 2006-07, SCBs made incremental investments of Rs.74,238 crore in approved Government securities. However, as percentage of their total assets, banks’ total investments in Government securities constituted 21.8 per cent of total assets at end-March 2007 (as against 24.8 per cent at end-March 2006) and 28.0 per cent of NDTL (as against 31.3 per cent of NDTL last year).
3.32 Although excess SLR investments by the banking sector during 2006-07 at Rs.84,223 crore were above the prescribed minimum requirement of 25.0 per cent, several banks were operating their statutory liquidity ratio portfolio very close to the prescribed minimum level (Chart III.6). Commercial bank’s holdings of such securities on October 26, 2007, at 29.4 per cent of their NDTL was somewhat higher than 28.0 per cent at end-March 2007 and 28.8 per cent a
Table III.9: Lending to the Sensitive Sector – Bank Group-wise* |
(Per cent) |
Sector |
Public Sector |
New Private |
Old Private |
Foreign |
|
Banks |
Sector Banks |
Sector Banks |
Banks |
|
2005-06 |
2006-07 |
2005-06 |
2006-07 |
2005-06 |
2006-07 |
2005-06 |
2006-07 |
1 |
2 |
3 |
4 |
5 |
6 |
7 |
8 |
9 |
Capital Market# |
1.2 |
1.3 |
2.3 |
2.2 |
1.3 |
1.5 |
2.6 |
2.4 |
Real Estate Market@ |
14.3 |
15.1 |
29.1 |
32.3 |
14.6 |
16.6 |
25.6 |
26.3 |
Commodities |
0.1 |
0.1 |
– |
– |
0.2 |
0.5 |
– |
– |
Total Advances to
Sensitive Sectors |
15.6 |
16.6 |
31.4 |
34.5 |
16.0 |
18.7 |
28.2 |
28.7 |
* : Advances to the sensitive sector as percentage
to total loans and advances of the concerned bank group.
# : Exposure to the capital market is inclusive
of both investments and advances.
@ : Exposure to real estate sector is
inclusive of both direct and indirect lending. |
Table III.10: Non-SLR Investments of Scheduled Commercial Banks |
(Amount in Rs. crore) |
Sector |
March 31, 2006 |
Per cent to Total |
March 30, 2007 |
Per cent to Total |
1 |
2 |
3 |
4 |
5 |
1. |
Commercial Paper |
4,821 |
5.4 |
8,978 |
9.4 |
2. |
Investment in shares |
12,775 |
14.2 |
18,344 |
19.3 |
|
of which: |
|
|
|
|
|
a) |
Public sector undertakings |
2,274 |
2.5 |
2,126 |
2.2 |
|
b) |
Private corporate sector |
10,501 |
11.7 |
16,218 |
17.1 |
3. |
Investments in bonds/debentures |
61,868 |
68.9 |
56,072 |
59.0 |
|
of which: |
|
|
|
|
|
a) |
Public sector undertakings |
32,345 |
36.0 |
28,472 |
30.0 |
|
b) |
Private corporate sector |
29,523 |
32.9 |
27,600 |
29.0 |
4. |
Units of MFs |
10,345 |
11.5 |
11,659 |
12.3 |
Total Non-SLR Investment (1+2+3+4) |
89,809 |
100.0 |
95,053 |
100.0 |
Source : Section 42 (2) returns submitted by SCBs. |
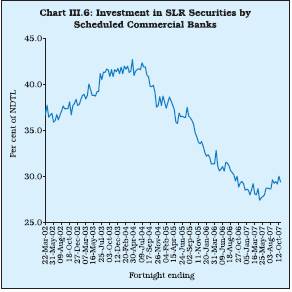
year ago. Excess SLR investments of SCBs increased to Rs.1,41,437 crore on October 26, 2007 from Rs.84,223 crore at end-March 2007 and Rs.1,00,626 crore a year ago.
Non-SLR investments
3.33 During 2006-07, banks’ investments in non-SLR securities (i.e., bonds/debentures/ shares and commercial papers) issued by the corporate sector increased by 4.9 per cent (Rs.3,929 crore) as compared with a decline of 14.6 per cent (Rs.13,620 crore) in the previous year, reflecting the robust growth of deposits. While investments in bonds/ debentures declined sharply, those in shares and commercial paper increased. On the whole, investments in corporate sector instruments (shares and bonds) as percentage to total non-SLR investments at end-March 2007 at 53.5 per cent were lower than the previous year’s level (55.9 per cent). The total flow of funds from SCBs to the commercial sector, credit and non-SLR investments, increased by 27.2 per cent (Rs.4,19,935 crore) as compared with 28.3 per cent (Rs.3,40,573 crore) in the last year (Table III.10).
3.34 In terms of instruments, although investments in bonds and debentures declined sharply at end-March 2007, they still constituted the largest component of non-SLR investments (Table III.11).
Table III.11: Composition of Non-SLR Investments |
(Per cent) |
Instrument |
2001-02 |
2002-03 |
2003-04 |
2004-05 |
2005-06 |
2006-07 |
1 |
2 |
3 |
4 |
5 |
6 |
7 |
Commercial Paper |
7.2 |
3.1 |
2.7 |
2.7 |
5.4 |
9.4 |
Bonds/debentures |
81.7 |
84.2 |
81.5 |
79.2 |
68.9 |
59.0 |
Shares |
6.6 |
7.9 |
7.3 |
9.4 |
14.2 |
19.3 |
Units of Mutual Funds |
4.5 |
4.9 |
8.5 |
8.7 |
11.5 |
12.3 |
Source : Section 42(2) returns submitted by SCBs. |
Table III.12: International Assets of Banks – By Type |
(As at end-March) |
(Amount in Rs. crore) |
Asset |
2005 |
2006 |
2007 |
1 |
2 |
3 |
4 |
International Assets (1+2+3) |
1,33,237 |
1,58,201 |
2,02,973 |
1. |
Loans and Deposits |
1,24,582 |
1,46,014 |
1,90,888 |
|
|
(93.5) |
(92.3) |
(94.0) |
|
of which : |
|
|
|
|
a) |
Loans to Non-Residents* |
4,103 |
6,270 |
7,122 |
|
|
(3.1) |
(4.0) |
(3.5) |
|
b) |
Foreign Currency Loans to Residents** |
58,092 |
63,231 |
75,000 |
|
|
(43.6) |
(40.0) |
(37.0) |
|
c) |
Outstanding Export Bills drawn on
Non-Residents by Residents |
26,171 |
31,556 |
40,846 |
|
|
(19.6) |
(19.9) |
(20.1) |
|
d) |
Nostro Balances@ |
35,673 |
44,515 |
67,487 |
|
|
(26.8) |
(28.1) |
(33.2) |
2. |
Holdings of Debt Securities |
979 |
2,079 |
1,761 |
|
|
(0.7) |
(1.3) |
(0.9) |
3. |
Other Assets @@ |
7,676 |
10,109 |
10,324 |
|
|
(5.8) |
(6.4) |
(5.1) |
* : Includes rupee loans and foreign currency
(FC) loans out of non-residents (NR) deposits.
** : Includes loans out of FCNR (B) deposits,
PCFC’s, FC lending to and FC deposits with banks in India.
@ : Includes placements made abroad and balances
in term deposits with non-resident banks.
@@ : Capital supplied to and receivable profits from foreign
branches/subsidiaries of Indian banks and other unclassified international Assets.
Note : Figures in brackets are percentages to total.
Source : Locational Banking Statistics. |
International Assets of the Banking System
3.35 The strong demand for credit was reflected in the higher growth of foreign currency loans to residents and outstanding export bills drawn on non-residents by residents during 2006-07. The share of ‘nostro balances’ in total international assets increased by 5.1 percentage points during 2006-07 as compared with the increase of 1.3 percentage points during 2005-06 (Table III.12).
3.36 The consolidated international claims of banks, based on immediate country risk, showed robust growth of 61.0 per cent during 2006-07 as compared with 24.9 per cent during 2005-06. The share of short-term claims (with residual maturity less than one year) in the consolidated international claims continued to decline during 2006-07, while that of long-term claims increased correspondingly.
3.37 Sector-wise pattern of international claims of banks remained broadly at the previous year’s level. The reporting banks had the largest exposure to the ‘non-bank private’ sector, followed by the bank sector (Table III.13).
3.38 The country-wise consolidated international claims of banks, based on immediate country risk, underwent some changes during the year. While the share of US and Hong Kong in total consolidated international claims declined significantly, that of Singapore increased. The shares of UK, Germany and the UAE remained broadly at the previous year’s level. The claims on the US, the UK, Hong Kong, Singapore and Germany together accounted for 53.9 per cent of total international claims (Table III.14).
Quarterly Trends - Commercial Banking Survey4
3.39 A quarterly analysis of developments in scheduled commercial banks (SCBs) revealed certain interesting features during 2006-07 (Table III.15 and Appendix Table III.12). As the reporting Fridays for end-September and end-March during 2006-07 fell on September 29, 2006 and March 30, 2007 (closer to the half-yearly and annual closing, respectively), the second and fourth quarters witnessed sharp increases in deposits and credit aggregates vis-a-vis the other quarters as well as the corresponding quarters of the previous year.
Table III.13: Classification of Consolidated
International Claims of Banks – By Maturity and Sector |
(As at end-March) |
(Amount in Rs. crore) |
Residual Maturity/Sector |
2005 |
2006 |
2007 |
1 |
2 |
3 |
4 |
Total Consolidated International Claims |
74,238 |
92,711 |
1,49,258 |
a) |
Maturity-wise |
|
|
|
|
1) Short-term (residual maturity less than one year) |
61,113 |
73,176 |
1,09,481 |
|
|
(82.3) |
(78.9) |
(73.4) |
|
2) Long-term (residual maturity of one year and above) |
11,951 |
18,627 |
39,775 |
|
|
(16.1) |
(20.1) |
(26.6) |
|
3) Unallocated |
1,174 |
907 |
2 |
|
|
(1.6) |
(1.0) |
(0.0) |
b) |
Sector-wise |
|
|
|
|
1) Bank |
34,301 |
43,050 |
69,781 |
|
|
(46.2) |
(46.4) |
(46.8) |
|
2) Non-Bank Public |
1,145 |
1,248 |
871 |
|
|
(1.5) |
(1.3) |
(0.6) |
|
3) Non-Bank Private |
38,792 |
48,413 |
78,607 |
|
|
(52.3) |
(52.2) |
(52.7) |
Note :
1. Figures in brackets are percentages to total.
2. Unallocated residual maturity comprises maturity not applicable
(e.g., for equities) and maturity information not available from reporting bank branches.
3. Bank sector includes official monetary institutions (e.g., IFC, ECB, etc.) and central banks.
4. Prior to the quarter ended March 2005, non-bank public sector
comprised companies / institutions other than banks in which
shareholding of State/Central Governments was at least 51 per cent,
including State/Central Governments and their departments.
From March 2005 quarter, 'Non-bank public' sector comprises
only State/Central Governments and their departments and, accordingly,
all other entities excluding banks are classified under 'Non-bank private' sector.
Source : Consolidated Banking Statistics – Immediate Country Risk Basis |
3.40 During Q1 of 2006-07, notwithstanding a decline in demand deposits, aggregate deposits
Table III.14: Consolidated International Claims |
of Banks on Countries other than India |
(As at end-March) |
(Amount in Rs. crore) |
Itmes |
2005 |
2006 |
2007 |
|
|
|
|
1 |
2 |
3 |
4 |
Total Consolidated |
|
|
|
International Claims |
74,238 |
92,711 |
149,258 |
Of which : |
|
|
|
a) |
United States of America |
22,348 |
23,176 |
32,875 |
|
|
(30.1) |
(25.0) |
(22.0) |
b) |
United Kingdom |
7,608 |
14,212 |
22,598 |
|
|
(10.2) |
(15.3) |
(15.1) |
c) |
Hong Kong |
7,389 |
6,652 |
8,977 |
|
|
(10.0) |
(7.2) |
(6.0) |
d) |
Singapore |
3,510 |
4,182 |
8,921 |
|
|
(4.7) |
(4.5) |
(6.0) |
e) |
Germany |
3,607 |
4,678 |
7,234 |
|
|
(4.9) |
(5.0) |
(4.8) |
f) |
United Arab Emirates |
2,771 |
4,059 |
6,686 |
|
|
(3.7) |
(4.4) |
(4.5) |
Note :
Figures in the brackets are percentage shares in total international claims.
Source : Consolidated Banking Statistics – Immediate Country Risk Basis. |
of SCBs increased. The decline in demand deposits reflected the unwinding of the large accretion during the previous quarter, redemption pressures on mutual funds and decline in the number of public issues. Time deposits, however, increased sharply reflecting higher interest rates and deposit mobilisation schemes initiated by the SCBs to meet high credit demand. Banks also liquidated foreign currency assets. This enabled banks to meet the sustained credit demand.
3.41 In Q2 of 2006-07, both accretion to deposits and credit offtake increased sharply. Higher growth in deposits was largely led by increase in time deposits, reflecting increase in interest rates. Interest rates on time deposits of 1-3 years maturity offered by public sector banks increased from a range of 5.75-6.75 per cent in March 2006 to 6.25-7.50 per cent in September 2006. Rates offered by private sector banks on similar maturity deposits moved from a range of 5.50-7.75 per cent to 6.75-8.25 per cent. The expansion in the deposits led to accelerated credit growth. While banks restricted investment in Government securities, they increased their investments in foreign currency assets.
Table III.15: Operations of Scheduled
Commercial Banks |
(Amount in Rs. crore) |
Item |
Outstanding as on |
Variations |
|
March 2007 |
2005-06 |
2006-07 |
2007-08 |
|
|
Q1 |
Q2 |
Q3 |
Q4 |
Q1 |
Q2 |
Q3 |
Q4 |
Q1 |
Q2 P |
1 |
2 |
3 |
4 |
5 |
6 |
7 |
8 |
9 |
10 |
11 |
12 |
Components |
|
|
|
|
|
|
|
|
|
|
|
1. |
Aggregate Deposits |
|
|
|
|
|
|
|
|
|
|
|
|
of Residents (a+b) |
25,41,201 |
7,145 |
1,29,596 |
13,065 |
1,90,983 |
30,677 |
1,66,396 |
31,469 |
2,62,886 |
62,265 |
1,99,683 |
|
a. Demand Deposits |
4,29,137 |
-22,249 |
41,167 |
-3,430 |
63,135 |
-41,272 |
43,300 |
-8,905 |
71,374 |
-41,305 |
52,052 |
|
b. Time Deposits of |
|
|
|
|
|
|
|
|
|
|
|
|
Residents |
21,12,063 |
29,394 |
88,430 |
16,495 |
1,27,848 |
71,949 |
1,23,096 |
40,374 |
1,91,511 |
1,03,569 |
1,47,630 |
|
|
|
|
|
|
|
|
|
|
|
|
|
2. |
Call/Term Funding from |
|
|
|
|
|
|
|
|
|
|
|
|
Financial Institutions |
85,836 |
-1,002 |
7,359 |
1,836 |
3,031 |
3,118 |
-1,576 |
-4,468 |
5,618 |
-2,984 |
5,609 |
Sources |
|
|
|
|
|
|
|
|
|
|
|
1. |
Credit to the Government |
7,74,980 |
-1,457 |
18,324 |
-25,068 |
-11,314 |
23,238 |
10,723 |
602 |
39,675 |
51,145 |
62,155 |
|
|
|
|
|
|
|
|
|
|
|
|
|
2. |
Credit to the Commercial |
|
|
|
|
|
|
|
|
|
|
|
|
Sector (a to d) |
20,87,511 |
12,862 |
1,04,416 |
53,032 |
1,72,011 |
22,606 |
1,41,465 |
64,777 |
1,95,164 |
-11,137 |
1,30,262 |
|
a. Bank Credit |
19,28,913 |
8,994 |
1,15,035 |
62,858 |
1,67,981 |
14,050 |
1,40,364 |
74,213 |
1,93,208 |
-34,072 |
1,30,557 |
|
i. Food Credit |
46,521 |
4,788 |
-5,255 |
1,464 |
-322 |
607 |
-7,840 |
8,171 |
4,891 |
-2,564 |
-6,948 |
|
ii. Non-food Credit |
18,82,392 |
4,206 |
1,20,290 |
61,394 |
1,68,303 |
13,443 |
1,48,204 |
66,042 |
1,88,317 |
-31,507 |
1,37,505 |
|
b. Net Credit to |
|
|
|
|
|
|
|
|
|
|
|
|
Primary Dealers |
2,799 |
7,130 |
-2,759 |
1,128 |
-2,913 |
-1,963 |
3,988 |
-2,783 |
-812 |
-282 |
780 |
|
c. Investments in Other |
|
|
|
|
|
|
|
|
|
|
|
|
Approved Securities |
15,451 |
-532 |
-10 |
-736 |
-2,017 |
526 |
-1,132 |
-352 |
-304 |
-377 |
4,592 |
|
d. Other Investments |
|
|
|
|
|
|
|
|
|
|
|
|
(in non-SLR Securities) |
1,40,347 |
-2,730 |
-7,851 |
-10,218 |
8,961 |
9,993 |
-1,756 |
-6,301 |
3,071 |
23,594 |
-5,667 |
3. |
Net Foreign Currency Assets |
|
|
|
|
|
|
|
|
|
|
|
|
of Commercial Banks (a-b-c) |
-40,259 |
-2,057 |
-4,850 |
9,935 |
26,612 |
-21,137 |
10,844 |
13,322 |
2,327 |
2,465 |
-13,902 |
|
a. Foreign Currency Assets |
58,754 |
-2,179 |
-1,044 |
11,169 |
6,114 |
-13,919 |
8,830 |
11,781 |
8,567 |
-8,312 |
-8,568 |
|
b. Non-resident Foreign |
|
|
|
|
|
|
|
|
|
|
|
|
Currency Repatriable |
|
|
|
|
|
|
|
|
|
|
|
|
Fixed Deposits |
67,108 |
804 |
187 |
1,856 |
-19,723 |
3,917 |
1,671 |
1,233 |
1,011 |
-3,849 |
-2,110 |
|
c. Overseas Foreign |
|
|
|
|
|
|
|
|
|
|
|
|
Currency Borrowings |
31,905 |
-925 |
3,618 |
-622 |
-775 |
3,301 |
-3,685 |
-2,774 |
5,229 |
-6,928 |
7,443 |
4. |
Net Bank Reserves |
1,90,086 |
3,060 |
9,679 |
-2,886 |
25,729 |
-6,090 |
20,381 |
-15,423 |
52,599 |
6,498 |
75,535 |
5. Capital Account |
2,02,618 |
20,359 |
2,530 |
9,342 |
8,090 |
12,025 |
6,168 |
2,250 |
4,447 |
26,996 |
20,985 |
P : Provisional.
* : Variation over April 1, 2005.
Note :
1. Data relate to the last reporting Friday of each quarter.
2. Time deposits include the impact of redemption of India
Millennium Deposits (IMDs), since December 29, 2005. |
3.42 In Q3 of 2006-07, accretion to aggregate deposits and credit offtake was lower than that in Q2. However, credit to the commercial sector was more than double the accretion in aggregate deposits. To meet the sustained credit offtake, banks liquidated investments both in Government securities and non-SLR securities during the quarter. Banks also increased their investments in foreign currency assets in the third quarter.
3.43 During Q4 of 2006-07, both aggregate deposits and overseas foreign currency borrowings increased sharply which enabled banks to meet the increased credit demand.
Furthermore, banks also increased their investments in Government and non-SLR securities. Banks’ investments in foreign currency assets, however, declined during the quarter.
3.44 In Q1 of 2007-08, aggregate deposits increased moderately while credit offtake turned negative. Therefore, Banks’ investment in both Government and non-SLR securities increased substantially.
3.45 During the Q2 of 2007-08, both aggregate deposits and credit offtake increased sharply. Banks’ investments in non-SLR securities declined while investment in Government securities remained high. Banks’ investment in foreign currency assets declined while their overseas borrowings expanded during the quarter.
Credit-Deposit Ratio
3.46 Some unusual behaviour was observed in the credit-deposit ratio (CDR) and investment-deposit (IDR) ratios as a result of robust credit growth in 2004-05 and 2005-06. The incremental CDR, which was lower than the incremental IDR up to June 11, 2004, rose sharply thereafter, while the incremental IDR declined. This trend was accentuated in 2005-06 as throughout the year the CDR remained significantly higher than the IDR. The trend of incremental CDR being significantly higher than IDR continued throughout 2006-07 as well. However, reflecting the modest slowdown in credit growth and the sharp acceleration in deposits, the incremental CDR moderated towards the second half of 2006-07. As at end-March 2007, the incremental CDR was around 85 per cent (year-on-year) as compared with 110 per cent a year ago. On the other hand, the incremental IDR, which remained less than 10 per cent (it was negative on certain fortnights) till early February 2007, increased thereafter to 14.6 per cent by end-March 2007 and further to 17.7 per cent till early August 2007. As a result, the gap between the two ratios narrowed down. As in the last year, the incremental CDR and IDR generally depicted a negative relationship (Chart III.7).
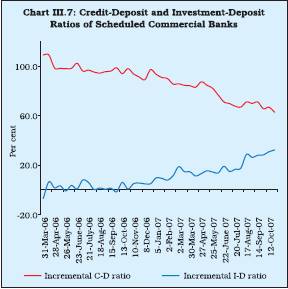
3.47 The CDR and IDR, based on the outstanding amount, which moved more or less in the same direction between 1999 and the third quarter of 2004-05, tended to move in the opposite directions thereafter. This pattern accentuated further in 2006-07 as the CDR increased further to reach an all-time high level of 74.0 per cent at end-March 2007, while the IDR slipped to a low of 30.3 per cent (Char III.8).
3.48 Among bank-groups, the CDR (in terms of outstanding amount) of foreign banks was the highest at end-March 2007, followed by new private sector banks, public sector banks and old private sector banks (Chart III.9).
3.49 At individual bank level, the CDR at end-March 2007 showed wide variations, especially of foreign banks. The CDR of public sector banks ranged between 59.6 per cent (United Bank of India) and 80.0 per cent (State Bank of Travancore), barring IDBI Ltd. whose CDR was 144.1 per cent. In the case of old private sector banks, the CDR ranged between 52.7 per cent (Bank of Rajasthan) and 77.7 per cent (ING Vysya Bank) (excluding Sangli Bank which was amalgamated with ICICI Bank). The CDR of new private sector banks ranged between 60.2 per cent (Development Credit Bank) and 99.3 per cent (Kotak Mahindra Bank). In the case of foreign banks, the CDR ranged between a low of 0.9 per cent (Oman International Bank) to a high of 697.0 per cent (Antwarp Diamond Bank). Of the 29
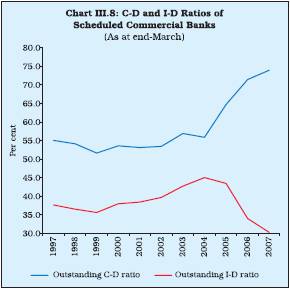
1 SCBs comprise 28 public sector banks (State Bank of India and its seven associates, 19 nationalised banks and the IDBI Bank Ltd.), 8 new private sector banks, 17 old private sector banks and 29 foreign banks. Ganesh Bank of Kurundwad Limited, which was placed under moratorium on July 7, 2006, and later merged with Federal Bank Limited on September 2, 2006, did not bring out its annual accounts for the year 2005-06.
2 As at end-March 2007.
3 As per sectoral credit data relating to 51 scheduled commercial banks.
4 Based on information received under Section 42 (2) Returns of the Banking Regulation Act, 1949.
|
 IST,
IST,


