 IST,
IST,


COVID-19 Pandemic and the Resilience of India’s R&D Expenditure
|
by Siddhartha Nath, Shruti Joshi and Sadhan Kumar Chattopadhyay^ Using a balanced panel data of 1,161 companies between financial years ending on March 2017 and March 2021, this study suggests that the likelihood of companies engaging in Research and Development (R&D) activities remained broadly unchanged in the immediate aftermath of COVID-19 pandemic-induced economic slowdown. The findings hold even after accounting for differences in company size, age, access to digital assets and promotional (product and marketing research) expenses. The resilience of R&D activities in the wake of a global shock (COVID-19) augurs well for sustained innovation and productivity growth for Indian companies over the long term during the post-COVID period. Introduction COVID-19 pandemic was once-in-a-century global crisis where 81 per cent of the countries have seen a contraction in their GDP. The pandemic resulted in a unique economic phenomenon that triggered simultaneous demand and supply side shocks across the globe. The fall in aggregate demand followed by the impaired productive capacity resulted in an economic slowdown of an unprecedented scale. This, in turn, proved to be a testing time for a large number of companies across the globe that suffered losses in revenues, customer base and profitability (Hu and Zhang, 2021; Shen et al., 2020; Golubeva, 2021). The subsequent recovery and sustainability of businesses in the post-pandemic years would largely depend on their scale of innovation1. Stimulated by the COVID crisis, enterprises found new ways to survive and grow. For instance, many businesses moved towards digital provision of goods and services. Perceiving the chaos as an opportunity (Thukral, 2021), businesses employed creativity, innovation, and entrepreneurial spirit to solve problems and grasp opportunities in a changed environment (Ratten, 2020). Evidence from past recessions suggest that high levels of uncertainty regarding potential output is associated with a fall in investment in tangible assets (Baker et al., 2016) and a freezing of factor reallocation across sectors (Bernanke,1983). On the other hand, investments in knowledge-based intangible capital, including R&D, are generally found to be resilient to the crises due to their large sunk costs, usually acting as buffers to the transmission of cycles (López-García et al., 2013). However, the R&D expenditure may turn out to be pro-cyclical if credit becomes constrained during a crisis, making firms cash starved (Aghion et al., 2012). During COVID-19, central banks and governments across the world deployed polices to support their economies such as lowering key policy rates, quantitative easing, loan guarantee and fiscal stimulus. Against the above backdrop, the aim of the paper is to examine if R&D expenditure by companies in India remained resilient to the recent COVID-19 pandemic shock. In addition to this, the paper also examines how the impact of COVID-19 on R&D activities possibly differed among firms with different firm characteristics such as age, size, assets and sector of economic activity. To articulate this objective, the study uses financial statements of companies operating in India as published by the Centre for Monitoring Indian Economy’s (CMIE) Prowess database between the financial years ending in March 2017 and March 2021. The article is divided into the following sections. Section II deals with the literature review on this area. Section III and IV describe the data and empirical methodology used in the study, respectively. Section V presents the results and Section VI concludes. Argente et al. (2018) investigates changes in innovation outcomes in the US consumer goods sector during 2007–13, a period of slowdown and recession induced by the Global Financial Crisis (GFC). Their findings suggest that there was a decline in the creation of new products during the recession. On the other hand, Schumpeterian growth models implied countercyclical R&D investment over the business cycle (Aghion et al., 2012), with economic crises creating conditions for innovations by lowering factor prices and creating a stock of idle resources (Schumpeter, 1934). Gorzelany (2021) found that businesses impacted by COVID-19 were more able to innovate in terms of product and management than those unaffected by COVID-19. There is, however, not much literature on the short-term impact of COVID-19 on the R&D activities of companies in India. There are, however, several studies available on the long-term determinants of R&D activities in India. Lall (1983) observed that the R&D activities of engineering firms are positively associated with the age of firms, size of firms, and exposure to foreign technologies through imports, FDI and licensing agreements. Kumar and Saqib (1996) found that export orientation, competitive pressure and vertical integration have a positive effect on firms’ decision to undertake R&D activities. Katrak H (1997, 2002) analysed whether a firm’s import of technology discourages in-house R&D expenditure. Analysis by Katrak (1997) found that larger firms have higher R&D output. Goldar and Renganathan (1998) found that firm size, rate of excise duty, and the extent of foreign ownership significantly affect firms’ R&D intensity in the post-liberalised period. Kumar and Aggarwal (2005) found that multinational affiliates in India had a lower R&D intensity than domestic Indian firms during 1990s as Multinational Enterprises (MNEs) held captive assets to their parent companies offshore. Mishra (2007) found that market share and human capital increased the probability of R&D activities for Indian firms, whereas market power and export orientation did not have any significant impact on R&D intensity. Ghosh (2009) found that larger firms have a higher probability of conducting R&D activity but have a lower R&D intensity. The paper found that outward orientation has a positive effect on R&D efforts and firm age has an inverse relation with R&D activities. Pradhan (2011) examined R&D expenditures for SMEs in India from 1991 to 2008 and found that company age, profit margin, foreign ownership and imported raw materials significantly affect R&D activities by SMEs. Based on the above studies, firm characteristics such as firm age, size, sector of economic activity, export orientation and FDI are found to be the significant determinants of R&D activity across firms in India. We observed that there is limited empirical literature analyzing the impact of COVID-19 shock on R&D activities of Indian firms. Our study fills this gap. In light of the available literature, we also account for the following firm characteristics in our estimates to understand whether the impact would vary across different firm-types. We categorise companies based on company size, age, sector of economic activity, promotional (product and marketing research) expenses and digitalization. This article examines how the average R&D expenditure varied amongst firms with these characteristics, followed by an econometric estimate of the impact of COVID-19 on R&D activities using a balanced panel data of 1,161 companies. We use consolidated annual financial statements of 1,072 manufacturing companies and 89 companies engaged in scientific and professional services operating in India from the Centre for Monitoring India Economy’s (CMIE’s) Prowess database for reporting periods between March 2017 and March 2021. We constructed a balanced panel data for these 1,161 companies for the period March 2017 to March 2021. The main variables which we capture from this data set are R&D expenditure, sector of economic activity, company’s size, spending on promotional expenses, and access to digital assets. In the prowess database, a company’s main activity is provided according to the National Industrial Classification (NIC), 2008. We classify the companies into seven broad sectors based on NIC- 2008 (Table 1). R&D expenditure is reported under several heads in the Prowess database. First, as part of the consolidated financial statements, companies report their R&D expenditure as miscellaneous expenses under the total expenses. However, this item captures only the current expenses incurred and reported by the company on R&D. It does not include the capital expenditures on R&D. Alternatively, Indian companies disclose their total R&D expenditure on both current and capital accounts in their Director Reports. This information is captured as a separate item outside the consolidated financial statements in the Prowess database. We have used this information and constructed the company’s R&D expenditures by adding up the expenses incurred on both the current and capital accounts for this study. We use company’s total income as an indicator of its ‘size’. Total income includes, gross sales, rental income, income from consultancy, software services, etc. Gross sale is conventionally used as a proxy for a company’s size (Horowitz, 1962; Hamberg, 1964; Pavitt, et al, 1987). Total income, however, may exceed a company’s gross sale if a company rents out its unutilized stock of capital, or even temporarily switch to providing services to other companies. We first observe the pre-COVID average annual income for all the 8,503 companies available in the Prowess database between March 2017 and March 2021. Then we classify companies into the following four categories within each of the seven sectors: companies with average pre-COVID annual income less than the 20th per centile, between 20th-50th per centile, between the 50th-80th per centile and greater than the 80th per centile. We define the first category as the ‘small firms’, while the second and third categories jointly as the ‘average firms’ following Poschke (2018), Gaur and Kesavan (2015), Alfaro et al. (2019), Shapiro et al (1987), Pfann et al. (2000), and Kumar et al. (1999). Ranking of companies within a similar set of activities provides an advantage of overcoming the challenges arising from heterogeneity across sectors, and their relationships with actual levels of sales, asset sizes etc. Therefore, we preferred using company-size make it percentile within sectors in our empirical models over absolute values of sales, assets or any financial variables. We define promotional expenses as the sum of expenses on selling and distribution, subscriptions, royalties paid, and technical know-how fees available from the Prowess database. We assume that the companies incur these expenses to remain competitive in the market and to promote newer features of their products (Rubinfeild and Pindyck, 1988). These expenses may also be incurred towards acquiring product designs, formulae, gaining knowledge of databases, etc. Therefore, these expenses could characterise a company’s exposure to a broader set of innovation activities. Although the main variable of interest in our study continues to be the aggregate R&D expenditure by the companies, we use promotional expenses to define company characteristics over the longer horizon. For instance, first, we compute the average ratio of promotional expenses to the total expenses for all the 8,503 companies available in Prowess between March 2017 and March 2021. Then we divide these companies into two categories. First, the companies which reported promotional expenditure to total expenditure ratio less than the median promotional expenditure ratio, including the companies which did not report any promotional expenditure, and second, the companies which reported this ratio above the median. We define these categories within each of the seven sectors separately and based on their behaviour before COVID-19-induced shocks. Then from the master database, we extract the panel dataset of 1,161 companies. We define a company’s access to digitalisation as the average ratio of the value of its digital assets to its net fixed assets across all the years since the period between March 2017 and March 2021. We define digital assets as the sum of the values of net software assets, computer and IT equipment, and communication equipment, as available in the Prowess database. We define two categories of companies based on their digital assets; first, companies which reported this ratio less than the median ratio for the sector, and second, the companies which reported this ratio above the median ratio for the sector, based on the master database of 8,503 companies. A wide range of literature defines ‘young firms’ as firms which are younger than 6 years (see Audretsch et al. (2014) for discussion). Based on this discussion, we keep 2014 as the benchmark year for defining ‘young firms’, since the first wave of COVID occurred in 2020. III.a. Data Description Chart 1 shows the distribution of 1,161 companies across seven broad sectors based on the sectoral classification. Around 92 per cent of the companies belong to the industrial sector spread across food products (11.0 per cent), chemicals (23.4 per cent), textiles (8.8 per cent), engineering (22.3 per cent), metal (10.7 per cent) and miscellaneous manufacturing (16.1 per cent). Remaining 7.0 per cent belong to the service sector. 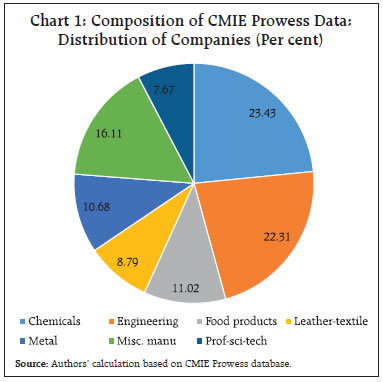  Chart 2 shows the proportion of 1,161 companies reporting R&D expenditures. For instance, more than 60 per cent of the companies producing chemical products reported R&D expenditure, followed by about 50 per cent of the companies producing engineering goods, while only around 7 per cent of the companies engaged in professional, scientific and technical services reported R&D expenditure. Chart 3 describes the distribution of companies based on their ‘size’ across the seven sectors. It shows that the category ‘small firms’ consists of less than 10 per cent of companies in our balanced panel data in all sectors except in the professional, scientific and technological services sectors2. This means, for a relatively large number of companies categorised as ‘small firms’ in our master data, the consolidated financial statements were not available for all the financial years ending between March 2017 and March 2021. Consequently, the shares of companies in two categories above the median size, i.e., the 50th per centile were either close to or higher than 30 per cent each in our balanced panel data, higher than their shares in the original unbalanced panel data. Chart 4 shows the distribution of 1,161 companies according to their promotional expenses across the seven broad sectors. Like ‘size’, the companies with above-median promotional expenses to total expenses ratio generally have a larger representation in our panel dataset. 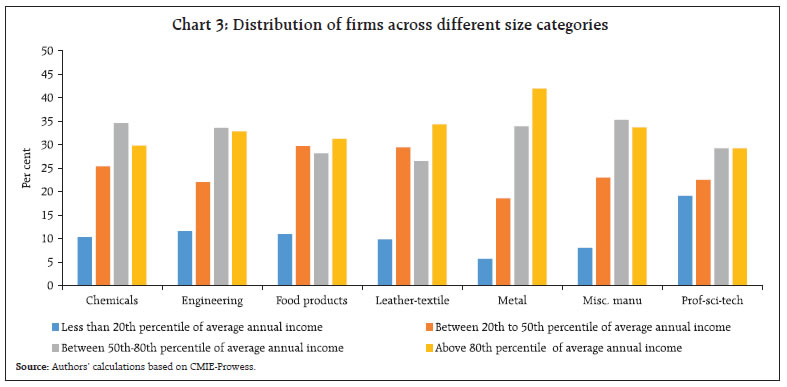  Chart 5 shows the distribution of 1,161 companies according to their digital assets across the seven broad sectors. Like ‘size’, the companies with above-median digital assets to total assets ratio generally have a larger representation in our panel dataset. 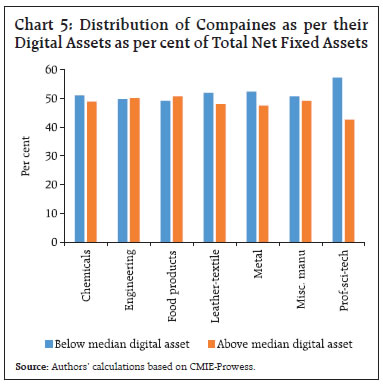 Table 2 summarises R&D expenditure as percentage of gross annual income across the seven broad sectors. These aggregate ratios do not suggest any discernible change between pre-COVID and post-COVID years. COVID-19 led to a simultaneous demand and supply side shock which resulted in losses in revenues, customer base and profitability (Hu and Zhang, 2021; Shen et al., 2020; Golubeva, 2021). This could have adversely impacted firms’ innovation capabilities. The figures reported in Table 2 suggest that India’s overall R&D expenditure may have been resilient to the COVID-19 shock. However, it may be noted that the aggregate figures can often be influenced by a few outliers or a set of companies with certain common characteristics (e.g. large firms, etc.). In those cases, a unit-level analysis, for example, at the company-level, comes with the advantage of analyzing the ‘average’ micro-level behaviour of observed units after controlling for certain characteristics, firm heterogeneity, and unobserved factors specific to sectors or periods of observation. To address this issue, we undertake an econometric analysis in the next section utilizing a balanced panel data of 1,161 companies to examine whether COVID-19 shock has induced any adverse effect on India’s company-level R&D expenditure. We adopt probit estimation to examine whether the likelihood of undertaking R&D activities by the companies in India remained resilient to COVID-19 pandemic. Our empirical analysis is based on a balanced panel dataset for 1,161 companies between March 2017 and March 2021. Working with balanced panel data for a smaller set of companies has certain advantages over the larger set of unbalanced panel data comprising all the companies. It provides a scope to understand the change in behaviour within a common set of companies when an exogenous shock hits. Secondly, the unbalanced panel data would consist of sudden entry and exit of companies into the sample. If this behaviour is not controlled for in the econometric model, this may induce biases (Nese and O’Higgins, 2007; Cader and Leatherman, 2011). A balanced panel data significantly reduces that possibility. The probit estimation is given below: 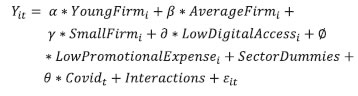 In this regression, Yit is a dummy variable which takes the value 1 if the ith company reported positive R&D expenditure in the tth year and takes the value 0 if that company did not report any R&D expenditure in the same year. Of the explanatory variables, YoungFirmi is a dummy variable which takes the value 1 if the ith company was incorporated in the registrar of companies after 2014. AverageFirmi is a dummy variable which takes the value 1 for the companies which lie between the 20th and 80th percentiles in the distribution of average annual income, while SmallFirmi is a dummy variable which takes the value 1 for the companies which lie below the 20th percentile in the same distribution. In the models, the large companies by annual income, which lie above the 80th percentile, therefore, serve as the reference group. The estimated coefficient for SmallFirmi, for instance, would suggest, by how much, the probabilities of undertaking R&D expenditures by small companies would deviate from that of the large companies based on the whole sample period. LowDigitalAccessi is a dummy variable which takes value 1 for all the companies which reported digital assets to total assets ratio less than the median ratio within each sector. Similarly, LowPromotionalExpensei is a dummy variable which takes value 1 for all the companies which reported promotional expenses to total expenses ratios less than the median ratio within each sector. In these two cases, companies with high digital assets and high promotional expenses, respectively, would work as the reference group. We also control for the sectoral differences by introducing sectoral dummies for 6 sectors; food products, leather-textile, chemical products, engineering goods, metal products and companies engaged in scientific and professional services. In this case, the miscellaneous manufacturing sector serves as the reference sector. The explanatory variables discussed so far are specific to the set of companies but do not change over the sample period. To capture the impact of the COVID-19 pandemic, we introduce a dummy variable Covid which takes a value 1 for the financial year ending in March 2021 and takes a value 0 for the remaining years between March 2017 and 2020. We also interact Covidt with all the explanatory variables discussed so far. While the coefficient of the dummy variable Covidt would estimate the overall impact of COVID-19 pandemic on R&D expenditure by the companies, the interactions would estimate any differential impacts on companies based on these categories. For instance, the coefficient of interaction between Covidt and SmallFirmi would suggest if Covid had any impact on the R&D activities compared to the small set of companies in the pre-covid period. The model is estimated using the standard maximum likelihood method by clustering the standard errors within sectors. We do not introduce company size, digitalisation and promotional expenditures in the same equation simultaneously, to avoid multicollinearity. Instead, we introduce each characteristic one by one in separate models. The company characteristics are defined based on a company’s relatively long-term income, expenditure and asset positions. Therefore, any possibility of those characteristics being correlated with any uncontrolled shock to a company’s R&D behaviour at a given point of time, captured through εit, would be minimised. This gives us confidence that the estimated coefficients would have the least bias on account of the well-known ‘endogeneity’ issues. The estimates suggest, for instance, that companies in chemical and engineering sectors have higher likelihood of engaging in R&D in general, as compared to miscellaneous manufacturing, which serves as the reference sector, since the probit coefficient of both chemical and engineering sectors are higher3 (Table 3). The coefficients of the dummy variables representing these two sectors are positive and statistically significant in all the specifications. In contrast, it is less likely that the companies in the manufacturing of food products, leather-textile and metal sectors would engage in R&D activities. The dummy variable corresponding to scientific and professional services is estimated to have negative and statistically significant coefficients in all the specifications. This suggests that the companies engaged in these sectors are less likely to engage in R&D activities. This could be possible under a scenario when the companies engaged in scientific and professional services only provide R&D services to other sectors. Those R&D expenses would be incurred and undertaken by the beneficiary companies, instead of the companies in scientific and professional services. We find in model 1 that the companies incorporated after 2014 are associated with a higher likelihood of being engaged in R&D activities as opposed to older companies. This result is in line with Ghosh (2009) who finds that firm’s age is inversely related to R&D intensity which could happen if old firms become complacent with time. We find in model 2 that in comparison to large companies, small and average companies are less likely to engage in R&D. This result is in line with Schumpeter’s hypothesis which argues that large firms are in a better position to undertake R&D projects. This could be because large firms can diversify the risks associated with R&D and spread the risks of R&D while also having better access to external finance (see Beck and Demirguc-Kunt (2006) for discussion). We find in models 3 and 4 that firms with low digital assets and low promotional expenses are less likely to engage in R&D. The use of digitally enabled technologies such as cloud computing, AI are associated with increase in likelihood of R&D. Similarly, greater the promotional expenses a firm undertakes, the higher is its likelihood of undertaking R&D. The impact of COVID-19 on R&D expenditure by companies in India can be gauged from the coefficient of the dummy variable Covidt. The estimated coefficient of Covidt is negative, suggesting some decline in the likelihood of R&D at company level, but is statistically insignificant in all the specifications. Moreover, we also find that the interactions of Covidt with each of the regressors are insignificant. This suggests that the COVID-19 pandemic may not have significantly impacted the likelihood of undertaking R&D activities by the companies in India. The statistical insignificance of the interacted variables suggests that this finding holds for different categories of companies based on their size, digital access, promotional activities and age. Hence, by comparing each interaction term with its reference category, the analysis suggests that COVID-19 did not have any immediate impact on the firm’s R&D, compared to its pre-COVID level, based on our sample. This study seeks to examine the possible impacts of COVID-19 pandemic on the likelihood of R&D activities by companies in India. We used a balanced panel data consisting of consolidated financial statements of 1,161 companies from the CMIE Prowess database for the period between end-March 2017 and end-March 2021. Our estimates suggest no significant impact of COVID-19 pandemic on the likelihood of company-level R&D activities in India, even after considering their differences based on size, access to digitalization, promotional expenses, and age. Our findings suggest that the R&D activities by companies operating in India was broadly resilient to the economic shock induced by COVID-19 pandemic. The results are in line with López-García et al. (2013), who argue that investment in knowledge-based intangible capital, including R&D, is generally resilient to an economic crisis due to their large sunk costs borne at the initial stages of the investment. References Acs, Z. J., & Audretsch, D. B. (1987). Innovation, market structure, and firm size. The review of Economics and Statistics, 567-574. Aghion, P., Askenazy, P., Berman, N., Cette, G., & Eymard, L. (2012). Credit constraints and the cyclicality of R&D investment: Evidence from France. Journal of the European Economic Association, 10(5), 1001-1024. Alfaro, L., Asis, G., Chari, A., & Panizza, U. (2019). Corporate debt, firm size and financial fragility in emerging markets. Journal of International Economics, 118, 1-19. Argente, D., Lee, M., & Moreira, S. (2018). Innovation and product reallocation in the great recession. Journal of Monetary Economics, 93, 1-20. Audretsch, D.B., Segarra, A. and Teruel, M. Why don’t all young firms invest in R&D? (2014). Small Bus Econ 43, 751–766. Beck, T., & Demirguc-Kunt, A. (2006). Small and medium-size enterprises: Access to finance as a growth constraint. Journal of Banking & finance, 30(11), 2931- 2943. Baker, S. R., Bloom, N., & Davis, S. J. (2016). Measuring economic policy uncertainty. The quarterly journal of economics, 131(4), 1593-1636. Bernanke, B. S. (1983). Irreversibility, uncertainty, and cyclical investment. The quarterly journal of economics, 98(1), 85-106. Cader, H. A., & Leatherman, J. C. (2011). Small business survival and sample selection bias. Small Business Economics, 37, 155-165. Dorfman, N. S. (1987). Innovation and market structure: Lessons from the computer and semiconductor industries. Ballinger Publishing Company. Gaur, V., Kesavan, S. (2015). The Effects of Firm Size and Sales Growth Rate on Inventory Turnover Performance in the U.S. Retail Sector. In: Agrawal, N., Smith, S. (eds) Retail Supply Chain Management. International Series in Operations Research & Management Science, vol 223. Springer, Boston, MA. Ghosh, S. (2009). R&D in Indian manufacturing enterprises: what shapes it?. Economics of Innovation and New Technology, 18(4), 337-352. Goldar, B. N., & Renganathan, V. S. (1998). Economic reforms and R&D expenditure in industrial firms in India. Indian Economic Journal, 46(2), 60. Golubeva, O. (2021). Firms’ performance during the COVID-19 outbreak: International evidence from 13 countries. Corporate Governance: The International Journal of Business in Society, 21(6), 1011-1027. Gorzelany-Dziadkowiec, M. (2021). Covid-19: Business innovation challenges. Sustainability, 13(20), 11439. Hall, B. H., J. Mairesse, and P. Mohnen. (2010). “Measuring the Returns to R&D.” In Handbook of the Economics of Inovation 2, edited by B. H. Hall and N. Rosenberg, 1033–84. Amsterdam: North Holland Publishing. Hamberg, D. (1964). Size of firm, oligopoly, and research: The evidence. Canadian Journal of Economics and Political Science/Revue canadienne de economiques et science politique, 30(1), 62-75. Horowitz, I. (1962). Firm size and research activity. Southern Economic Journal, 298-301. Hu, S., & Zhang, Y. (2021). COVID-19 pandemic and firm performance: Cross-country evidence. International review of economics & finance, 74, 365-372. Katrak, H. (1997). Developing countries’ imports of technology, in-house technological capabilities and efforts: an analysis of the Indian experience. Journal of Development Economics, 53(1), 67-83. Katrak, H. (2002). Economic liberalization and new product enterprises in the newly industrializing countries: an analysis of the Indian experience. Journal of International Development, 14(2), 195-206. Kumar, N., and Aggarwal, A. (2005). Liberalization, outward orientation and in-house R&D activity of multinational and local firms: A quantitative exploration for Indian manufacturing. Research Policy, 34(4), 441-460. Kumar, K., Rajan, R., & Zingales, L. (1999). What determines firm size?. NBER Working Paper 7208, July. Kumar, N., and Saqib, M. (1996). Firm size, opportunities for adaptation and in-house R & D activity in developing countries: the case of Indian manufacturing. Research Policy, 25(5), 713-722. Lall, S. (1983). Determinants of R&D in an LDC: The Indian engineering industry. Economics Letters, 13(4), 379-383. López-García, P., Montero, J.M. and Moral-Benito, E., (2013). Business cycles and investment in productivity-enhancing activities: evidence from Spanish firms. Industry and Innovation, 20(7), pp.611-636. Mishra, V. (2007). The Determinants of R&D Expenditure of Firms: evidence from a cross-section of Indian firms. Economic Papers: A journal of applied economics and policy, 26(3), 237-248. Nese, A., & O’Higgins, N. (2007). Attrition bias in the Capitalia panel. International Review of Economics, 54, 383-403. Pavitt, K., Robson, M., & Townsend, J. (1987). The size distribution of innovating firms in the UK: 1945-1983. The Journal of Industrial Economics, 297-316. Pfann, G. A., Biddle, J. E., Hamermesh, D. S., & Bosman, C. M. (2000). Business success and businesses’ beauty capital. Economics Letters, 67(2), 201-207. Pindyck, R. S., Rubinfeld, D. L., & Rabasco, E. (2013). Microeconomia. Pearson Educación. Poschke, M. (2018). The firm size distribution across countries and skill-biased change in entrepreneurial technology. American Economic Journal: Macroeconomics, 10(3), 1-41. Pradhan, J. P. (2011). Regional heterogeneity and firms’ innovation: The role of regional factors in industrial R&D in India. Available at SSRN 1741127 Ratten, V. (2020). Coronavirus and international business: An entrepreneurial ecosystem perspective. Thunderbird International Business Review, 62(5), 629-634. Schumpeter, J. A. (1976). II. Capitalism, Socialism, and Democracy, 1942. Schumpeter, J., & Backhaus, U. (1934). The theory of economic development. In Joseph Alois Schumpeter: Entrepreneurship, Style and Vision (pp. 61-116). Boston, MA: Springer US. Schumpeter, J. A., & Nichol, A. J. (1934). Robinson’s economics of imperfect competition. Journal of political economy, 42(2), 249-259. Shapiro, D., Bollman, R. D., & Ehrensaft, P. (1987). Farm size and growth in Canada. American Journal of Agricultural Economics, 69(2), 477-483. Shen, H., Fu, M., Pan, H., Yu, Z., & Chen, Y. (2020). The impact of the COVID-19 pandemic on firm performance. Emerging Markets Finance and Trade, 56(10), 2213-2230. Thukral, E. (2021). COVID-19: Small and medium enterprises challenges and responses with creativity, innovation, and entrepreneurship. Strategic Change, 30(2), 153-158. Ziemnowicz, C. (1942). Joseph A. Schumpeter and innovation. Socialism and Democracy, 2(1), 2-4. ^ The authors are from the Department of Economic and Policy Research, Reserve Bank of India, Mumbai. The views and opinions expressed in this article are of the authors and do not represent the views of the Reserve Bank of India. The research support extended by Shashank Bhujade is greatly acknowledged. 1 See Sustainable Development Goal 9 (SDG-9) by the United Nations. 2 The categories were defined based on 8,503 companies. 3 The probit coefficient is the z score and since the probability is calculated as a linear function of this z score then the coefficient with a higher z score may as well have a higher probability. |

આ પેજ શેર કરો:


રિઝર્વ બેંક ઑફ ઇન્ડિયા મોબાઇલ એપ્લિકેશન ઇન્સ્ટૉલ કરો અને લેટેસ્ટ ન્યૂઝનો ઝડપી ઍક્સેસ મેળવો!
અમારી એપ ઇન્સ્ટોલ કરવા માટે QR કોડ સ્કેન કરો


પેજની છેલ્લી અપડેટની તારીખ:


