
III. The External Economy - આરબીઆઈ - Reserve Bank of India


III. The External Economy
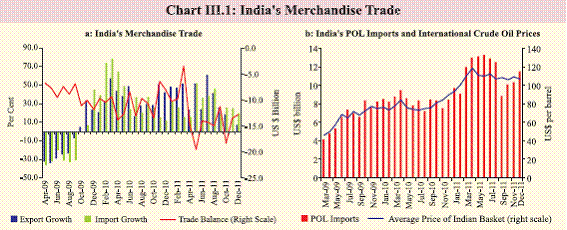
Early indicators suggest that pressure on current account deficit (CAD) and its financing persisted through Q3 of 2011-12, while capital inflows turned weaker. CAD is expected to widen during the year despite a faster rate of growth of exports compared with imports during the first half. Import demand has remained strong, notwithstanding rupee depreciation, reflecting the inelastic demand for oil and increasing gold demand. The composition of capital inflows shifted in favour of debt, with a rise in the proportion of short-term flows. Widening CAD, diminishing capital flows and moderately deteriorating vulnerability indicators, notwithstanding improved net international investment position (NIIP), warrant acceleration of the domestic reform process. This will encourage renewed equity flows. Overall external sector outlook deteriorates III.1 The rising uncertainties associated with the euro zone sovereign debt crisis, the slowdown in advanced economies (AEs) and the weakening domestic economy have contributed to deterioration of India’s external sector outlook in terms of current account balance, capital flows and vulnerability indicators. Despite depreciating rupee, if moderation in export growth observed in Q3 of 2011-12 persists and imports stay closer to prevailing trend amidst insufficient elasticity responses in the short run, the trade deficit is likely to remain high. Even as the rupee depreciation may improve flow of remittances, the current account deficit (CAD) is likely to widen further in Q3 of 2011-12 before possible contraction in Q4 reflecting the seasonal pattern, leaving the full-year CAD wider. Furthermore, with rupee stabilising since the latter half of December, equity investment inflows are starting to come back. Slippage in export performance likely as global growth and trade slows again III.2 India’s merchandise exports may fall short of the target of US$ 300 billion set for 2011-12 as global trade has slowed down again amidst global financial market uncertainties and the weakening demand conditions in advanced economies. After performing well during the first half of 2011-12, merchandise exports decelerated in Q3 of 2011 (Table III.1 and Chart III.1a).1 Austerity measures undertaken by the European economies and decline in consumption expenditure may further impact India’s exports in the coming period. Notably, in 2010-11, exports grew strongly on the back of market and product diversification measures by the government which helped raise the elasticity of India’s exports to world GDP. The sluggishness of advanced economies (AEs) is, however, now proving to be a dampener to the trade volume growth of emerging and developing economies (EDEs). Against this global backdrop, measures aimed at diversification of India’s export markets may have limited impact in the short-term.
Inelastic import demand for oil and gold widens the trade deficit III.3 The widening trade deficit recorded up to December 2011 was largely driven by imports of ‘oil’ and ‘gold and silver’. Import of oil is relatively inelastic to changes in international prices and exchange rate. On the other hand, apart from traditional purposes, demand for gold as an investment asset appears to have increased in the recent period. The rise in import of petroleum, oil and lubricants (POL) is largely reflective of increase in international oil prices (Chart III.1b). While the average international price of Indian oil basket increased by 38.6 per cent during April-December 2011 over April- December 2010, imports of POL (in value terms) expanded by 40.1 per cent during the same period. Similarly, there has been sharp increase in import of gold and silver by 53.8 per cent during April-December 2011. Estimates based on disaggregated data available up to September 2011 reveal that the rise in gold import has been both on account of price as well as quantum factors. During April-September 2011, quantum of gold import is estimated to have risen by 25.1 per cent to 554 million tonnes and international prices of gold on average during the same period rose by 31.1 per cent to US$ 1607 per troy ounce. Upward risks to CAD become more pronounced with likely moderation of software earnings - the mainstay of services III.4 The increase in global economic uncertainties has amplified the risks to CAD (Table III.4). While weaker demand for merchandise exports along with inelastic oil and gold imports may further widen the trade deficit, CAD may, in addition, be prone to risks emanating from moderation in receipts on account of software exports, business services and investment income. If euro area debt crisis remains unresolved and contagion spreads to other AEs, companies in US and EU countries could reduce their IT budgets which may affect prospects for India’s software exports. Similarly, weakening of economic activity in AEs can lead to a downtrend in business services as was observed during Q4 of 2008-09 to Q4 of 2009-10. As a result, CAD is expected to remain under pressure after having widened sequentially to 3.7 per cent of GDP in Q2 of 2011-12 from 3.4 per cent in Q1 of 2011-12 (Table III.2).
Likely shift in financing pattern of CAD as equity flows turned weak III.5 Risk aversion in the global financial markets has slackened the pace of capital flows to India (Table III.3). FDI inflows remained robust averaging US$ 4.9 billion per month during April-August 2011 but moderated to US$ 3.2 billion per month during September- November 2011 (Table III.4). If the pace of FDI inflows does not pick up once again and FII equity inflows revert to the decelerating trend, CAD may have to be largely financed through debt creating flows in the coming quarters. Recent pick up in FII flows has been mainly on account of investment in debt instruments. Even the debt creating capital inflows are subject to risk aversion III.6 Several measures have been undertaken to improve inflows of external commercial borrowings (ECBs) and NRI deposits. While inflows on account of NR(E)RA and NRO accounts were higher during April-December 2011, the same on account of FCNR (B) accounts were negative. ECBs and FCCBs by Indian companies due for redemption in Q4 of 2011-12 are estimated to be less than US$ 4 billion. Recognising the global macroeconomic and financial market conditions, the Reserve Bank raised all-in-cost ceiling on ECBs. The increase in the all-in-cost ceiling, and emphasis on bringing immediately the proceeds of the ECBs meant for rupee expenditure in India, augur well for raising overseas borrowings and financing the CAD. Also, greater flexibility has been given to banks in mobilising non-resident deposits by further deregulating interest rates on NRE and NRO accounts.
III.7 Although recent measures by the European Central Bank and other central banks may have eased financing conditions for banks in the euro area, deleveraging by some European banks has begun to affect cross-border lending to the emerging markets.
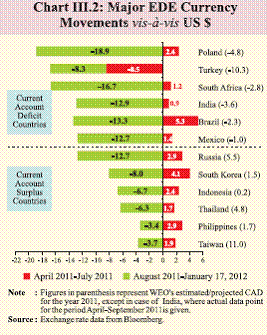
Flight to dollar cause currency pressures in many emerging markets III.8 Declining risk tolerance of investors resulted in a flight to the US dollar as a global safe haven currency. Dollar value generally strengthened, especially against EDE currencies. Currencies of the EDEs running current account deficit came under significant pressure, when compared with those with current account surplus EDEs (Chart III.2). Some central banks, including those of Brazil, Russia and South Korea, have intervened in currency markets to smoothen exchange-rate volatility. Until risk aversion subsides, EDE currencies may continue to remain under pressure. With higher CAD and subdued capital flows during 2011-12 so far, the depreciation of the Indian rupee reflected interplay of forces operating through the trade, capital and confidence channels.
Depreciation in REER as rupee weakens in nominal terms III.9 The real effective exchange rate (i.e., REER based on 6, 30 and 36 currency baskets) continued to show depreciating trend in Q3 reflecting sharp depreciation of the rupee in nominal terms. The indices, however, recorded an appreciation in January so far (up to January 13, 2012) as rupee appreciated in nominal terms during the same period (Table III.5). Depreciation of the rupee and decline in equity indices can have a balance sheet impact III.10 Due to subdued sentiments in the Indian equity market, Indian companies may require to plan innovatively to facilitate conversion of FCCBs into equity. This is to guard against consequent deterioration in the debt-equity ratio which may have a balance sheet impact. Amidst rising fragilities and uncertainties surrounding the global economic outlook, rolling over of overseas borrowings of Indian companies may become more expensive. Furthermore, the depreciating rupee may also offset the advantage of interest rate differential between domestic and overseas borrowings and impact the balance sheet of corporates. It is incumbent upon corporates to suitably hedge their receivables and payables against exchange rate volatilities. External debt may rise but will remain manageable III.11 The rise in external debt from US$ 306.4 billion at end-March 2011 to US$ 326.6 billion at end-September 2011 is largely attributed to the increase in ECBs, export credits and short-term debt (Table III.6). With increasing recourse to debt creating flows for financing the CAD, India’s external debt is likely to rise further. Increased flows on account of ECBs and NRI deposits may have some implications for India’s external debt in coming quarters. Nonetheless, it is expected that external debt will remain manageable. India’s non-debt external capital being large, the strong longterm growth could make external debt rollovers relatively smooth.
External vulnerability indicators worsened marginally III.12 There was marginal decline in some external sector vulnerability indicators in Q2 of 2011-12 (Table III.7). The reserve cover of imports was lower as at end-September 2011 and the ratio of short-term external debt to total external debt also increased marginally. However, India’s Net International Investment Position (IIP) showed an improvement as net international liabilities declined to US$ 224.9 billion at end-September 2011 from US$ 237.5 billion at end-June 2011 (Table III.8). As a result, the declining trend in the ratio of India’s net international financial liabilities to GDP continued in Q2 of 2011-12. The decline mainly reflected valuation changes emanating from exchange rate movements.
Adjustment necessary through absorption and expenditure-switching policies III.13 The rising CAD is expected to correct with a lag as exports respond to a weaker rupee, while import demand dampens with exchange rate pass-through. Decelerating aggregate demand should also help to contain CAD. However, if this adjustment is delayed in an uncertain global environment, policy responses may become necessary. Both expenditure reducing and expenditure switching policies may be necessary in this setting. III.14 The depreciation of exchange rate since August 2011 itself would have a favourable impact on exports during 2012-13. However, keeping in view the dominance of inelastic importable items in India’s import basket, and presence of imperfect labour markets, expenditure switching policies may not necessarily bring about the desired adjustment in CAD. Further, to restrain the oil demand, further deregulation of prices of petroleum products may be expedited. Also, fiscal spending may need to be restrained so that absorption is contained and twin deficits do not feed on one another. III.15 Close monitoring of the short-term external debt will be required in 2012-13. On the capital account, recent policy measures 1 Based on updated data incorporating downward revision of US$ 9 billion in merchandise exports by DGCI&S. |
||||||||||||||||||||||||||||||||||||||||||||||||||||||||||||||||||||||||||||||||||||||||||||||||||||||||||||||||||||||||||||||||||||||||||||||||||||||||||||||||||||||||||||||||||||||||||||||||||||||||||||||||||||||||||||||||||||||||||||||||||||||||||||||||||||||||||||||||||||||||||||||||||||||||||||||||||||||||||||||||||||||||||||||||||||||||||||||||||||||||||||||||||||||||||||||||||||||||||||||||||||||||||||||||||||||||||||||||||||||||||||||||||||||||||||||||||||||||||||||||||||||||||||||||||||||||||||||||||||||||||||||||||||||||||||||||||||||||||||||||||||||||||||||||||||||||||||||||||||||||||||||||||||||||||||||||||||||||||||||||||||||||||||||||||||||||||||||||||||||||||||

આ પેજ શેર કરો:


રિઝર્વ બેંક ઑફ ઇન્ડિયા મોબાઇલ એપ્લિકેશન ઇન્સ્ટૉલ કરો અને લેટેસ્ટ ન્યૂઝનો ઝડપી ઍક્સેસ મેળવો!


