
Industrial Outlook Survey: 2015-16 - આરબીઆઈ - Reserve Bank of India


Industrial Outlook Survey: 2015-16
This annual article, fourth in the series, presents the findings of Industrial Outlook Survey (IOS) conducted quarterly during FY: 2015-16 (covering 70th to 73rd rounds of the survey). In the first two quarters, the business sentiments in the manufacturing sector weakened followed by improvements in the third quarter. However, the fourth quarter witnessed some reversal with weakened business sentiments. Based on 4-quarter average Business Expectation Index (BEI), the business situation remained weaker in FY: 2015-16 as compared to FY:2014-15. I. Introduction The Reserve Bank of India monitors trends in various macroeconomic indicators in the process of formulating the monetary policy. However, most of these indicators are available with a time lag. In order to bridge the gap, the Reserve Bank conducts a few forward looking surveys covering corporate and household sectors. With more economic activities coming in the ambit of organised sector and the corporate sector being one of the key sectors in the economy, business sentiment surveys, which capture the sentiments that drive the current and near-term business decisions, provide key information inputs for policy formulation. Many other central banks also conduct such business sentiment surveys seeking qualitative information on various business indicators. In line with the prevailing international practices, the Reserve Bank has been conducting the Industrial Outlook Survey (IOS) for Indian manufacturing sector on a quarterly basis, since 1998. The survey captures the assessment of business sentiments for the current quarter and expectation for the ensuing quarter, based on qualitative responses on a set of indicators pertaining to the demand conditions, financial conditions, employment conditions and price situation. The survey schedule is canvassed among a fixed panel of 2,500 manufacturing companies, mostly with paid-up capital above ₹ 5 million, representing a good mix of size and industry groups. The panel of respondents is kept uniform to the extent possible and is updated with addition of new companies or deletion of closed/merged companies to maintain good coverage of main industries. The survey is voluntary and the response rates have been around 55 per cent in 2015-16. This article analyses the survey responses for four quarters- from April-June 2015 to January-March 2016 (i.e. FY: 2015-16). The quarterly survey results are regularly disseminated through the RBI website. The related data tables (annual series) are presented in Annex. II. Business sentiments declined The Business Expectation Index (BEI), which is computed as a weighted average of the Net Response (NR)1 on nine select performance indicators2, gives a single snapshot of the industrial outlook in each quarter. For each of the survey round, two indices are computed – one based on the assessment of current quarter and another based on expectation for ensuing quarter. During the financial year 2015-16, the BEI (based on assessment) remained optimistic, hovering over the threshold level of 100, which separates contraction (below the threshold level) and expansion (above the threshold level) in the economy. The BEI (assessment) showed decline in the business situation in the first two quarters of FY: 2015-16 and improved in the third quarter. However, it again moderated in Q4. 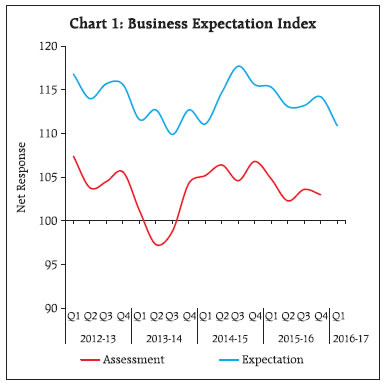
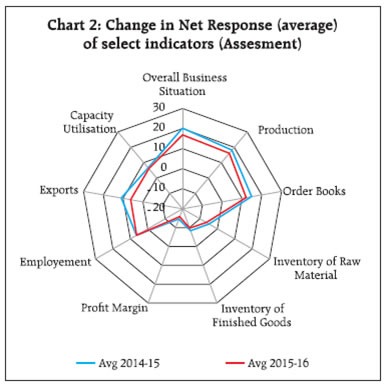
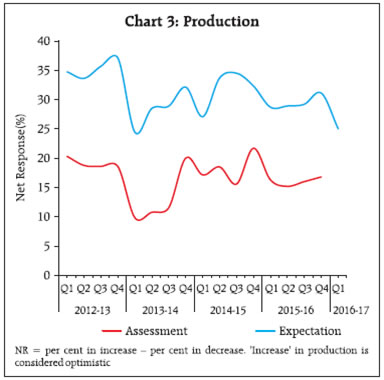
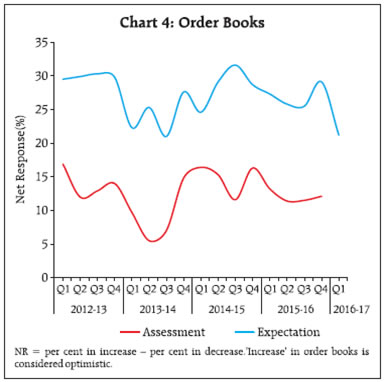
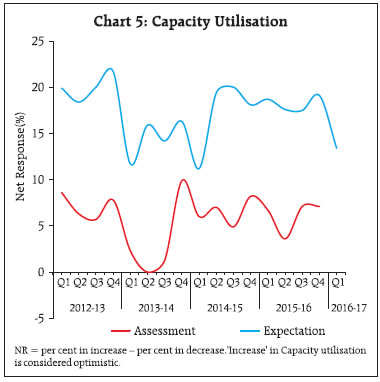
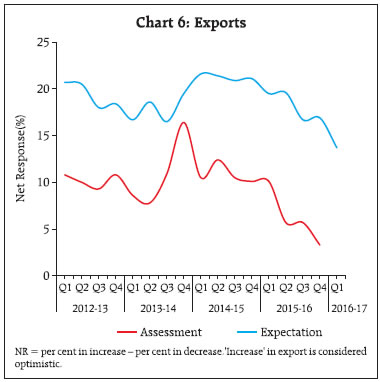
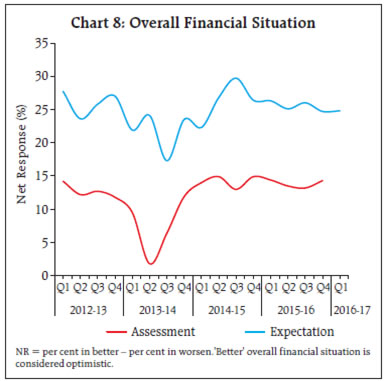
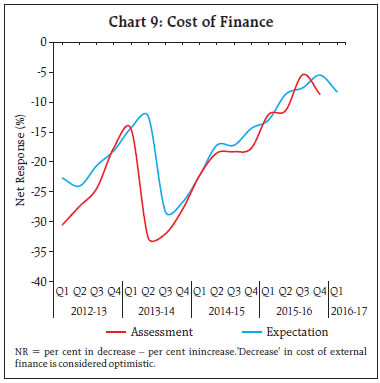
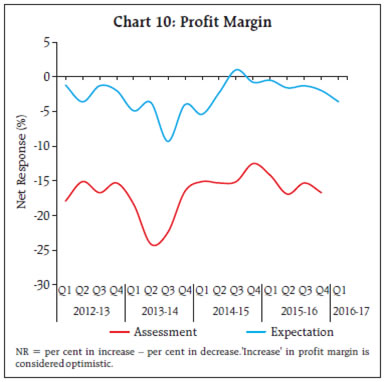
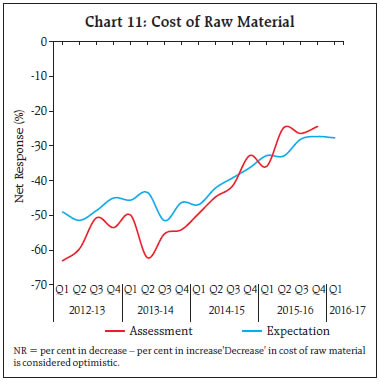
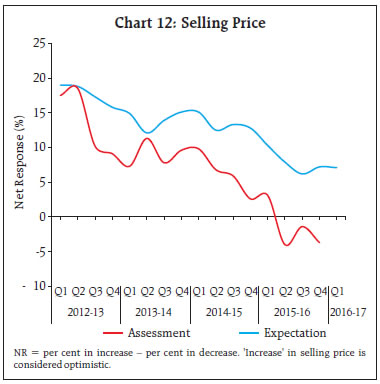
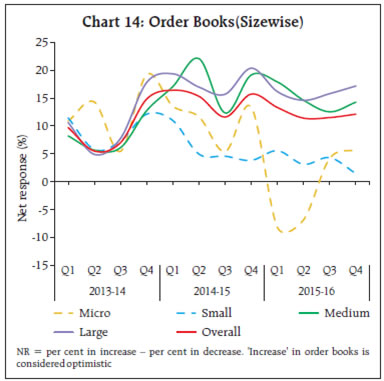
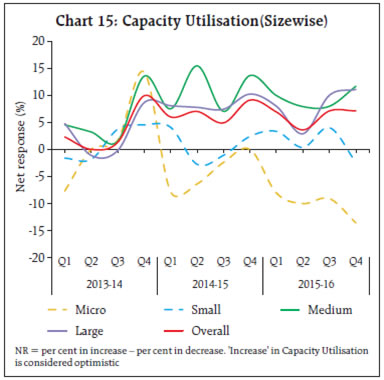
On an annual basis, the 4-quarter average3 BEI for 2015-16 stands at 103.4, which was 105.7 in the previous year. The decline in business situation in the 2015-16, as indicated by BEI is seen across all the nine indicators (which constitute BEI). Significant dips are seen in the indicators ‘overall business situation’, ‘production’, ‘order books’ and ‘exports’(Chart 2). Generally the index based on expectation remains higher than the index based on assessment. The BEI (outlook/expectation) continued to be above the BEI (assessment) in FY:2015-16;however, their gap narrowed in the third quarter of the year and widened subsequently in Q4. On an annual basis, the 4-quarter average BEI (outlook) stood lower at 114.0 in FY: 2015-16 as compared to 114.8 in FY: 2014-15. III. Demand conditions remained sluggish in FY:2015-16 The survey collects perceptions of Indian manufacturers on the demand conditions through various indicators, namely, production, order books, capacity utilisation, level of inventories, exports and imports. For most of the above indicators, outlook during 2015-16 weakened as compared to the corresponding position a year ago. The assessment of production dipped in H1: 2015- 16, partly reflecting seasonality. However, it improved in H2:2015-16. Though the net responses relating to ‘Expectations’ are always higher than that of ‘Assessment’, both the series mostly moved in similar direction (Chart 3). The assessment of order books also declined in H1:2015-16 in line with production and gradually improved in H2: 2015-16. Nevertheless, in absolute sense, the net response for production and order books remained in the positive territory throughout the year, which may be indicative of the stable growth (Chart 4). The outlook on capacity utilisation (CU) reflected similar movement as of production (Chart 5). The net response on capacity utilisation (assessment) also remained in the positive zone since Q3:2013-14. However, it dipped significantly in Q2:2015-16, but bounced back to the 2014-15 level thereafter. Outlook on exports continued to exhibit declining trend from the levels attained in 2014-15. The assessment showed similar movements with a sharp dip in Q2:2015-16 (Chart 6). The outlook on imports declined uniformly throughout FY:2015-16. Going forward, the outlook for Q1:2016-17 continues with lowered optimism (Chart 7). According to the survey, most of the responding firms (about 75 per cent) reported ‘average’ position for the inventory levels of raw material and finished goods on a quarterly basis during FY:2015-16. Of the remaining, on an annual basis, relatively higher percentage of respondents reported with ‘above average’ level of inventory (pessimism) than those reported ‘below average’ (optimism) during FY:2015-16, leading to negative net response levels. IV. Financial situation in FY:2015-16 The survey assesses the financial situation based on several indicators, viz., overall financial situation, availability of finance, cost of external finance, and profit margin. The optimism level in the assessment and expectation of overall financial situation remained flat and hovered in the positive territory in FY:2015-16. As regards availability of finance from different sources like, internal accruals, banks/other financial institutions and overseas, majority of companies (varying in the range of 60-85 per cent for different sources) reported ‘no change’ in the situation. Among the remaining responses, the assessment remained optimistic as more companies indicated better situation than those that felt worsening of situation. Though most of the companies indicated ‘increase’ or ‘no change’ in ‘cost of finance’, the sentiment has improved during 2015-16; although the outlook for Q1:2016-17 indicates marginal moderation (Chart 9). The assessment of ‘profit margin’ remained in the contraction zone. During the year, the assessment followed a downward trend, with a slight improvement in Q3:2015-16 (Chart 10). The outlook (expectation) almost reached the expansion zone in Q1:2015-16, but thereafter went further into the contraction zone. V. Employment and Price Situation The survey seeks views of the companies on employment outlook. Majority (about 70-80 per cent) of companies reported ‘no change’ in the employment level on quarter-to-quarter basis and based on the remaining responses, the optimism level remained high in the first three quarters which dipped in the last quarter. The outlook for Q1:2016-17 indicates further decline in the optimism level. The assessment followed a downward trend consistently throughout the year following the trend in demand outlook. As regards price situation, the survey elicits current assessment as well as one quarter ahead outlook on cost of raw material and selling prices from the respondent companies. The outlook on cost of raw material continued to improve in FY:2015-16 (Chart 11). Although, net response on ‘cost of raw material’ continued to remain pessimistic, the secular (upward) trend is due to lesser percentage of companies assessing and expecting the cost of raw material to rise. The outlook for Q1:2016-17 remains flat. The percentage of respondent reporting ‘decrease’ in the cost of finance and cost of raw material has increased gradually during the year. The net response on selling price continued to witness downward trend during the year. The assessment witnessed a sharper downward trend as compared to the movements of expectation. It entered into the contraction zone in Q2:2015-16 and remained in this territory subsequently (Chart 12). VI. Size-wise Analysis Currently, in the IOS, size-wise categorisation of the respondents is done on the basis of amount invested in plant and machinery. There are four such categories: Micro (for investment upto ₹ 2.5 million), Small (for investment between ₹ 2.5 million and ₹ 50 million), Medium (for investment between ₹ 50 million and ₹ 100 million)4 and Large (for investment more than ₹ 100 million). In the past few rounds, around 4 per cent of the respondents reported as Micro Enterprises, 20 per cent as Small, 35 per cent as Medium and 40 per cent as Large. Net Responses (NR) of these categories were calculated and compared with the overall NR for the select indicators viz., Availability of finance, Production, Order Books, Capacity Utilisation and Selling Price. Large and Medium Enterprises being in majority seem to be driving the overall NR. While Small Companies’ NR by and large track the similar movements, the NR of Micro Enterprises stands out of the others. In assessing Production, while all other NRs were range bound and relatively stable, the sentiments in terms of NR of Micro Enterprises has been following a downward trend since Q4: 2013-14 which finally entered into the contraction zone in Q2:2015-16 (Chart 13). Similar pattern is observed in other demand indicators viz. Capacity Utilisation and Order Books, for which assessment entered into the contraction zone in Q1: 2015-16. Capacity Utilisation shows no signs of a turnaround in 2015-16 (Chart 14 and 15). The sentiments on availability of finance varied widely in case of micro enterprises during the period 2013-16 and witnessed a downward trend between Q2:2014-15 to Q2:2015-16. The other categories viz. small, medium and large enterprises reported steady level of optimism in respect of availability of finance (Chart 16). Interestingly, sentiments on Selling Price showed that the NR for Micro enterprises remained range bound in the positive territory, while NR for larger sized companies continued to decline and crossed over to the contraction zone in FY: 2015-16 (Chart 17). VII. Conclusion The BEI (assessment) remained lower in all quarters as compared to its levels of same quarters of the previous year, FY: 2014-15, indicating a slowdown in the Indian manufacturing activities. All the individual indicators (used for BEI computation) witnessed moderation during FY: 2015-16 over FY: 2014- 15. In particular, the net responses of overall business situation, production, order books and exports showed significant decline in FY: 2015-16 over FY: 2014-15. Going forward, BEI(expectation) for Q1: 2016-17 indicates further sluggishness in the manufacturing sector. Improved sentiments on cost of raw material and cost of finance were observed during FY: 2015-16 alongwith the declining selling price. The net response of profit margin remained in the negative region and decreased further in FY: 2015-16. The sentiments of enterprises in different size segments varied to some extent.
* Prepared in the Division of Enterprise Surveys, Department of Statistics and Information Management. Reserve Bank of India, Mumbai. The latest round of the survey data was released on April 5, 2016 on RBI website and is available at /documents/87730/30842423/IOSQ040416124a4e08b1684b73949143890318ebad.pdf. The survey results are based on reporting by the respondents and are not necessarily shared by the Reserve Bank of India. 1 Net Response is the percentage difference between the optimistic (positive) and pessimistic (negative) responses. 2 The detailed methodology used for the analysis of survey data was published in the article ‘Quarterly Industrial Outlook Survey: Trends since 2000-01’ in the RBI Monthly Bulletin of October 2009. However, for ready reference, the nine indicators considered for computation of BEI are – (1) overall business situation, (2) production, (3) order books, (4) inventory of raw material, (5) inventory of finished goods, (6) profit margin, (7) employment, (8) exports and (9) capacity utilisation. 3 Simple arithmetic average of the net responses of nine business indicators of BEI, over the four quarters of the Financial Year. 4 This classification is in accordance with MSME definition under the MSMED Act, 2006 (source : Annual Reports 2015-16, Ministry of MSME, GoI page 169) |
|||||||||||||||||||||||||||||||||||||||||||||||||||||||||||||||||||||||||||||||||||||||||||||||||||||||||||||||||||||||||||||||||||||||||||||||||||||||||||||||||||||||||||||||||||||||||||||||||||||||||||||||||||||||||||||||||||||||||||||||||||||||||||||||||||||||||||||||||||||||||||||||||||||||||||||||||||||||||||||||||||||||||||||||||||||||||||||||||||||||||||||||||||||||||||||||||||||||||||||||||||||||||||||||||||||||||||||||||||||||||||||||||||||||||||||||||||||||||||||||||||||||||||||||||||||||||||||||||||||||||||||||||||||||||||||||||||||||||||||||||||||||||||||||||||||||||||||||||||||||||||||||||||||||||||||||||||||||||||||||||||||||||||||||||||||||||||||||||||||||||||||||||||||||||||||||||||||||||||||||||||||||||||||||||||||||||||||||||||||||||||||||||||||||||||||||||||||||||||||||||||||||||||||||||||||||||||||||||||||||||||||||||||||||||||||||||||||||||||||||||||||||||||||||||||||||||||||||||||||||||||||||||||||||||||||||||||||||||||||||||||||||||||||||||||||||||||||||||||||||


આ પેજ શેર કરો:


રિઝર્વ બેંક ઑફ ઇન્ડિયા મોબાઇલ એપ્લિકેશન ઇન્સ્ટૉલ કરો અને લેટેસ્ટ ન્યૂઝનો ઝડપી ઍક્સેસ મેળવો!


