 IST,
IST,


Managing Exchange Rate Volatility in the Time of COVID-19
In the wake of outbreak of COVID-19, emerging market currencies witnessed considerable volatility. In response to the Reserve Bank’s conventional and unconventional tools including forex market interventions, volatility, measured by a variety of indicators, normalised quickly after the surge in March and remained lower than in stress episodes in the past. Introduction In the wake of the outbreak of COVID-19, the unprecedented policy response and the heightened uncertainty worldwide, large swings in prices of various asset classes such as currency, bond, equity and credit were observed. Emerging market currencies in particular, witnessed considerable volatility, beginning with large risk-off outflows in March 2020 exerting massive depreciation pressure (OECD, June 2020), including on the Indian Rupee (INR), the worst sell-off in equity markets since the Global Financial Crisis (GFC) and record lows in long-term bond yields in many advanced countries. Global growth was revised down repeatedly by the International Monetary Fund (IMF), World Bank and the rating agencies in the first half of the year, with downgrades of the employment and demand outlook. International crude oil prices crashed to historic lows in April due to a collapse of demand. In the months following the outbreak of the pandemic, the Reserve Bank deployed several conventional and unconventional tools in order to ensure financial stability and orderly conditions in financial markets. The Reserve Bank’s policy on the exchange rate of the rupee has been to allow it to be determined by market forces, with interventions only to maintain orderly market conditions by containing excessive volatility in the exchange rate, without reference to any pre-determined target level or band. Disorderly movements in the exchange rate can often have a deleterious impact on trade and investment, besides endangering overall macroeconomic and financial stability (Janak Raj, et al. 2018). Short term exchange rate variability has been found to influence Foreign Direct Investment (FDI) flows (Goldberg, 2009). The logic is that investors require compensation for risks that exchange rate movements introduce, altering expected returns on investment. If exchange rates are highly volatile, the expected values of investment projects are reduced, and FDI slows down accordingly. Trade-deterring effect of real exchange rate volatility has also been found, as the value of exports by firms as well as their probability of entering new export markets decrease for destinations with higher exchange rate volatility (Hericourt et al, 2013). Another study highlighted that when there is an unexpected fluctuation in exchange rates, exporters adjust to the change in the level of risk either by increasing export prices or by decreasing trade volumes, but often prefer to directly reduce trade volumes rather than increase prices (Cheong et al, 2005). In a recent study for India, it was observed that realised volatility (historical volatility) in USD-INR is a key component of the Financial Stress Index (FSI), which in turn has statistically significant negative correlation with the Index of Industrial Production (IIP) and can act as a leading indicator for predicting IIP (or real economic activity) (Manjusha, et al. 2020). In the past, high FSI values were observed in well-known stress events in 2008, 2011, 2013, etc., which were also characterised by low IIP values (and high INR realised volatility). Thus, realised volatility of USD-INR can be an important indicator, along with other indicators, in predicting real economic activity. Against this backdrop, this article attempts to assess the efficacy of the Reserve Bank’s measures in containing exchange rate volatility. The rest of the article is divided into five sections. Section II discusses the impact of COVID-19 pandemic on the INR exchange rate vis-à-vis US Dollar. Section III deals with the measures undertaken by the Reserve Bank to curb the INR volatility. Section IV deliberates on efficacy of the forex market intervention measures taken to contain the volatility in terms of actual path treaded by the INR vis-à-vis market expectations. Section V dwells upon the cross-country comparison of forex market intervention. Section VI summarises the findings. II. Impact of COVID-19 Pandemic on the INR As in previous episodes of extreme volatility in financial markets, viz., GFC, the Eurozone crisis and the Taper Tantrum event, COVID-19 led to large forex outflows from all emerging markets. India experienced unprecedented Foreign Portfolio Investment (FPI) outflows (debt and equity) of US$15.92 billion in March 2020, after recording cumulative inflows of US$1.42 billion in January 2020 and February 2020, with high volatility in the INR (Chart 1). Daily depreciation of up to 1 per cent was observed on multiple occasions during March, with a fall of 1.29 per cent on March 23, 2020. 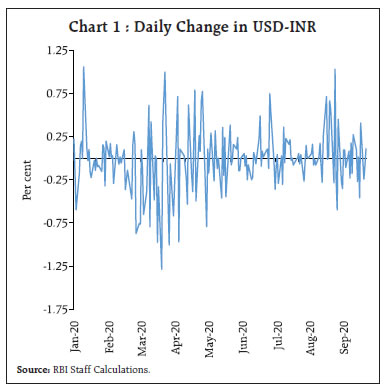 On a year-to-date basis, the INR exhibited a cumulative depreciation of 7.13 per cent, closing at an all-time low of 76.86 on April 16, 2020 (Chart 2).  In the pre-COVID period, foreign investors employed carry trade strategies successfully, given the decent interest rate differentials between Emerging Market Economies (EMEs) and advanced economies. The strategy worked well for funding currencies (mainly USD) (in violation of covered interest rate parity), when volatility was low. The carry-to-volatility ratio, which is an ex-ante risk adjusted return measure (ratio of interest differential between two currencies to volatility) was hovering around its 1-year average of 0.76 (Chart 3). With the abrupt increase in volatility, the ratio fell quickly, indicating a high probability of unwinding of carry trade strategies after March. The ratio, however, has increased thereafter as implied volatility has reduced. Foreign investors look for opportunities when the ratio is high. 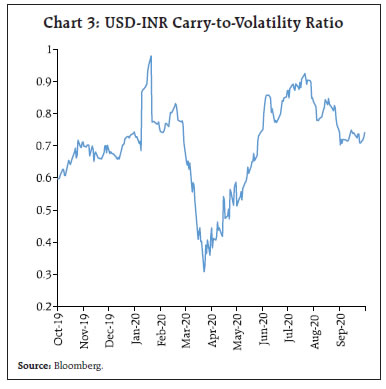 III.1 Economy-wide Measures As the pandemic posed a serious threat to financial stability and the real economy, the Reserve Bank’s response was ‘do whatever is necessary to shield the economy’ (Tobias Adrian, et al, 2020). These measures by the Reserve Bank boosted investors’ sentiment and helped in assuaging worries of the markets (RBI Monetary Policy Report, 2020). As risk appetite of investors improved, the intensity of FPI outflows reduced considerably in April and May 2020 (net outflows of US$1.96 billion and US$0.97 billion respectively), taking some pressure off the INR. The Reserve Bank curtailed timings of interbank forex transactions (along with other market segments) on April 3, 2020 in order to minimise the operational and logistic risks resulting from thinning out of market activity. The move resulted in reduction in volume of spot transactions, although they have recovered since then (Chart 4).  III.2 Specific Measures to Curb Volatility The Reserve Bank undertook specific measures to curb volatility in the INR. The Reserve Bank intervened by selling USD in the Over-the-Counter (OTC), exchange traded and offshore market segments. Intervention by the Reserve Bank in March 2020 resulted in containment of surging volatility (1 month at-the-money option Implied Volatility) and reduced depreciation pressures on the INR. Subsequently, buy-side intervention was undertaken from April-end onwards on account of sporadic FPI inflows, which further helped reduce volatility to pre-intervention levels (Chart-5). 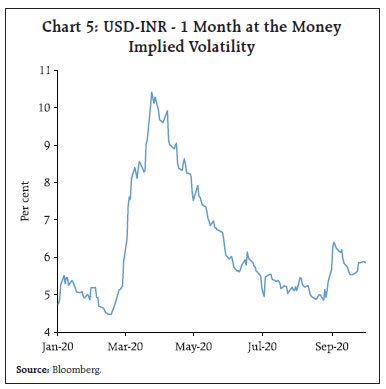 The Reserve Bank also undertook two USD-INR sell-buy swaps for a tenor of six months each in March 2020 to provide dollar liquidity to the market. The swaps helped to reduce shortage of dollar liquidity faced by market participants towards the end of the financial year. IV. Efficacy of Interventions in Forex Market 1-month ATM option implied volatility (IV) of the USD-INR exchange rate started increasing since the beginning of March 2020, reflecting higher uncertainty expected by market participants (Chart 5). In response to the Reserve Bank’s interventions on multiple fronts from March 4, 2020, the INR moved in the middle of volatility bands1 (importantly in the narrower 1-volatility band) during most of the period (March 4-September 30), which implies that realised volatility of the INR was substantially lower than the expectation-based IV (Chart 6).   High volatility was also observed in intraday movements of the INR in the months of March and April (Chart 7). An alternative method to examine the efficacy of interventions is by comparing actual INR movements vis-à-vis the historical average of IV. The 2-year average of daily 1-month ATM IV is 6.12 per cent (March 5, 2018- March 3, 2020), which predicts narrower ranges for prospective INR movements. If the INR band is plotted using historical IV values and the closing INR value of 73.29 on March 3 (just a day before the Reserve Bank started intervention), a rate corridor is arrived at in which the INR is predicted to move, based on a conservative IV value (Chart 8).  It can be seen that actual INR movement has been below or around the upper bound (lower range) of the band on majority of the days during the period in 2-volatility band. INR treaded above the lower range (higher absolute values) of the more conservative 1-volatility band in the months of March and April. However, the INR started to stabilise around or below the lower range from May 2020 onwards. The Reserve Bank undertook buy-side intervention towards end-April after sell-side intervention in March, as the direction of flows was mixed in April. Consequently, volatility remained at high levels. In this context, the judicious use of sell-side as well as buy-side interventions helped smooth volatility from May 2020 onwards. Thus, the INR treaded a path based on a conservative 2-year average IV, dispelling fears of large depreciation (as reflected by high IV values March 2020 onwards). A general hardening of forward premia was witnessed across the tenors towards March-end, with sharp spikes in near-month tenors. Consequently, the Reserve Bank undertook two buy-sell swaps in March end. Forward premia softened after March. (Chart 9). 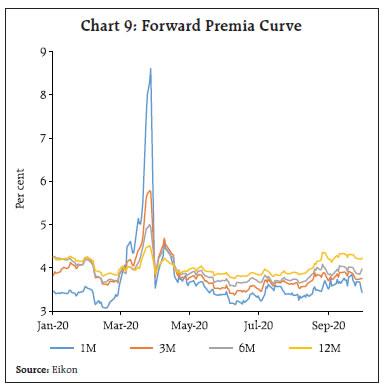 In the past, historical volatility2 (1-month) of the INR has undergone periodic upsurges during 2008-09, 2011-12, 2013-14 and 2018-19. It reached a peak of 24.73 per cent in September 2013 (Chart 10). In comparison with realised volatility in the pre-COVID periods, a clear ebbing of volatility is evident (Chart 11). Even if only the peak period, viz., March-April 2020 is considered, realised volatility averaged 7.71 per cent, which is also the least among high volatility episodes. V. Cross-Country Comparison of Intervention EMEs’ currencies were hit hard by the global market sell-off, when COVID-19 broke out exhibiting high levels of volatility as some of them fell to record lows. Consequently, most EME central banks intervened in the forex market (Chart 12). India’s intervention in March 2020 (i.e. decline in forex reserves in March over February) as a share of total forex reserves at end-February was 1.43 per cent as against 7.61 per cent for Indonesia and 2.19 per cent for South Korea. 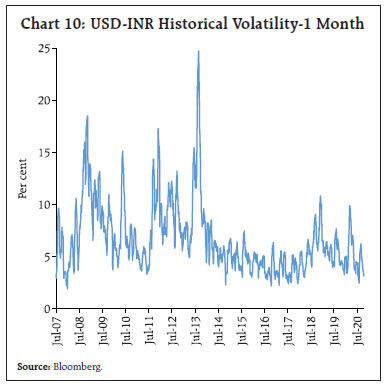 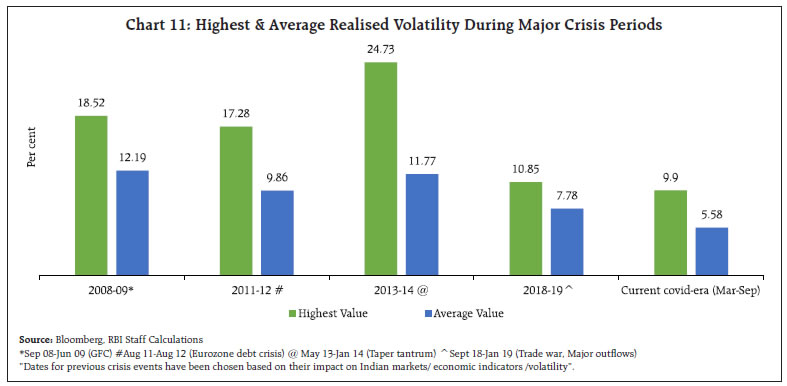 Implied volatilities or risk reversal (RR)3 - difference between implied volatilities of out-of the money call and put options (25 Delta) on the currency pair – rose in March 2020 for all Asian peer currencies. In the case of the INR, RR came down from a high of 4.14 in March and remained consistently around 1 subsequently, which indicates reduced depreciation expectations on the INR (Chart 13). 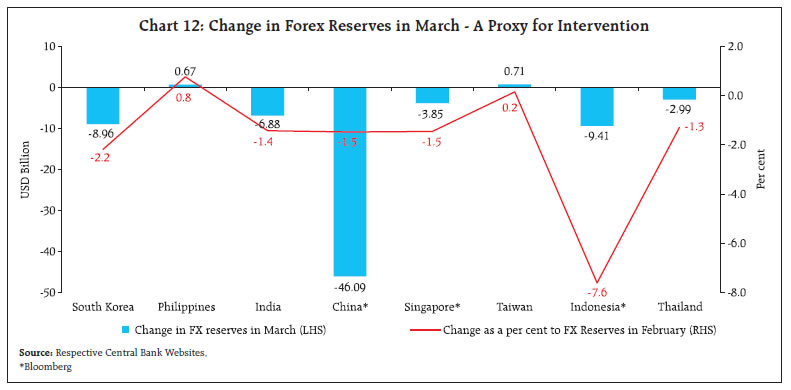  Forex market interventions, along with other monetary and regulatory measures have helped curb exchange market volatility and mitigated potential threats to financial stability. Volatility, measured by a variety of indicators, normalised quickly after the surge in March and remained lower than in stress episodes in the past. This is also reflected in a cross-country comparison. References: OECD. (2020, June). Report to G20 International Financial Architecture Working Group, COVID-19 and Global Capital Flows Janak Raj, Sitikantha Pattanaik, Indranil Bhattacharya and Abhilasha. (2018, August). Reserve Bank of India. Monthly Bulletin. Forex Market Operations and Liquidity Management. Linda S. Goldberg (2009). Federal Reserve Bank of New York. Exchange Rates and Foreign Direct Investment. Jerome Hericourt, Sandra Poncet. (2013). Exchange Rate Volatility, Financial Constraints and Trade: Empirical Evidence from Chinese Firms. Chongcheul Cheong, Tesfa Mehari, Leighton Vaughan Williams. (2005, November). The effects of exchange rate volatility on price competitiveness and trade volumes in the UK: A disaggregated approach, , Journal of Policy Modeling, Volume 27, Issue 8. Manjusha Senapati, Rajesh Kavediya (2020, September). RBI Working Paper Series. Measuring Financial Stress in India. Tobias Adrian, Fabio Natalucci. (2020, April). IMF Blog. COVID-19 Crisis Poses Threat to Financial Stability. Monetary Policy Report. (2020, October). Reserve Bank of India. * This article has been prepared by Radha Shyam Ratho, Vikram Rajput and Sabyasachi Sarangi of Financial Markets Operations Department, Reserve Bank of India. The views expressed in this article are those of the authors and do not represent the views of the Reserve Bank of India. 1 1-vol and 2-vol INR bands have been constructed using predicted INR values (upper and lower bound) for next day, on the basis of day’s closing INR value (vis-à-vis USD) and implied volatility values available in Bloomberg. 2 Realised volatility is calculated by annualising the standard deviation of periodic logarithmic returns over the historic time horizon (values available in Bloomberg). 3 Positive values imply bullish outlook on the USD vis-à-vis the other currency in the pair. Further, higher the absolute value, higher the expectations of price movement. In a nutshell, depreciation in all Asian peer currencies vis-à-vis the USD was anticipated. |

આ પેજ શેર કરો:


રિઝર્વ બેંક ઑફ ઇન્ડિયા મોબાઇલ એપ્લિકેશન ઇન્સ્ટૉલ કરો અને લેટેસ્ટ ન્યૂઝનો ઝડપી ઍક્સેસ મેળવો!
અમારી એપ ઇન્સ્ટોલ કરવા માટે QR કોડ સ્કેન કરો


પેજની છેલ્લી અપડેટની તારીખ:


