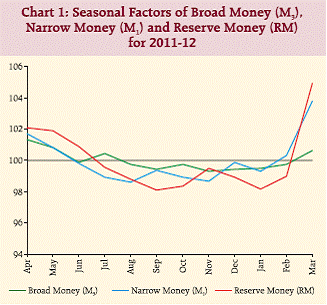
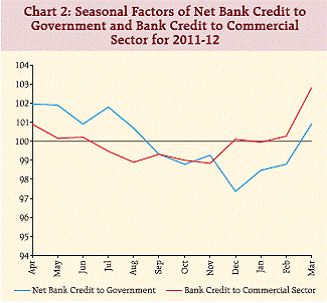
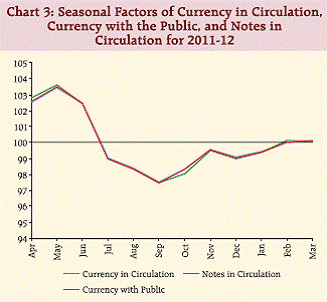
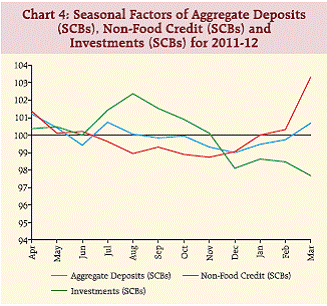
Monthly Seasonal Factors of Selected Economic Time Series* Analysis of seasonal behaviour of economic time series is considered important by the policy makers, as it enables them to differentiate from those behaviours, which are long-run in nature. This article presents the estimated monthly seasonal factors of selected 99 economic/financial time series taken from broad sectors, namely, Monetary and Banking; Price; Industrial Production; External Trade and Services sector, covering the period 2002-03 to 2011-12. The estimated seasonal factors and the variation over the time revealed that seasonal variations of M3, Currency in circulation and M1 declined gradually. However, the seasonal variations of Reserve Money (RM) increased in recent years. For Scheduled Commercial Banks, the seasonal variation of Non-Food Credit and Investments exhibited upward movement in the recent years, but the seasonal variation of Aggregate Deposits decreased. Within Aggregate Deposits, Demand Deposits exhibited higher seasonal fluctuations than Time Deposits. Among the price related series, seasonal variation for WPI-All Commodities remained low and exhibited steady decline in recent years. The variation in seasonality for WPI-Primary Articles was much higher than that of WPI-Manufactured Products. For WPI-Fuel and Power group, no significant seasonality was observed. However, the subgroup of freely priced product (excluding petrol) showed significant seasonal variations. Seasonal variation of CPI-IW was stable in the recent years but consistently higher than in WPI-All Commodities and marginally lower than CPI-AL and CPI-RL. With respect to production data, seasonal variation of IIP-General Index has been increasing steadily over the time. The seasonal peak of IIP-General, sectoral and use-based group indices occurred in March every year. The seasonal trough, however, occurred in different months. Among the usebased classification of IIP, ‘Capital Goods’ and ‘Intermediate Goods’ showed the highest and lowest seasonal variations, respectively. During 2011-12, 45 out of 99 select series had registered their seasonal peak in March. In terms of seasonal variations, over the last five years, the top five series are ‘IIP-Office, accounting and computing machinery’, ‘IIP-Food products and beverages’, ‘Coal Production’, ‘WPI-Potatoes’, and ‘WPI-Onions’; and bottom five series are ‘WPI- Manufactured Products’, ‘WPI-All Commodities’, ‘WPI-Non Food Manufactured Products’, ‘WPI-Food Products’, and ‘WPI-Milk’. 1. Introduction 1.1 Economic time series, when measured at an interval of less than a year, exhibit seasonal fluctuations around its annual trend path. Such repetitive seasonal variations can result from climatic conditions, production cycle characteristics, seasonal nature of economic activity, festivals, vacation practices, etc. While the seasonal variations occur regularly, yet they may vary in magnitude from year to year. Analysis of the direction and magnitude of seasonal fluctuations is useful in interpretation of movements in economic variables over time. Seasonal adjustment, i.e., removal of seasonal effects from a time series, helps to differentiate between the seasonal changes and longrun changes in the variable and therefore, is useful from the policy perspective in understanding the underlying economic phenomenon. Moreover, understanding about the predictable recurring of seasonal fluctuations also allows the economic agents to set up policies or measurements to attenuate the impact. Thus, seasonal ups and downs of some series have significant implications for an economic agent to stabilise the economic activities during the year. Therefore, analysis of seasonal factors of high frequency data has, over the years, become essential for policy design. In this backdrop, monthly seasonal factors for selected economic and financial time series of the Indian economy are regularly published in the Reserve Bank of India Bulletin from 1980 onwards1. 2. Data Coverage and Methodology 2.1 For estimating and analysing the seasonal factors, 99 monthly economic/financial time series covering broad sectors, namely, Monetary and Banking; Price; Industrial Production; External Trade and Services Sector have been considered in this article as compared with 95 series covered in the previous article published in September 2011 issue of the RBI Bulletin. The variables are categorised as follows (figures in brackets indicate the selected number of series): A. Monetary and Banking Indicators (20 series); B. Wholesale Price Index (WPI) (29 series); C. Consumer Price Index (CPI) (3 series); D. Industrial Production (37 series); E. Services Sector Indicators (8 series); F. External Trade (2 series). The coverage of the series has changed due to addition of two new series in WPI, one new series in Industrial Production, and six new series relating to Service Sector Indicators, along with the reduction of two series in Monetary and Banking Indicators, two series in Index of Industrial Production (IIP) and one series in External Trade. The list of selected economic/ financial time series for various categories of variables along with sources and selected models used for estimating their seasonal factors are given in Annex. The new IIP (base: 2004-05=100) starts from April 2005; hence, linking factor was used to compute back series for the period April 1994 to March 2005 for overall IIP, sectoral and use-based IIP classes. Also, the seasonal factors for five production series of core infrastructure industry sector (the subsector of industrial production, viz., Cement, Steel, Coal, Crude Oil and Petroleum Refinery), along with ‘Production of Commercial Motor Vehicles’ and ‘Production of Passenger Vehicles’ have been estimated since April 1994. However, the two series relating to core infrastructure industries, viz., Natural Gas and Fertilizers; and 18 industries based on 2-digit NIC classification in the IIP series were analysed since April 2005 onwards. It may be noted that the seasonal factors for the short series, whose reference period is less than ten years, are likely to get revised in the later years on account of the changes in the model and recognition of previously undetected breaks2. 2.2 Among the price related series, two new series, viz., ‘WPI-Non-Food Manufactured Products’ and ‘WPINon- Food Non-Fuel’ along with other 27 series belonging to WPI group (with base year 2004-05) were analysed for the period April 1994 to March 2012. Further, the seasonal variations in three CPI series viz., ‘CPI-Agricultural Labourers’ (base: 1986-87=100), ‘CPIRural Labourers’ (base: 1986-87=100) and ‘CPIIndustrial Workers’ (base: 2001=100) were also analysed. From the external trade category, two series, viz., Exports and Imports, in US dollar terms were analysed. 2.3 The seasonal factors have been estimated using ‘Auto-model’ utility function in the X-12-ARIMA software package, developed by the US Bureau of Census3, taking care of major festivals/national holidays as well as trading day effects. The seasonality of the series is further subjected to parametric and nonparametric statistical test procedures for their statistical significance. The monthly seasonal factors (a) for the year 2011-12, (b) the average over the ten years period, for long series; and reference period for short series, as described in para 2.1 and (c) the forecasts for 2012- 13, along with the peak and trough values of the seasonal factors and their respective months of occurrence are presented in Table 1. Annual estimates of dispersion in seasonal factors, in terms of range (difference between peak and trough values), over the time, are presented in Table 2. The peak/trough months and classification of variables as per range observed in the seasonal factors during 2011-12, are provided in Table 3 and Table 4, respectively. The list of top-twenty and bottom-twenty series based on the average range of monthly seasonal factors, during the last five years (i.e., 2007-08 to 2011-12), and the corresponding peak and trough months are presented in Table 5. The salient features of observed seasonal factors and their variation over the reference period for some selected series during the last ten years in general, and for 2011-12 in particular, are briefly discussed in the following sections. 3. Salient Features 3.1 Monetary and Banking Aggregates As part of Monetary and Banking aggregates, 20 important indicators were selected for analysis of the intra-year seasonal variations over the reference period (Table 1). 3.1.1 Seasonal Factors during 2011-12 3.1.1.1 The seasonal factors of Reserve Money (RM) and Narrow Money (M1) had their peak in March, whereas, Broad Money (M3) had peak in April. The trough of RM, M1 and M3 occurred in September, August and November, respectively. The seasonal variation of RM was higher as compared to M1 and M3 (Table 1 and Chart 1). 3.1.1.2 Among the sources side of M3, Net Bank Credit to Government exhibited seasonal peak and trough in April and December, respectively, whereas, Bank Credit to Commercial Sector had peak and trough in March and November, respectively (Table 1 and Chart 2). 3.1.1.3 During 2011-12, the seasonal factors of ‘Currency with the Public’, ‘Currency in Circulation’ and ‘Notes in Circulation’ showed similar movements with seasonal peak and trough occurring in May and September, respectively (Table 1 and Chart 3). 3.1.1.4 During 2011-12, the peak of Aggregate Deposits and Non-Food Credit of Scheduled Commercial Banks (SCBs) occurred during April and March, respectively, whereas, the trough occurred during December and November, respectively (Table 1 and Chart 4). The seasonal peak and trough of Investments (SCBs) occurred during August and March, respectively.
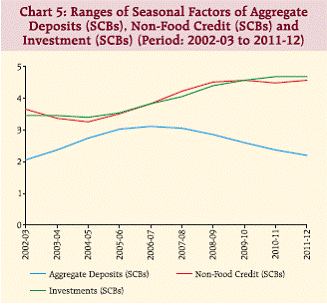
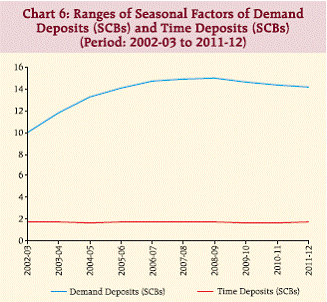
3.1.2 Seasonal Variation during Last Ten Years (2002-03 to 2011-12) 3.1.2.1 Over the years, the intra-year seasonal variations, measured in terms of range, i.e., the difference between peak and trough values of seasonal factors, of Non-Food Credit (SCBs) and Investments (SCBs) exhibited similar movements; having reached a low during 2004-05, and an upward movement thereafter. However, the seasonal variation of Aggregate Deposits (SCBs) decreased since 2007-08 (Table 2 and Chart 5). The seasonal variation in Aggregate Deposits (SCBs) was lower as compared with those in Non-Food Credit (SCBs) and Investments (SCBs) during the reference period. 3.1.2.2 Seasonal variation in M3 has been observed to be lower than that for Currency in circulation, M1 and RM over the years. After showing an upward movement till 2006-07, the seasonal variations of M3 and M1 declined gradually; while RM tended to increase after a dip in 2007-08. The average range of seasonal factors in Aggregate Deposits (SCBs) was relatively lower, as compared with M3 (Table 2). 3.1.2.3 During 2002-03 to 2011-12, Demand Deposits of SCBs have shown higher seasonal fluctuations than that of Time Deposits, which remain stable within the narrow band of 1.6 to 1.8 (Table 2 and Chart 6). The seasonal factors of Demand Deposits rose gradually till 2008-09 and started declining steadily thereafter. 3.2 Price Indices 3.2.1 In order to investigate the seasonal movements of the price indices over the reference period, both Wholesale Price Indices (WPI) and Consumer Price Indices (CPI) were considered. From WPI (base: 2004-05) group, 29 important series (commodities) were selected including food articles like cereals, wheat, rice and pulses. Seasonal factors for major groups like Primary Articles, Manufactured Products and Non-Food Manufactured Products were also estimated. As regards CPI measure, three series based on occupations, viz., CPI-Agricultural Labourers (CPI-AL), CPI-Rural Labourers (CPI-RL) and CPI-Industrial Workers (CPI-IW) were selected. The new series on CPI-Urban, CPI-Rural and All India CPI could not be considered due to nonavailability of long time series data.
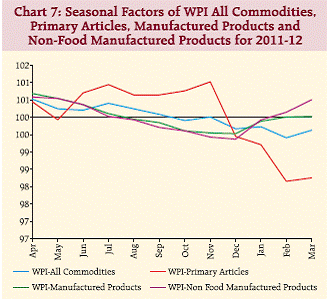
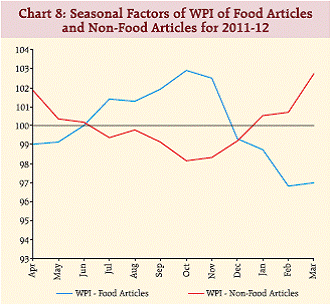
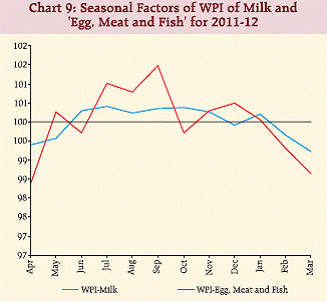
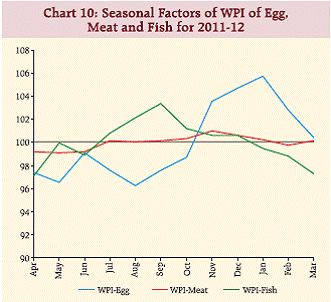
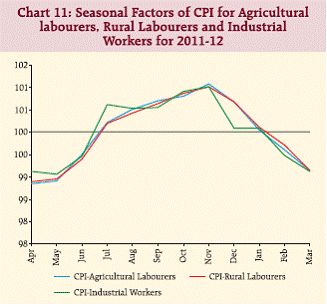
3.2.2 Seasonal Factors during 2011-12 3.2.2.1 The seasonal factors of WPI All Commodities (base: 2004-05=100) registered peak in April and trough in February. In case of the two main groups viz., ‘Manufactured Products’ and ‘Primary Articles’, the peak occurred in April and November, respectively, whereas the trough occurred during December and February, respectively. The seasonal variation in ‘Manufactured Products’ prices was relatively much lower, as compared to ‘Primary Articles’. The WPI Non- Food Manufactured Products showed similar seasonal movement as that of WPI-Manufactured Products, but displayed higher seasonality than WPI Manufactured Products during February and March. The seasonal peak and trough of WPI-Non-Food Manufactured Products occurred in April and December, respectively (Table 1 and Chart 7). 3.2.2.2 Within the WPI-Primary Articles group, the seasonal peak of the prices for Food Articles and Non- Food Articles occurred during October and March, respectively, whereas, the trough occurred in February and October respectively (Table 1 and Chart 8). During July to November, the seasonal factors of WPI-Non Food Articles were observed to be lower than that of WPIFood Articles. The seasonal variation of WPI-Food Articles was higher than that of WPI-Non-Food Articles during the year. 3.2.2.3 Among the selected protein group in the WPI basket (comprising pulses, milk, egg, meat and fish), the seasonal peak and trough of ‘WPI-Milk’ occurred in July and March, respectively. In case of ‘WPI-Egg, Meat and Fish’, the peak and trough were observed in September and April, respectively (Table 1 and Chart 9). 3.2.2.4 Within the protein items of ‘WPI-Egg, Meat and Fish’ group, the prices of Egg and Fish revealed opposite seasonal movements. The seasonal peak of WPI-Egg and WPI-Fish occurred in January and September, respectively, whereas, the trough occurred in August and April, respectively. WPI-Meat had the seasonal peak and trough in November and May, respectively (Table 1 and Chart 10). 3.2.2.5 During 2011-12, the Consumer Price Index (CPI) for both Agricultural and Rural Labourers observed similar pattern of seasonal movements. CPI-AL, CPI-RL and CPI-IW had seasonal peak in November, whereas, the trough for CPI-AL and CPI-RL occurred in April and for CPI-IW in May (Table 1 and Chart 11).
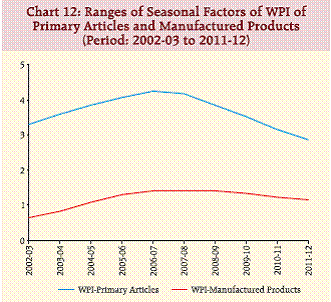
3.2.3 Seasonal Variation during Last Ten Years (2002-03 to 2011-12) 3.2.3.1 The range (i.e., difference between peak and trough values) of seasonal factors of WPI-All Commodities increased from 1.1 in 2002-03 to 1.5 in 2007-08, and thereafter, witnessed a steady decline to 1.1 again in 2011-12 (Table 2). 3.2.3.2 Between the two broad groups of WPI-All Commodities, viz., WPI-Primary Articles and WPI Manufactured WPI Manufactured Products, the range of seasonal factors for Primary Articles prices was more than double the seasonal fluctuations in the WPI-Manufactured Products. However, the intra-year seasonal variation in these two price series had narrowed down substantially during the last three years (Table 2 and Chart 12). Seasonal variation in WPI-Manufactured Products group was low but has been showing an increasing trend due to seasonal behavior of WPI-Food products. For WPI-Fuel and Power group, no significant seasonality was observed. However, the subgroup of freely priced product (ex-petrol) showed significant seasonal variations.
 |
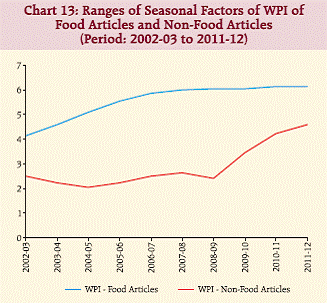
3.2.3.3 Within the Primary Articles group, the intra-year seasonal variation in WPI of ‘Food Articles’ over the period 2002-03 to 2011-12 have increased from 4.1 in 2002-03 to 6.1 in 2011-12. Though the seasonal variation of WPI-Non Food Article was lower than that of Food Article over the reference period, the difference has narrowed since 2008-09 (Table 2 and Chart 13).
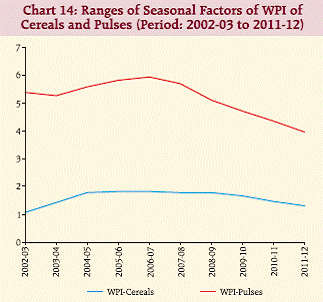
3.2.3.4 Within the Food Articles, the Pulses group displayed more seasonal variation than the Cereals group. From 2009-10 onwards, the WPI-Cereals showed marginal decline in seasonal variation after remaining stable at around 1.8 during 2004-05 to 2008-09. However WPI-Pulses showed declining trend from 2007-08 onwards (Table 2 and Chart 14).
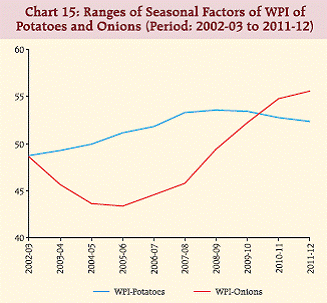
3.2.3.5 Among the Food Articles group, the prices of ‘Fruits and Vegetables’ group exhibited high seasonal variation, with the average range of 18.3 during the last ten years period. The seasonal variation of ‘WPIFruits and Vegetables’ declined from 19.4 in 2005-06 to 17.5 in 2011-12. Among the ‘Fruits and Vegetables’ group, the seasonal variation of ‘Potatoes’ prices showed an increasing trend till 2008-09 and declined steadily thereafter. In the case of ‘Onions’ price, the seasonal variation increased steadily from 2006-07 and exceeded the variation in ‘Potatoes’ in the last two years (Table 2 and Chart 15).
 |
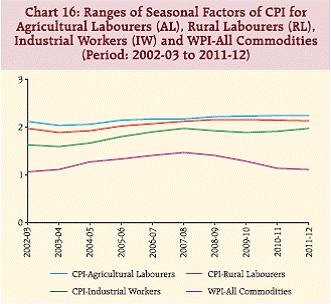
3.2.3.6 In the case of CPI for Agricultural and Rural labourers, similar movement in seasonal variations was observed during the last ten years with CPI-Agricultural labourers having slightly higher variation than the CPI Rural Labourers. The seasonal variation of CPI-IW was consistently higher than that of WPI-All Commodities. The difference between the seasonal variations of the two series had however, widened during the period 2009-10 to 2011-12. Among the four price series, the seasonal variation in CPI-AL was observed to be the highest and WPI-All Commodities the lowest (Table 2 and Chart 16).
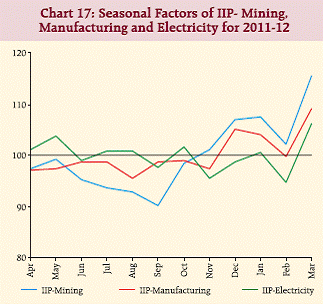
3.3 Index of Industrial Production (IIP) 3.3.1 In the case of IIP (base: 2004-05=100), both sectoral and use-based classifications were considered for analyzing the intra-year seasonal variation for the period ‘April 2002 to March 2012’. Among the 22 manufacturing industry groups of sectoral classification of IIP, 18 industry groups, exhibited significant seasonality during the reference period. 3.3.2 Seasonal Factors during 2011-12 3.3.2.1 The seasonal factors for IIP-General Index had observed its peak in March and trough in August during 2011-12 (Table 1). The seasonal peak of most of the industrial production series occurred in March, whereas the seasonal trough varied over February, May, August and September. Manufacturing sector, the major component of IIP, exhibited its seasonal peak in March during 2011-12, and trough in August (Table 1 and Chart 17). The other two sectors, viz., Mining and Electricity, exhibited peak in March and trough in September and February, respectively.
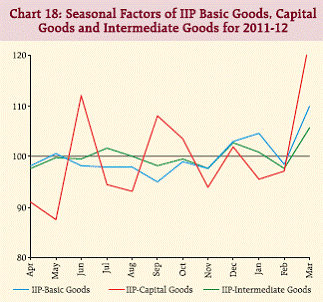
3.3.2.2 In respect of use-based classification, IIP of Basic Goods, Capital Goods and Intermediate Goods industries exhibited peak in March but these industries exhibited trough in the months of September, May, and February, respectively (Table 1 and Chart 18). Among these three industrial groups, the seasonal fluctuation was highest in respect of Capital Goods.
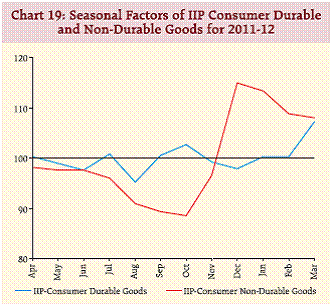
3.3.2.3 The peak of IIP Consumer Durable and Consumer Non-Durable Goods occurred in March and December, respectively, whereas, trough occurred in August and October, respectively (Table 1 and Chart 19).
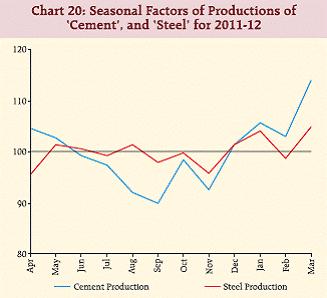
3.3.2.4 During 2011-12, Cement and Steel production exhibited high degree of seasonal fluctuations. The seasonal peak of both the series occurred in March, whereas, the trough occurred in September and April, respectively (Table 1 and Chart 20).
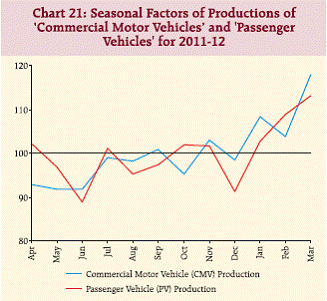
3.3.2.5 The seasonal peak of ‘Commercial Motor Vehicle Production’ and ‘Passenger Vehicle Production’ occurred in March, whereas, the trough occurred in May and June, respectively. The seasonal factors of both the series exhibited increasing trend during December to March months (Table 1 and Chart 21)
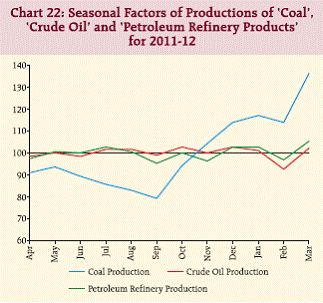
3.3.2.6 During 2011-12, the seasonal factors of Coal Production and Petroleum Refinery Production had their seasonal peak and trough in March and September, respectively; whereas, for Crude Oil Production the seasonal peak and trough occurred in December and February, respectively. Crude Oil Production and Petroleum Refinery Production revealed similar pattern of seasonal movements and the seasonal variation of Coal Production was higher than that of the other two series (Table 1 and Chart 22).
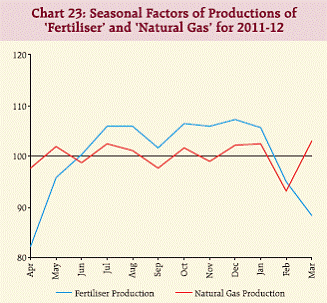
3.3.2.7 The seasonal movement of Fertiliser Production exhibited peak and trough in December and April, respectively. In case of Natural Gas Production, the seasonal peak and trough occurred in March and February, respectively (Table 1 and Chart 23). The seasonal factors of Fertiliser Production were higher than that of Natural Gas Production except during the months of March to May.
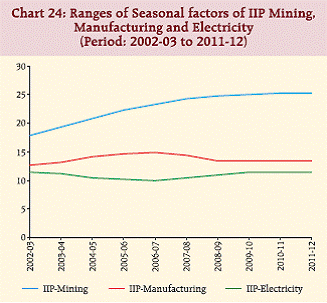
3.3.3 Seasonal Variation during Last Ten Years (2002-03 to 2011-12) 3.3.3.1 Seasonal variation of IIP-General Index exhibited upward movement during the reference period. During the last five years i.e., from 2007-08 to 2011-12, the range of seasonal variation varied within a narrow band of 13.8 to 14.0. Among the three major sectors of IIP, viz., Mining, Manufacturing and Electricity, IIP-Mining exhibited the highest seasonal variation, whereas, IIPElectricity exhibited the lowest (Table 2 and Chart 24). During the period 2002-03 to 2007-08, the seasonal variation of IIP-Mining increased marginally and remained stable thereafter. However, the seasonal variations of IIP-Manufacturing industries had shown moderate decline during the last five years.
 |
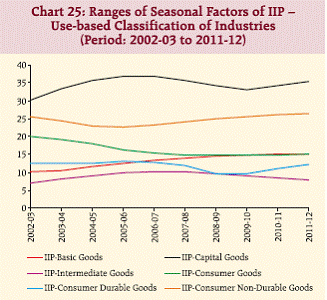
3.3.3.2 Among the use-based classification of industries, ‘Intermediate Goods’ experienced the lowest seasonal variations throughout the reference period, sans for 2008-09. In contrast, IIP-Capital Goods exhibited the highest seasonal variations in all the years under reference (Table 2 and Chart 25). Seasonal variations in IIP for Basic goods, Capital goods and Consumer goods (including both Durable and Non-durable) increased in recent years.
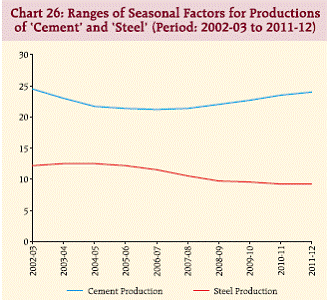
3.3.3.3 The seasonal variations of production of ‘Cement’ and ‘Steel’ exhibited opposite movements, during 2002-03 to 2011-12 with higher magnitude of seasonality in Cement than in Steel (Table 2 and Chart 26). The widening of gap between the seasonal variations of the two series during the last five years was also evident.
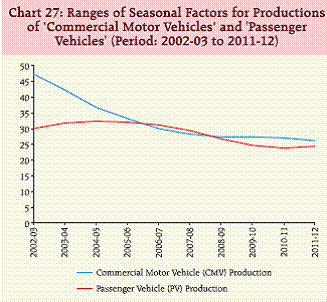
3.3.3.4 The seasonal variations in ‘Production of Commercial Motor Vehicles’, decreased consistently over the reference period, whereas, the seasonal variation of ‘Production of Passenger Vehicles’ which was decreasing since 2006-07 showed marginal increase in 2011-12 (Table 2 and Chart 27).
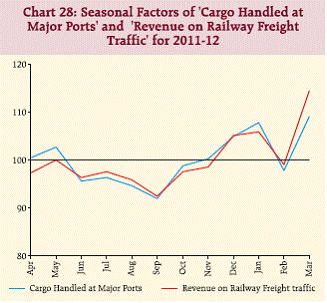
3.4 Services Sector Indicators 3.4.1 Eight Services Sector indicators were considered for analyzing the intra-year seasonal variation for the period ‘April 2002 to March 2012’. 3.4.2 Seasonal Factors during 2011-12 3.4.2.1 Seasonal factors in respect of two Services Sector indicators, viz., ‘Cargo Handled at Major Ports’ and ‘Revenue on Railway Freight Traffic’ exhibited peak in March, whereas the trough occurred in September (Table 1 and Chart 28).
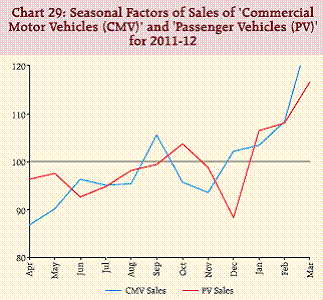
3.4.2.2 The seasonal peak of sales of ‘Commercial Motor Vehicle’ and ‘Passenger Vehicle’ occurred in March; whereas the trough occurred in April and December, respectively (Table 1 and Chart 29). The seasonal variation of Commercial Motor Vehicle sales was higher than that of Passenger Vehicle sales.
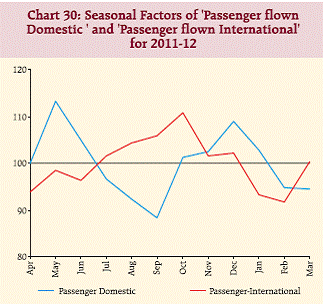
3.4.2.3 The seasonal factors of Passenger flown Domestic and International exhibited high degree of fluctuation in 2011-12. The seasonal peak of Passenger flown Domestic and International occurred in May and October, respectively; while trough occurred in September and February, respectively (Table 1 and Chart 30).
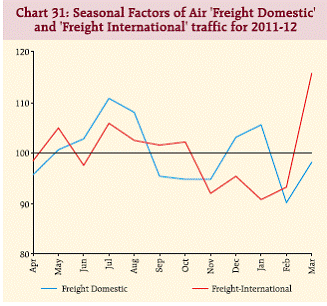
3.4.2.4 The Domestic and International air freight exhibited seasonal peak in July and March, respectively; whereas, trough occurred in February and January, respectively (Table 1 and Chart 31). The seasonal variation of International freight was relatively higher than that of Domestic freight during 2011-12.
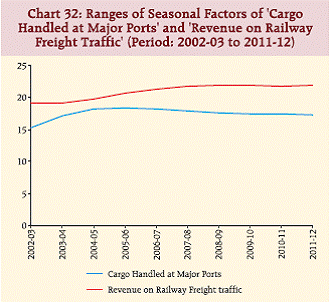
3.4.3 Seasonal Variation during Last Ten Years (2002-03 to 2011-12) 3.4.3.1 Over the reference period, the seasonal variation, in terms of range of seasonal factors, for ‘Revenue on Railway Freight Traffic’ was higher as compared to that of ‘Cargo Handled at Major Ports’ (Table 2 and Chart 32). Seasonal variations of ‘Cargo Handled at Major Ports’ declined since 2006-07. The range of seasonal factors of ‘Revenue on Railway Freight Traffic’ remained high and stable from 2007-08 onwards.
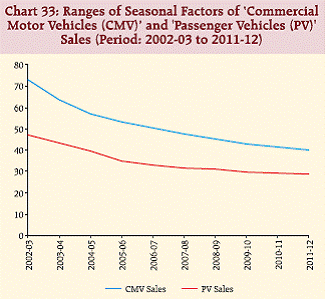
3.4.3.2 The seasonal variation of Commercial Motor Vehicle and Passenger Vehicle sales decreased during the last ten years. Although, the range of seasonal factors of Commercial Motor Vehicle sales remained higher than Passenger Vehicle sales, the gap has narrowed down in the recent years (Table 2 and Chart 33).
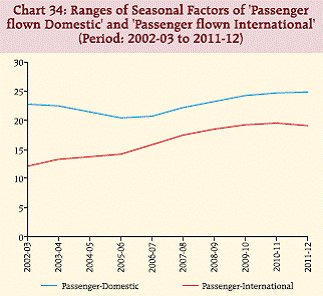
3.4.3.3 The seasonal variation of passenger flown in Domestic and International exhibited increasing trend since 2005-06. However, range of seasonal factors for passenger flown in Domestic was higher than that of passenger flown International (Table 2 and Chart 34).
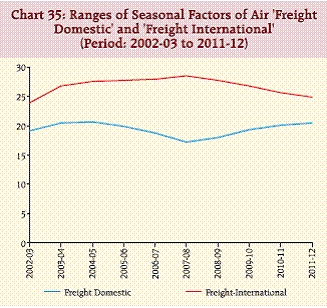
3.4.3.4 The range of seasonal factors of International air freight exhibited declining trend in the last four years after steady increase till 2007-08. However, in the case of Domestic freight, the scenario was opposite. The seasonal variation of International freight remained higher than that of Domestic freight (Table 2 and Chart 35).
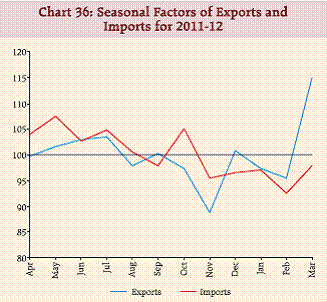
3.5 External Trade 3.5.1 Seasonal Factors during 2011-12 3.5.1.1 The peak of Exports and Imports occurred in March and May, whereas the trough occurred in November and February, respectively (Table 1 and Chart 36).
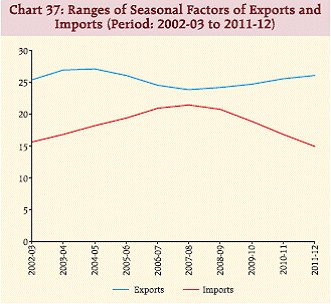
3.5.2 Seasonal Variation during Last Ten Years (2002-03 to 2011-12) 3.5.2.1 Over the reference period, Exports exhibited higher seasonal variations than Imports. The movement in seasonal variation of the two series showed mirror image of one another (Table 2 and Chart 37). From 2008-09 onwards, the divergence between the seasonal variations of Exports and Imports has been more pronounced.
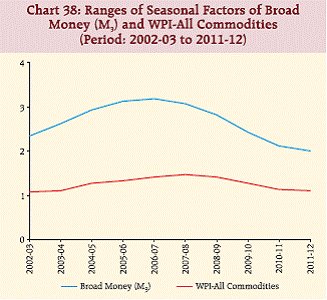
3.6 Inter-Sectoral Comparison of Seasonal Factors 3.6.1 Apart from the evaluation of the salient features (in terms of magnitude and direction) of seasonal factors for the selected series, a comparative analysis on the inter-sectoral performance among monetary and banking sectors, prices, industrial production and external sectors in terms of the movements of range of seasonal factors during the reference period, revealed the following. 3.6.2 The ranges of seasonal factors in M3 and WPI-All Commodities revealed broadly similar movements (Table 2 and Chart 38). However, the seasonal variation of M3 which was higher than that of WPI-All Commodities, has been declining gradually from 2007-08 onwards. At the same time, the variation has remained almost stable in case of WPI-All Commodities.
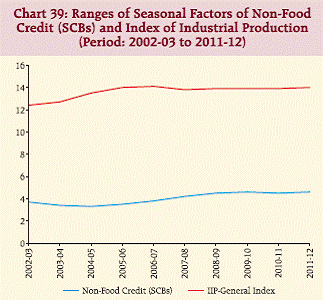
3.6.3 The ranges of seasonal factors of Non-Food Credit (SCBs) and Index of Industrial Production broadly exhibited similar movements (Table 2 and Chart 39). Further, Index of Industrial Production had higher seasonal variation than that of Non-Food Credit (SCBs).
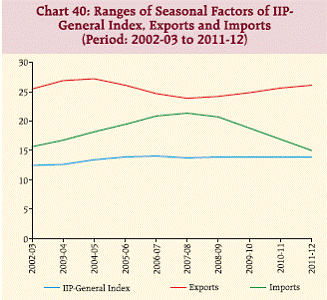
3.6.4 The seasonal variations in Exports declined during the period 2004-05 to 2006-07, and thereafter, increased steadily. In case of IIP-General Index, the seasonal variation has remained stable over the ten years period, while for Imports, the seasonal variation has been declining since 2008-09. Among the three series,Exports exhibited the highest seasonal variations, while IIP-General Index the lowest variation (Table 2 and Chart 40).
3.7 High and Low Seasonal Variation 3.7.1 The selected macroeconomic variables have also been classified on the basis of average seasonal variations during the last five years (viz., 2007-08 to 2011-12). The ‘Top twenty’ and ‘Bottom twenty’ series; and the corresponding peak and trough months are reported in Table 5. 3.7.2 Among the 37 series of IIP and its subgroups, 14 are classified under the ‘Top Twenty’ category. In particular, ‘IIP-Office, accounting and computing machinery’, ‘IIP-Food products and beverages’, ‘Coal production’ and ‘IIP-Fabricated metal products except machinery and equipment’ showed average seasonal variation of more than 50. 3.7.3 Among 29 series of WPI group, only two series, viz., ‘WPI-Potatoes’ and ‘WPI-Onions’ appeared in ‘Top twenty’ in terms of average seasonal variation over the last five years. 3.7.4 Among 8 series of Services Sector Indicators, three series, viz., ‘Sales of Commercial Motor Vehicles’, ‘Sales of Passenger Vehicles’, and ‘Freight Tonne Km flown International’ appeared in ‘Top twenty’ class of high seasonal variation. 3.7.5 In the case of ‘Bottom Twenty’ group of variables having low seasonal variations of less than 3.0, 14 series are from WPI group. All the three CPI series and three series from Money and Banking indicators, viz., Aggregate Deposits (SCBs), Broad Money (M3) and Time Deposits (SCBs) were also found to be in ‘Bottom Twenty’ group. However, no series from Industrial Production group was found among the ‘Bottom Twenty’ in terms of seasonal variation. 3.7.6 During the period 2007-08 to 2011-12, the average seasonal peak of most of the series in ‘Top twenty’ items group occurred in March (14 out of 20 series). Out of 14 series of Industrial Production in ‘Top twenty’, 10 series showed average peak in March.
Table 1: Monthly Seasonal Factors of Selected Economic Time Series (April - March) |
| |
Year |
Apr |
May |
Jun |
Jul |
Aug |
Sep |
Oct |
Nov |
1 |
2 |
3 |
4 |
5 |
6 |
7 |
8 |
9 |
A.1.1 Broad Money (M3) |
|
2011-12 |
101.3 |
100.8 |
99.9 |
100.4 |
99.8 |
99.4 |
99.7 |
99.3 |
Average |
101.6 |
101.0 |
100.3 |
100.1 |
99.8 |
99.7 |
99.6 |
99.2 |
2012-13 |
101.3 |
100.8 |
99.8 |
100.5 |
99.8 |
99.4 |
99.7 |
99.3 |
A.1.1.1 Net Bank Credit to Government |
|
2011-12 |
101.9 |
101.9 |
100.9 |
101.8 |
100.7 |
99.3 |
98.8 |
99.3 |
Average |
101.9 |
101.6 |
101.0 |
101.7 |
100.7 |
99.5 |
99.2 |
99.6 |
2012-13 |
101.9 |
101.8 |
100.8 |
101.8 |
100.7 |
99.3 |
98.9 |
99.2 |
A.1.1.2 Bank Credit to Commercial Sector |
|
2011-12 |
100.9 |
100.1 |
100.2 |
99.5 |
98.9 |
99.3 |
99.0 |
98.8 |
Average |
101.3 |
100.1 |
99.8 |
99.0 |
98.8 |
100.0 |
99.3 |
99.2 |
2012-13 |
100.9 |
100.2 |
100.3 |
99.6 |
98.9 |
99.2 |
99.0 |
98.8 |
A.1.2 Narrow Money (M1) |
|
2011-12 |
101.7 |
100.8 |
99.8 |
98.9 |
98.6 |
99.3 |
98.9 |
98.7 |
Average |
102.9 |
101.5 |
100.6 |
98.8 |
98.3 |
99.3 |
98.6 |
98.3 |
2012-13 |
101.6 |
100.7 |
99.9 |
98.9 |
98.6 |
99.2 |
99.0 |
98.8 |
A.1.2.1 Currency with the Public |
|
2011-12 |
102.8 |
103.6 |
102.5 |
99.0 |
98.4 |
97.5 |
98.1 |
99.5 |
Average |
103.2 |
103.6 |
102.1 |
99.4 |
98.2 |
96.9 |
98.3 |
99.2 |
2012-13 |
102.7 |
103.6 |
102.5 |
99.0 |
98.4 |
97.6 |
98.0 |
99.6 |
A.1.3 Reserve Money (RM) |
|
2011-12 |
102.1 |
101.9 |
100.9 |
99.6 |
98.8 |
98.1 |
98.3 |
99.5 |
Average |
103.5 |
102.1 |
101.2 |
99.6 |
98.8 |
97.4 |
98.5 |
99.2 |
2012-13 |
101.9 |
101.9 |
100.8 |
99.5 |
98.9 |
98.0 |
98.4 |
99.6 |
A.1.3.1 Currency in Circulation |
|
2011-12 |
102.5 |
103.5 |
102.4 |
99.0 |
98.4 |
97.5 |
98.4 |
99.6 |
Average |
103.0 |
103.6 |
102.2 |
99.4 |
98.3 |
96.8 |
98.5 |
99.2 |
2012-13 |
102.5 |
103.5 |
102.5 |
99.0 |
98.4 |
97.6 |
98.3 |
99.6 |
A.1.3.1.1 Notes in Circulation |
|
2011-12 |
102.6 |
103.5 |
102.5 |
99.0 |
98.4 |
97.5 |
98.3 |
99.6 |
Average |
103.1 |
103.6 |
102.3 |
99.2 |
98.2 |
96.8 |
98.4 |
99.4 |
2012-13 |
102.5 |
103.5 |
102.5 |
99.0 |
98.4 |
97.6 |
98.3 |
99.6 |
A.2.1 Deposits (Banking Department) |
|
2011-12 |
99.5 |
97.8 |
94.4 |
98.3 |
96.9 |
107.9 |
102.6 |
100.4 |
Average |
99.4 |
95.0 |
96.7 |
101.5 |
97.4 |
107.2 |
101.1 |
99.0 |
2012-13 |
99.5 |
98.0 |
94.5 |
98.4 |
96.3 |
107.7 |
102.3 |
101.1 |
A.2.2 Liabilities to the Banking System (SCBs) |
|
2011-12 |
104.3 |
97.5 |
102.7 |
100.4 |
98.3 |
97.6 |
96.4 |
94.5 |
Average |
103.9 |
100.3 |
101.9 |
99.0 |
97.7 |
97.9 |
98.5 |
97.1 |
2012-13 |
104.8 |
97.4 |
103.2 |
100.5 |
98.3 |
97.7 |
95.9 |
94.3 |
Table 1: Monthly Seasonal Factors of Selected Economic Time Series (April - March) (Contd.) |
|
Year |
Dec |
Jan |
Feb |
Mar |
Peak
Month |
Peak
Value |
Trough
Month |
Trough
Value |
|
1 |
10 |
11 |
12 |
13 |
14 |
15 |
16 |
17 |
A.1.1 Broad Money (M3) |
| |
2011-12 |
99.5 |
99.5 |
99.8 |
100.6 |
Apr |
101.3 |
Nov |
99.3 |
Average |
99.0 |
99.2 |
99.6 |
101.0 |
Apr |
101.6 |
Dec |
99.0 |
2012-13 |
99.6 |
99.5 |
99.7 |
100.5 |
Apr |
101.3 |
Nov |
99.3 |
A.1.1.1 Net Bank Credit to Government |
|
2011-12 |
97.4 |
98.5 |
98.8 |
100.9 |
Apr |
101.9 |
Dec |
97.4 |
Average |
97.2 |
98.7 |
98.7 |
100.3 |
Apr |
101.9 |
Dec |
97.2 |
2012-13 |
97.5 |
98.4 |
98.9 |
100.9 |
Apr |
101.9 |
Dec |
97.5 |
A.1.1.2 Bank Credit to Commercial Sector |
|
2011-12 |
100.1 |
99.9 |
100.2 |
102.8 |
Mar |
102.8 |
Nov |
98.8 |
Average |
100.0 |
99.8 |
100.2 |
102.7 |
Mar |
102.7 |
Aug |
98.8 |
2012-13 |
100.2 |
100.0 |
100.3 |
102.7 |
Mar |
102.7 |
Nov |
98.8 |
A.1.2 Narrow Money (M1) |
|
2011-12 |
99.9 |
99.3 |
100.3 |
103.8 |
Mar |
103.8 |
Aug |
98.6 |
Average |
99.1 |
99.0 |
100.0 |
103.9 |
Mar |
103.9 |
Aug |
98.3 |
2012-13 |
100.1 |
99.3 |
100.4 |
103.7 |
Mar |
103.7 |
Aug |
98.6 |
A.1.2.1 Currency with the Public |
|
2011-12 |
99.0 |
99.4 |
100.1 |
100.1 |
May |
103.6 |
Sep |
97.5 |
Average |
99.1 |
99.6 |
100.3 |
100.2 |
May |
103.6 |
Sep |
96.9 |
2012-13 |
98.9 |
99.4 |
100.1 |
100.0 |
May |
103.6 |
Sep |
97.6 |
A.1.3 Reserve Money (RM) |
|
2011-12 |
98.9 |
98.2 |
99.0 |
104.9 |
Mar |
104.9 |
Sep |
98.1 |
Average |
98.4 |
98.6 |
98.9 |
103.9 |
Mar |
103.9 |
Sep |
97.4 |
2012-13 |
98.9 |
98.2 |
99.0 |
104.9 |
Mar |
104.9 |
Sep |
98.0 |
A.1.3.1 Currency in Circulation |
|
2011-12 |
99.1 |
99.4 |
100.0 |
100.1 |
May |
103.5 |
Sep |
97.5 |
Average |
99.2 |
99.5 |
100.1 |
100.4 |
May |
103.6 |
Sep |
96.8 |
2012-13 |
99.0 |
99.5 |
100.0 |
100.0 |
May |
103.5 |
Sep |
97.6 |
A.1.3.1.1 Notes in Circulation |
|
2011-12 |
99.0 |
99.4 |
100.0 |
100.1 |
May |
103.5 |
Sep |
97.5 |
Average |
99.1 |
99.5 |
100.1 |
100.4 |
May |
103.6 |
Sep |
96.8 |
2012-13 |
99.0 |
99.4 |
100.0 |
100.1 |
May |
103.5 |
Sep |
97.6 |
A.2.1 Deposits (Banking Department) |
|
2011-12 |
104.6 |
100.1 |
93.6 |
103.9 |
Sep |
107.9 |
Feb |
93.6 |
Average |
102.6 |
98.0 |
96.4 |
106.0 |
Sep |
107.2 |
May |
95.0 |
2012-13 |
104.8 |
100.7 |
93.1 |
103.8 |
Sep |
107.7 |
Feb |
93.1 |
A.2.2 Liabilities to the Banking System (SCBs) |
|
2011-12 |
101.7 |
98.8 |
100.8 |
106.3 |
Mar |
106.3 |
Nov |
94.5 |
Average |
100.0 |
98.3 |
98.8 |
106.9 |
Mar |
106.9 |
Nov |
97.1 |
2012-13 |
101.8 |
99.0 |
100.5 |
106.5 |
Mar |
106.5 |
Nov |
94.3 |
Table 1: Monthly Seasonal Factors of Selected Economic Time Series (April - March) (Contd.) |
|
Year |
Apr |
May |
Jun |
Jul |
Aug |
Sep |
Oct |
Nov |
1 |
2 |
3 |
4 |
5 |
6 |
7 |
8 |
9 |
A.2.3 Aggregate Deposits (SCBs) |
|
2011-12 |
101.2 |
100.4 |
99.4 |
100.7 |
100.1 |
99.8 |
100.0 |
99.3 |
Average |
101.4 |
100.6 |
99.9 |
100.3 |
100.1 |
100.1 |
99.9 |
99.4 |
2012-13 |
101.2 |
100.4 |
99.4 |
100.8 |
100.1 |
99.8 |
100.0 |
99.3 |
A.2.3.1 Demand Deposits (SCBs) |
|
2011-12 |
100.5 |
98.0 |
95.5 |
98.8 |
98.5 |
100.7 |
99.8 |
97.1 |
Average |
102.0 |
99.0 |
98.1 |
97.7 |
98.1 |
102.4 |
99.2 |
97.4 |
2012-13 |
100.4 |
97.8 |
95.4 |
99.0 |
98.3 |
100.3 |
99.9 |
97.2 |
A.2.3.2 Time Deposits (SCBs) |
|
2011-12 |
101.1 |
100.6 |
99.8 |
100.7 |
100.1 |
99.4 |
100.3 |
99.6 |
Average |
100.8 |
100.6 |
100.0 |
100.6 |
100.3 |
99.9 |
100.2 |
99.9 |
2012-13 |
101.1 |
100.6 |
99.8 |
100.8 |
100.1 |
99.4 |
100.2 |
99.5 |
A.3.1 Cash in Hand and Balances with RBI (SCBs) |
|
2011-12 |
101.9 |
100.7 |
99.4 |
102.5 |
101.6 |
100.7 |
99.7 |
100.6 |
Average |
106.4 |
99.4 |
101.0 |
101.4 |
101.6 |
101.0 |
99.5 |
100.4 |
2012-13 |
101.6 |
100.9 |
99.4 |
102.7 |
101.7 |
100.3 |
99.8 |
100.6 |
A.3.2 Assets with the Banking System (SCBs) |
|
2011-12 |
102.7 |
98.4 |
102.1 |
99.0 |
98.1 |
100.0 |
96.4 |
92.4 |
Average |
101.9 |
100.0 |
100.9 |
97.6 |
99.8 |
101.2 |
98.9 |
94.7 |
2012-13 |
103.0 |
98.1 |
102.3 |
99.3 |
97.9 |
99.9 |
96.0 |
92.2 |
A.3.3 Bank Credit (SCBs) |
|
2011-12 |
101.1 |
100.2 |
100.3 |
99.5 |
98.9 |
99.4 |
98.9 |
98.7 |
Average |
101.4 |
100.2 |
99.9 |
99.2 |
98.9 |
99.8 |
99.2 |
99.1 |
2012-13 |
101.1 |
100.3 |
100.4 |
99.5 |
98.9 |
99.2 |
98.8 |
98.6 |
A.3.3.1 Loans, Cash, Credits and Overdrafts (SCBs) |
|
2011-12 |
100.6 |
99.8 |
100.3 |
99.0 |
98.3 |
100.4 |
99.5 |
98.9 |
Average |
100.7 |
99.9 |
99.8 |
98.9 |
98.5 |
100.6 |
99.5 |
99.3 |
2012-13 |
100.7 |
99.8 |
100.3 |
99.1 |
98.3 |
100.4 |
99.5 |
98.8 |
A.3.3.2 Food Credit (SCBs) |
|
2011-12 |
98.8 |
102.9 |
111.2 |
100.6 |
96.8 |
92.0 |
88.6 |
98.8 |
Average |
97.7 |
106.2 |
110.2 |
101.6 |
97.4 |
92.5 |
92.4 |
98.3 |
2012-13 |
98.9 |
102.5 |
110.9 |
100.7 |
96.9 |
92.1 |
88.0 |
99.1 |
A.3.3.3 Non-Food Credit (SCBs) |
|
2011-12 |
101.4 |
100.1 |
100.2 |
99.7 |
98.9 |
99.3 |
98.9 |
98.7 |
Average |
101.6 |
99.9 |
99.6 |
99.3 |
98.9 |
99.7 |
99.3 |
99.1 |
2012-13 |
101.5 |
100.3 |
100.3 |
99.6 |
99.0 |
99.2 |
98.8 |
98.7 |
A.3.4 Investments (SCBs) |
|
2011-12 |
100.4 |
100.5 |
100.0 |
101.4 |
102.3 |
101.5 |
100.9 |
100.1 |
Average |
100.7 |
100.9 |
100.1 |
101.3 |
101.7 |
100.9 |
100.8 |
100.2 |
2012-13 |
100.3 |
100.4 |
100.0 |
101.5 |
102.5 |
101.6 |
100.9 |
100.1 |
Table 1: Monthly Seasonal Factors of Selected Economic Time Series (April - March) (Contd.) |
|
Year |
Dec |
Jan |
Feb |
Mar |
Peak
Month |
Peak
Value |
Trough
Month |
Trough
Value |
1 |
10 |
11 |
12 |
13 |
14 |
15 |
16 |
17 |
A.2.3 Aggregate Deposits (SCBs) |
|
2011-12 |
99.0 |
99.5 |
99.7 |
100.7 |
Apr |
101.2 |
Dec |
99.0 |
Average |
98.7 |
99.2 |
99.5 |
100.9 |
Apr |
101.4 |
Dec |
98.7 |
2012-13 |
99.1 |
99.5 |
99.7 |
100.6 |
Apr |
101.2 |
Dec |
99.1 |
A.2.3.1 Demand Deposits (SCBs) |
|
2011-12 |
97.7 |
101.6 |
102.5 |
109.7 |
Mar |
109.7 |
Jun |
95.5 |
Average |
97.9 |
98.6 |
100.3 |
110.1 |
Mar |
110.1 |
Nov |
97.4 |
2012-13 |
97.9 |
101.7 |
102.7 |
109.5 |
Mar |
109.5 |
Jun |
95.4 |
A.2.3.2 Time Deposits (SCBs) |
|
2011-12 |
99.6 |
99.4 |
99.6 |
99.7 |
Apr |
101.1 |
Sep |
99.4 |
Average |
99.2 |
99.6 |
99.5 |
99.5 |
Apr |
100.8 |
Dec |
99.2 |
2012-13 |
99.7 |
99.4 |
99.5 |
99.7 |
Apr |
101.1 |
Jan |
99.4 |
A.3.1 Cash in Hand and Balances with RBI (SCBs) |
|
2011-12 |
99.7 |
96.3 |
97.9 |
98.9 |
Jul |
102.5 |
Jan |
96.3 |
Average |
97.4 |
97.3 |
97.3 |
97.9 |
Apr |
106.4 |
Jan |
97.3 |
2012-13 |
99.9 |
96.6 |
97.8 |
98.3 |
Jul |
102.7 |
Jan |
96.6 |
A.3.2 Assets with the Banking System (SCBs) |
|
2011-12 |
98.5 |
97.3 |
101.4 |
113.6 |
Mar |
113.6 |
Nov |
92.4 |
Average |
97.8 |
96.7 |
99.9 |
110.9 |
Mar |
110.9 |
Nov |
94.7 |
2012-13 |
99.1 |
97.5 |
101.0 |
113.8 |
Mar |
113.8 |
Nov |
92.2 |
A.3.3 Bank Credit (SCBs) |
|
2011-12 |
100.1 |
99.8 |
100.1 |
103.0 |
Mar |
103.0 |
Nov |
98.7 |
Average |
99.8 |
99.7 |
100.1 |
102.7 |
Mar |
102.7 |
Aug |
98.9 |
2012-13 |
100.2 |
99.9 |
100.2 |
102.9 |
Mar |
102.9 |
Nov |
98.6 |
A.3.3.1 Loans, Cash, Credits and Overdrafts (SCBs) |
|
2011-12 |
100.5 |
99.8 |
100.0 |
102.7 |
Mar |
102.7 |
Aug |
98.3 |
Average |
100.4 |
99.9 |
100.2 |
102.4 |
Mar |
102.4 |
Aug |
98.5 |
2012-13 |
100.6 |
99.8 |
100.1 |
102.7 |
Mar |
102.7 |
Aug |
98.3 |
A.3.3.2 Food Credit (SCBs) |
|
2011-12 |
106.1 |
99.8 |
103.4 |
101.2 |
Jun |
111.2 |
Oct |
88.6 |
Average |
102.3 |
97.7 |
102.1 |
102.4 |
Jun |
110.2 |
Oct |
92.4 |
2012-13 |
106.4 |
100.3 |
103.5 |
100.8 |
Jun |
110.9 |
Oct |
88.0 |
A.3.3.3 Non-Food Credit (SCBs) |
| |
2011-12 |
99.0 |
100.0 |
100.3 |
103.3 |
Mar |
103.3 |
Nov |
98.7 |
Average |
99.6 |
99.8 |
100.3 |
102.9 |
Mar |
102.9 |
Aug |
98.9 |
2012-13 |
99.1 |
100.0 |
100.3 |
103.3 |
Mar |
103.3 |
Nov |
98.7 |
A.3.4 Investments (SCBs) |
|
2011-12 |
98.1 |
98.6 |
98.5 |
97.7 |
Aug |
102.3 |
Mar |
97.7 |
Average |
98.4 |
98.4 |
98.8 |
97.8 |
Aug |
101.7 |
Mar |
97.8 |
2012-13 |
98.1 |
98.6 |
98.4 |
97.8 |
Aug |
102.5 |
Mar |
97.8 |
Table 1: Monthly Seasonal Factors of Selected Economic Time Series (April - March) (Contd.) |
|
Year |
Apr |
May |
Jun |
Jul |
Aug |
Sep |
Oct |
Nov |
1 |
2 |
3 |
4 |
5 |
6 |
7 |
8 |
9 |
B. WPI (base: 2004-05=100) All Commodities |
|
2011-12 |
100.5 |
100.2 |
100.2 |
100.4 |
100.3 |
100.1 |
99.9 |
100.0 |
Average |
100.3 |
100.2 |
100.2 |
100.4 |
100.4 |
100.3 |
100.2 |
100.2 |
2012-13 |
100.5 |
100.2 |
100.2 |
100.4 |
100.2 |
100.1 |
99.9 |
100.0 |
B.1 WPI - Primary Articles |
|
2011-12 |
100.5 |
99.9 |
100.7 |
100.9 |
100.6 |
100.6 |
100.8 |
101.0 |
Average |
99.5 |
99.8 |
100.8 |
101.1 |
101.4 |
101.0 |
101.4 |
101.2 |
2012-13 |
100.5 |
99.9 |
100.6 |
100.9 |
100.6 |
100.7 |
100.7 |
101.0 |
B.1.1 WPI - Food Articles |
|
2011-12 |
99.0 |
99.1 |
100.0 |
101.4 |
101.3 |
101.9 |
102.9 |
102.5 |
Average |
99.3 |
99.3 |
99.8 |
100.8 |
101.4 |
101.5 |
102.8 |
102.3 |
2012-13 |
99.0 |
99.1 |
100.1 |
101.4 |
101.3 |
102.0 |
102.9 |
102.4 |
B.1.1.1 WPI - Food Grains (Cereals+Pulses) |
|
2011-12 |
99.4 |
99.3 |
99.4 |
99.6 |
99.8 |
99.9 |
100.8 |
100.8 |
Average |
99.3 |
99.3 |
99.3 |
99.7 |
100.1 |
100.0 |
100.8 |
100.9 |
2012-13 |
99.4 |
99.4 |
99.4 |
99.7 |
99.9 |
100.0 |
100.7 |
100.7 |
B.1.1.1.1 WPI - Cereals |
|
2011-12 |
99.5 |
99.6 |
99.5 |
99.5 |
99.8 |
99.8 |
100.3 |
100.5 |
Average |
99.6 |
99.5 |
99.4 |
99.6 |
99.7 |
99.8 |
100.3 |
100.5 |
2012-13 |
99.4 |
99.5 |
99.6 |
99.6 |
99.9 |
99.9 |
100.2 |
100.4 |
B.1.1.1.1.1 WPI - Wheat |
| |
2011-12 |
99.0 |
98.2 |
98.7 |
99.0 |
99.7 |
99.3 |
98.4 |
100.3 |
Average |
98.7 |
97.6 |
98.0 |
98.6 |
99.1 |
99.3 |
99.3 |
101.1 |
2012-13 |
99.0 |
98.2 |
98.8 |
99.0 |
99.8 |
99.3 |
98.4 |
100.2 |
B.1.1.1.1.2 WPI - Rice |
| |
2011-12 |
99.4 |
99.4 |
99.1 |
99.3 |
99.8 |
100.2 |
101.1 |
101.2 |
Average |
99.5 |
99.7 |
99.7 |
100.0 |
100.4 |
100.6 |
101.0 |
100.6 |
2012-13 |
99.4 |
99.3 |
99.1 |
99.3 |
99.8 |
100.2 |
101.2 |
101.3 |
B.1.1.1.2 WPI - Pulses |
| |
2011-12 |
98.7 |
98.3 |
98.6 |
99.8 |
100.4 |
100.6 |
102.2 |
101.9 |
Average |
98.3 |
98.1 |
98.7 |
100.3 |
101.3 |
101.1 |
102.6 |
102.6 |
2012-13 |
98.7 |
98.4 |
98.7 |
99.7 |
100.1 |
100.5 |
102.2 |
101.8 |
B.1.1.2 WPI - Fruits & Vegetables |
|
2011-12 |
100.8 |
98.6 |
100.2 |
104.5 |
103.0 |
104.0 |
106.6 |
107.6 |
Average |
98.6 |
97.7 |
99.7 |
102.1 |
104.2 |
105.6 |
109.1 |
108.4 |
2012-13 |
101.1 |
98.6 |
100.3 |
104.5 |
102.9 |
104.2 |
106.5 |
107.5 |
B.1.1.2.1 WPI - Potatoes |
| |
2011-12 |
82.8 |
91.7 |
100.3 |
111.3 |
114.9 |
119.9 |
126.2 |
122.6 |
Average |
85.5 |
95.8 |
104.6 |
111.7 |
113.3 |
117.4 |
124.1 |
120.3 |
2012-13 |
82.8 |
91.8 |
100.6 |
111.4 |
115.2 |
119.7 |
126.0 |
122.0 |
Table 1: Monthly Seasonal Factors of Selected Economic Time Series (April - March) (Contd.) |
| |
Year |
Dec |
Jan |
Feb |
Mar |
Peak
Month |
Peak
Value |
Trough
Month |
Trough
Value |
1 |
10 |
11 |
12 |
13 |
14 |
15 |
16 |
17 |
B. WPI (base: 2004-05=100) All Commodities |
|
2011-12 |
99.7 |
99.7 |
99.4 |
99.6 |
Apr |
100.5 |
Feb |
99.4 |
Average |
99.5 |
99.6 |
99.3 |
99.4 |
Aug |
100.4 |
Feb |
99.3 |
2012-13 |
99.7 |
99.7 |
99.4 |
99.7 |
Apr |
100.5 |
Feb |
99.4 |
B.1 WPI - Primary Articles |
|
2011-12 |
99.5 |
99.2 |
98.2 |
98.2 |
Nov |
101.0 |
Feb |
98.2 |
Average |
99.2 |
98.7 |
97.9 |
98.0 |
Aug |
101.4 |
Feb |
97.9 |
2012-13 |
99.5 |
99.2 |
98.3 |
98.3 |
Nov |
101.0 |
Feb |
98.3 |
B.1.1 WPI - Food Articles |
|
2011-12 |
99.3 |
98.7 |
96.8 |
97.0 |
Oct |
102.9 |
Feb |
96.8 |
Average |
99.2 |
98.8 |
97.5 |
97.2 |
Oct |
102.8 |
Mar |
97.2 |
2012-13 |
99.3 |
98.6 |
96.8 |
97.0 |
Oct |
102.9 |
Feb |
96.8 |
B.1.1.1 WPI - Food Grains (Cereals+Pulses) |
|
2011-12 |
100.6 |
100.6 |
100.1 |
99.6 |
Oct |
100.8 |
May |
99.3 |
Average |
100.5 |
100.4 |
100.4 |
99.6 |
Nov |
100.9 |
May |
99.3 |
2012-13 |
100.6 |
100.5 |
100.1 |
99.6 |
Oct |
100.7 |
May |
99.4 |
B.1.1.1.1 WPI - Cereals |
|
2011-12 |
100.5 |
100.8 |
100.5 |
99.8 |
Jan |
100.8 |
Apr |
99.5 |
Average |
100.2 |
100.6 |
100.8 |
100.0 |
Feb |
100.8 |
Jun |
99.4 |
2012-13 |
100.4 |
100.8 |
100.5 |
99.8 |
Jan |
100.8 |
Apr |
99.4 |
B.1.1.1.1.1 WPI - Wheat |
|
2011-12 |
101.2 |
102.4 |
102.6 |
101.2 |
Feb |
102.6 |
May |
98.2 |
Average |
101.7 |
102.5 |
102.5 |
101.4 |
Feb |
102.5 |
May |
97.6 |
2012-13 |
101.2 |
102.4 |
102.6 |
101.3 |
Feb |
102.6 |
May |
98.2 |
B.1.1.1.1.2 WPI - Rice |
|
2011-12 |
100.8 |
100.2 |
100.0 |
99.6 |
Nov |
101.2 |
Jun |
99.1 |
Average |
99.9 |
99.6 |
99.7 |
99.5 |
Oct |
101.0 |
Mar |
99.5 |
2012-13 |
100.8 |
100.2 |
99.9 |
99.5 |
Nov |
101.3 |
Jun |
99.1 |
B.1.1.1.2 WPI - Pulses |
|
2011-12 |
101.4 |
100.1 |
99.1 |
99.1 |
Oct |
102.2 |
May |
98.3 |
Average |
101.5 |
99.5 |
98.5 |
97.7 |
Oct |
102.6 |
Mar |
97.7 |
2012-13 |
101.3 |
100.2 |
99.2 |
99.3 |
Oct |
102.2 |
May |
98.4 |
B.1.1.2 WPI - Fruits & Vegetables |
|
2011-12 |
98.5 |
95.2 |
90.5 |
90.2 |
Nov |
107.6 |
Mar |
90.2 |
Average |
97.6 |
94.5 |
91.1 |
91.2 |
Oct |
109.1 |
Feb |
91.1 |
2012-13 |
98.4 |
95.0 |
90.5 |
90.5 |
Nov |
107.5 |
Mar |
90.5 |
B.1.1.2.1 WPI - Potatoes |
|
2011-12 |
97.9 |
79.6 |
73.9 |
78.8 |
Oct |
126.2 |
Feb |
73.9 |
Average |
97.2 |
80.5 |
72.5 |
78.3 |
Oct |
124.1 |
Feb |
72.5 |
2012-13 |
97.6 |
79.6 |
74.4 |
79.0 |
Oct |
126.0 |
Feb |
74.4 |
Table 1: Monthly Seasonal Factors of Selected Economic Time Series (April - March) (Contd.) |
|
Year |
Apr |
May |
Jun |
Jul |
Aug |
Sep |
Oct |
Nov |
1 |
2 |
3 |
4 |
5 |
6 |
7 |
8 |
9 |
B.1.1.2.2 WPI - Onions |
|
2011-12 |
74.1 |
74.0 |
82.4 |
89.7 |
100.4 |
107.3 |
119.6 |
129.6 |
Average |
78.9 |
77.7 |
83.8 |
91.2 |
100.2 |
110.3 |
121.8 |
125.6 |
2012-13 |
73.4 |
74.0 |
82.6 |
90.1 |
100.9 |
108.4 |
120.0 |
130.4 |
B.1.1.3 WPI - Milk |
|
2011-12 |
99.4 |
99.6 |
100.3 |
100.4 |
100.2 |
100.4 |
100.4 |
100.3 |
Average |
100.0 |
100.0 |
100.3 |
100.2 |
100.3 |
100.2 |
100.1 |
100.0 |
2012-13 |
99.3 |
99.5 |
100.3 |
100.5 |
100.3 |
100.4 |
100.4 |
100.2 |
B.1.1.4 WPI - Egg, Meat and Fish |
|
2011-12 |
98.4 |
100.3 |
99.7 |
101.0 |
100.8 |
101.5 |
99.7 |
100.3 |
Average |
98.8 |
101.3 |
101.2 |
102.0 |
101.0 |
99.8 |
98.3 |
99.9 |
2012-13 |
98.3 |
100.1 |
99.7 |
101.0 |
100.8 |
101.6 |
99.8 |
100.2 |
B.1.1.4.1 WPI - Egg |
|
2011-12 |
97.4 |
96.6 |
99.1 |
97.6 |
96.3 |
97.6 |
98.7 |
103.5 |
Average |
95.2 |
95.4 |
97.8 |
97.9 |
97.0 |
98.8 |
100.4 |
104.4 |
2012-13 |
97.1 |
96.3 |
99.1 |
97.7 |
96.3 |
97.4 |
98.7 |
103.6 |
B.1.1.4.2 WPI - Meat |
|
2011-12 |
99.2 |
99.1 |
99.2 |
100.2 |
100.0 |
100.1 |
100.3 |
101.0 |
Average |
98.6 |
99.7 |
100.3 |
100.3 |
99.7 |
98.8 |
98.9 |
100.3 |
2012-13 |
99.1 |
99.2 |
99.3 |
100.3 |
100.1 |
100.1 |
100.3 |
101.0 |
B.1.1.4.3 WPI - Fish |
|
2011-12 |
97.1 |
99.9 |
98.9 |
100.8 |
102.1 |
103.4 |
101.2 |
100.6 |
Average |
99.2 |
102.3 |
101.6 |
102.7 |
102.8 |
100.9 |
98.8 |
99.5 |
2012-13 |
97.0 |
99.6 |
98.9 |
100.6 |
102.1 |
103.6 |
101.3 |
100.6 |
B.1.1.5 WPI - Protein Items (viz., Pulses, Milk, Egg, Meat and Fish) Group |
|
2011-12 |
99.0 |
99.8 |
99.7 |
100.9 |
100.9 |
101.3 |
100.6 |
99.9 |
Average |
99.4 |
100.3 |
100.3 |
100.8 |
100.8 |
100.5 |
100.0 |
100.1 |
2012-13 |
98.9 |
99.7 |
99.7 |
100.9 |
100.9 |
101.4 |
100.6 |
99.9 |
B.1.2 WPI - Non-Food Articles |
|
2011-12 |
101.9 |
100.4 |
100.2 |
99.4 |
99.8 |
99.1 |
98.2 |
98.3 |
Average |
100.2 |
100.1 |
100.5 |
100.6 |
100.9 |
100.4 |
99.1 |
99.2 |
2012-13 |
102.1 |
100.3 |
100.0 |
99.2 |
99.5 |
98.9 |
98.2 |
98.2 |
B.1.2.1 WPI - Fibres |
|
2011-12 |
100.0 |
99.8 |
100.3 |
100.2 |
99.2 |
99.1 |
99.1 |
99.3 |
Average |
99.3 |
99.7 |
100.6 |
101.8 |
101.5 |
100.5 |
99.8 |
99.6 |
2012-13 |
100.3 |
99.8 |
100.1 |
99.8 |
98.7 |
98.9 |
99.0 |
99.4 |
B.1.2.1.1 WPI - Raw Cotton |
|
2011-12 |
100.5 |
100.1 |
101.0 |
100.7 |
99.4 |
99.5 |
98.3 |
99.0 |
Average |
99.1 |
99.6 |
100.9 |
102.7 |
102.5 |
101.4 |
99.9 |
99.6 |
2012-13 |
100.8 |
100.1 |
100.7 |
100.1 |
98.7 |
99.1 |
98.3 |
99.2 |
Table 1: Monthly Seasonal Factors of Selected Economic Time Series (April - March) (Contd.) |
| |
Year |
Dec |
Jan |
Feb |
Mar |
Peak
Month |
Peak
Value |
Trough
Month |
Trough
Value |
1 |
10 |
11 |
12 |
13 |
14 |
15 |
16 |
17 |
B.1.1.2.2 WPI - Onions |
|
2011-12 |
125.0 |
119.3 |
97.2 |
80.6 |
Nov |
129.6 |
May |
74.0 |
Average |
115.2 |
115.2 |
95.9 |
86.0 |
Nov |
125.6 |
May |
77.7 |
2012-13 |
124.9 |
118.2 |
96.2 |
79.5 |
Nov |
130.4 |
Apr |
73.4 |
B.1.1.3 WPI - Milk |
|
2011-12 |
99.9 |
100.2 |
99.7 |
99.2 |
Jul |
100.4 |
Mar |
99.2 |
Average |
99.6 |
99.8 |
99.8 |
99.8 |
Aug |
100.3 |
Dec |
99.6 |
2012-13 |
99.9 |
100.2 |
99.6 |
99.1 |
Jul |
100.5 |
Mar |
99.1 |
B.1.1.4 WPI - Egg, Meat and Fish |
|
2011-12 |
100.5 |
100.1 |
99.3 |
98.6 |
Sep |
101.5 |
Apr |
98.4 |
Average |
99.6 |
100.1 |
99.9 |
98.4 |
Jul |
102.0 |
Oct |
98.3 |
2012-13 |
100.5 |
100.1 |
99.3 |
98.6 |
Sep |
101.6 |
Apr |
98.3 |
B.1.1.4.1 WPI - Egg |
|
2011-12 |
104.6 |
105.7 |
102.8 |
100.4 |
Jan |
105.7 |
Aug |
96.3 |
Average |
105.2 |
106.0 |
102.5 |
98.9 |
Jan |
106.0 |
Apr |
95.2 |
2012-13 |
104.8 |
105.9 |
102.9 |
100.2 |
Jan |
105.9 |
Aug |
96.3 |
B.1.1.4.2 WPI - Meat |
|
2011-12 |
100.6 |
100.2 |
99.7 |
100.1 |
Nov |
101.0 |
May |
99.1 |
Average |
100.5 |
101.7 |
101.1 |
100.1 |
Jan |
101.7 |
Apr |
98.6 |
2012-13 |
100.6 |
100.2 |
99.6 |
100.2 |
Nov |
101.0 |
Apr |
99.1 |
B.1.1.4.3 WPI - Fish |
|
2011-12 |
100.6 |
99.5 |
98.8 |
97.3 |
Sep |
103.4 |
Apr |
97.1 |
Average |
98.7 |
98.3 |
97.9 |
97.8 |
Aug |
102.8 |
Mar |
97.8 |
2012-13 |
100.7 |
99.5 |
98.8 |
97.3 |
Sep |
103.6 |
Apr |
97.0 |
B.1.1.5 WPI - Protein Items (viz., Pulses, Milk, Egg, Meat and Fish) Group |
|
2011-12 |
99.8 |
100.0 |
99.5 |
98.8 |
Sep |
101.3 |
Mar |
98.8 |
Average |
99.6 |
99.6 |
99.7 |
99.0 |
Jul |
100.8 |
Mar |
99.0 |
2012-13 |
99.9 |
100.0 |
99.5 |
98.8 |
Sep |
101.4 |
Mar |
98.8 |
B.1.2 WPI - Non-Food Articles |
|
2011-12 |
99.2 |
100.5 |
100.7 |
102.7 |
Mar |
102.7 |
Oct |
98.2 |
Average |
99.5 |
99.8 |
99.3 |
100.5 |
Aug |
100.9 |
Oct |
99.1 |
2012-13 |
99.3 |
100.6 |
101.0 |
102.9 |
Mar |
102.9 |
Oct |
98.2 |
B.1.2.1 WPI - Fibres |
|
2011-12 |
100.3 |
101.3 |
101.0 |
100.9 |
Jan |
101.3 |
Oct |
99.1 |
Average |
99.3 |
100.2 |
99.1 |
99.0 |
Jul |
101.8 |
Mar |
99.0 |
2012-13 |
100.4 |
101.4 |
101.4 |
101.1 |
Jan |
101.4 |
Aug |
98.7 |
B.1.2.1.1 WPI - Raw Cotton |
|
2011-12 |
99.5 |
100.9 |
100.9 |
101.1 |
Mar |
101.1 |
Oct |
98.3 |
Average |
98.5 |
99.7 |
98.3 |
98.2 |
Jul |
102.7 |
Mar |
98.2 |
2012-13 |
99.7 |
101.0 |
101.3 |
101.5 |
Mar |
101.5 |
Oct |
98.3 |
Table 1: Monthly Seasonal Factors of Selected Economic Time Series (April - March) (Contd.) |
|
Year |
Apr |
May |
Jun |
Jul |
Aug |
Sep |
Oct |
Nov |
1 |
2 |
3 |
4 |
5 |
6 |
7 |
8 |
9 |
B.1.2.2 WPI - Oil Seeds |
|
2011-12 |
101.0 |
101.1 |
101.8 |
101.2 |
101.2 |
100.6 |
97.8 |
97.3 |
Average |
100.1 |
100.6 |
101.6 |
101.7 |
101.4 |
100.8 |
98.3 |
98.0 |
2012-13 |
101.1 |
101.1 |
101.6 |
101.1 |
101.1 |
100.7 |
97.8 |
97.2 |
B.2 WPI - Manufactured Products |
|
2011-12 |
100.7 |
100.5 |
100.4 |
100.1 |
100.0 |
99.9 |
99.6 |
99.5 |
Average |
100.5 |
100.5 |
100.4 |
100.3 |
100.2 |
100.1 |
99.8 |
99.6 |
2012-13 |
100.7 |
100.5 |
100.3 |
100.1 |
99.9 |
99.8 |
99.6 |
99.6 |
B.2.1 WPI - Food Products |
|
2011-12 |
99.7 |
99.6 |
99.3 |
99.9 |
99.9 |
100.2 |
100.0 |
100.3 |
Average |
100.0 |
99.9 |
100.0 |
100.4 |
100.5 |
100.5 |
100.0 |
99.9 |
2012-13 |
99.7 |
99.6 |
99.2 |
99.9 |
99.9 |
100.2 |
100.0 |
100.4 |
B.2.1.1 WPI - Grain Mill Products |
|
2011-12 |
99.6 |
98.5 |
98.7 |
99.2 |
99.3 |
99.6 |
100.2 |
100.7 |
Average |
98.6 |
97.8 |
98.2 |
99.1 |
99.4 |
100.1 |
100.6 |
101.1 |
2012-13 |
99.6 |
98.5 |
98.7 |
99.2 |
99.4 |
99.6 |
100.1 |
100.6 |
B.2.1.2 WPI - Sugar |
|
2011-12 |
99.7 |
99.2 |
99.0 |
99.8 |
99.2 |
98.9 |
99.5 |
100.8 |
Average |
99.6 |
99.3 |
99.5 |
100.0 |
100.2 |
100.2 |
100.5 |
100.8 |
2012-13 |
99.8 |
99.2 |
98.9 |
99.8 |
99.1 |
98.9 |
99.4 |
100.9 |
B.2.1.3 WPI - Edible Oils |
|
2011-12 |
100.0 |
100.4 |
100.4 |
100.2 |
100.5 |
100.1 |
99.2 |
99.1 |
Average |
99.7 |
100.2 |
100.0 |
100.6 |
101.1 |
100.4 |
99.7 |
99.6 |
2012-13 |
100.0 |
100.3 |
100.3 |
100.2 |
100.4 |
100.1 |
99.2 |
99.1 |
B.3 WPI - Freely Priced Petroleum Products (ex-Petrol Group) |
|
2011-12 |
101.0 |
102.2 |
100.2 |
101.0 |
100.0 |
99.6 |
98.1 |
98.6 |
Average |
99.6 |
100.9 |
100.4 |
101.7 |
101.8 |
101.6 |
99.9 |
99.6 |
2012-13 |
101.2 |
102.4 |
100.1 |
100.7 |
99.8 |
99.2 |
98.0 |
98.5 |
B.4 WPI - Non Food Manufactured Products |
|
2011-12 |
100.6 |
100.5 |
100.4 |
100.0 |
99.9 |
99.7 |
99.6 |
99.4 |
Average |
100.4 |
100.4 |
100.3 |
100.2 |
100.1 |
99.9 |
99.9 |
99.6 |
2012-13 |
100.6 |
100.5 |
100.4 |
100.0 |
99.9 |
99.7 |
99.6 |
99.4 |
B.5 WPI - Non Food Non-Fuel |
|
2011-12 |
101.3 |
100.9 |
100.8 |
100.1 |
99.8 |
99.6 |
99.3 |
99.2 |
Average |
100.7 |
100.7 |
100.6 |
100.3 |
100.3 |
100.0 |
99.8 |
99.5 |
2012-13 |
101.4 |
100.9 |
100.7 |
100.0 |
99.7 |
99.6 |
99.3 |
99.3 |
C.1 Consumer Price Index for Industrial Workers (base: 2001=100) |
|
2011-12 |
99.1 |
99.1 |
99.5 |
100.6 |
100.5 |
100.6 |
100.9 |
101.0 |
Average |
99.3 |
99.4 |
99.7 |
100.7 |
100.6 |
100.5 |
100.9 |
100.8 |
2012-13 |
99.1 |
99.0 |
99.5 |
100.6 |
100.5 |
100.6 |
100.9 |
101.0 |
Table 1: Monthly Seasonal Factors of Selected Economic Time Series (April - March) (Contd.) |
|
Year |
Dec |
Jan |
Feb |
Mar |
Peak
Month |
Peak
Value |
Trough
Month |
Trough
Value |
1 |
10 |
11 |
12 |
13 |
14 |
15 |
16 |
17 |
B.1.2.2 WPI - Oil Seeds |
|
2011-12 |
98.3 |
99.8 |
100.0 |
100.2 |
Jun |
101.8 |
Nov |
97.3 |
Average |
98.6 |
99.8 |
99.6 |
99.4 |
Jul |
101.7 |
Nov |
98.0 |
2012-13 |
98.2 |
99.8 |
100.0 |
100.4 |
Jun |
101.6 |
Nov |
97.2 |
B.2 WPI - Manufactured Products |
|
2011-12 |
99.5 |
99.9 |
100.0 |
100.0 |
Apr |
100.7 |
Dec |
99.5 |
Average |
99.4 |
99.7 |
99.7 |
99.8 |
Apr |
100.5 |
Dec |
99.4 |
2012-13 |
99.6 |
99.9 |
100.0 |
100.0 |
Apr |
100.7 |
Nov |
99.6 |
B.2.1 WPI - Food Products |
|
2011-12 |
100.6 |
100.7 |
100.2 |
99.6 |
Jan |
100.7 |
Jun |
99.3 |
Average |
99.6 |
100.0 |
99.9 |
99.5 |
Sep |
100.5 |
Mar |
99.5 |
2012-13 |
100.7 |
100.6 |
100.2 |
99.6 |
Dec |
100.7 |
Jun |
99.2 |
B.2.1.1 WPI - Grain Mill Products |
|
2011-12 |
100.5 |
101.5 |
101.4 |
100.8 |
Jan |
101.5 |
May |
98.5 |
Average |
101.1 |
101.7 |
101.7 |
100.3 |
Jan |
101.7 |
May |
97.8 |
2012-13 |
100.5 |
101.5 |
101.4 |
100.8 |
Jan |
101.5 |
May |
98.5 |
B.2.1.2 WPI - Sugar |
| |
2011-12 |
101.5 |
101.6 |
100.5 |
100.5 |
Jan |
101.6 |
Sep |
98.9 |
Average |
100.6 |
100.3 |
99.5 |
99.8 |
Nov |
100.8 |
May |
99.3 |
2012-13 |
101.5 |
101.7 |
100.7 |
100.5 |
Jan |
101.7 |
Sep |
98.9 |
B.2.1.3 WPI - Edible Oils |
|
2011-12 |
100.0 |
100.6 |
99.9 |
99.9 |
Jan |
100.6 |
Nov |
99.1 |
Average |
100.1 |
99.9 |
99.5 |
99.3 |
Aug |
101.1 |
Mar |
99.3 |
2012-13 |
99.9 |
100.6 |
99.9 |
100.0 |
Jan |
100.6 |
Nov |
99.1 |
B.3 WPI - Freely Priced Petroleum Products (ex-Petrol Group) |
|
2011-12 |
99.6 |
99.8 |
99.3 |
101.0 |
May |
102.2 |
Oct |
98.1 |
Average |
99.4 |
98.4 |
98.0 |
99.0 |
Aug |
101.8 |
Feb |
98.0 |
2012-13 |
99.7 |
100.0 |
99.4 |
101.3 |
May |
102.4 |
Oct |
98.0 |
B.4 WPI - Non Food Manufactured Products |
|
2011-12 |
99.4 |
99.9 |
100.1 |
100.5 |
Apr |
100.6 |
Dec |
99.4 |
Average |
99.4 |
99.8 |
99.9 |
100.2 |
Apr |
100.4 |
Dec |
99.4 |
2012-13 |
99.4 |
100.0 |
100.2 |
100.5 |
Apr |
100.6 |
Dec |
99.4 |
B.5 WPI - Non Food Non-Fuel |
| |
2011-12 |
99.2 |
99.6 |
99.9 |
100.4 |
Apr |
101.3 |
Dec |
99.2 |
Average |
99.3 |
99.4 |
99.5 |
99.9 |
Apr |
100.7 |
Dec |
99.3 |
2012-13 |
99.2 |
99.7 |
100.0 |
100.5 |
Apr |
101.4 |
Dec |
99.2 |
C.1 Consumer Price Index for Industrial Workers (base: 2001=100) |
|
2011-12 |
100.1 |
100.1 |
99.5 |
99.1 |
Nov |
101.0 |
May |
99.1 |
Average |
99.9 |
99.9 |
99.4 |
99.1 |
Oct |
100.9 |
Mar |
99.1 |
2012-13 |
100.1 |
100.1 |
99.5 |
99.2 |
Nov |
101.0 |
May |
99.0 |
Table 1: Monthly Seasonal Factors of Selected Economic Time Series (April - March) (Contd.) |
|
Year |
Apr |
May |
Jun |
Jul |
Aug |
Sep |
Oct |
Nov |
1 |
2 |
3 |
4 |
5 |
6 |
7 |
8 |
9 |
C.2 Consumer Price Index for Agricultural Labourers (base: 1986-87=100) |
|
2011-12 |
98.8 |
98.9 |
99.5 |
100.2 |
100.5 |
100.7 |
100.8 |
101.1 |
Average |
98.9 |
99.1 |
99.7 |
100.3 |
100.6 |
100.8 |
101.0 |
101.0 |
2012-13 |
98.8 |
98.9 |
99.5 |
100.2 |
100.5 |
100.7 |
100.8 |
101.1 |
C.3 Consumer Price Index for Rural Labourers (base: 1986-87=100) |
|
2011-12 |
98.9 |
99.0 |
99.4 |
100.2 |
100.4 |
100.6 |
100.9 |
101.0 |
Average |
99.0 |
99.2 |
99.6 |
100.3 |
100.6 |
100.7 |
101.0 |
101.0 |
2012-13 |
98.9 |
98.9 |
99.4 |
100.2 |
100.4 |
100.6 |
100.8 |
101.0 |
D. IIP (base: 2004-05 = 100) General Index |
|
2011-12 |
97.4 |
98.2 |
99.1 |
98.3 |
95.5 |
97.4 |
99.0 |
97.5 |
Average |
96.4 |
98.5 |
98.0 |
98.0 |
96.3 |
97.6 |
98.7 |
98.4 |
2012-13 |
97.5 |
98.1 |
99.0 |
98.4 |
95.5 |
97.2 |
99.0 |
97.5 |
D.1.1 IIP - Basic Goods Industries |
|
2011-12 |
98.3 |
100.6 |
98.2 |
98.0 |
97.7 |
94.9 |
99.0 |
97.6 |
Average |
97.9 |
100.6 |
98.0 |
98.7 |
97.8 |
95.5 |
99.8 |
98.2 |
2012-13 |
98.3 |
100.6 |
98.1 |
98.0 |
97.6 |
94.8 |
98.9 |
97.7 |
D.1.2 IIP - Capital Goods Industries |
| |
2011-12 |
91.0 |
87.5 |
112.1 |
94.4 |
93.0 |
107.9 |
103.4 |
93.8 |
Average |
89.1 |
91.5 |
102.3 |
96.0 |
95.9 |
106.4 |
100.4 |
96.2 |
2012-13 |
91.2 |
87.2 |
112.7 |
94.1 |
92.7 |
107.2 |
103.5 |
93.8 |
D.1.3 IIP - Intermediate Goods Industries |
|
2011-12 |
97.6 |
99.7 |
99.4 |
101.5 |
99.9 |
98.2 |
99.3 |
97.7 |
Average |
96.3 |
100.2 |
99.4 |
101.8 |
100.6 |
99.1 |
99.2 |
98.0 |
2012-13 |
97.8 |
99.7 |
99.3 |
101.4 |
99.8 |
98.0 |
99.3 |
97.8 |
D.1.4 IIP - Consumer Goods Industries |
|
2011-12 |
99.7 |
98.6 |
97.9 |
98.5 |
92.8 |
94.7 |
94.5 |
96.2 |
Average |
98.5 |
97.8 |
95.5 |
96.8 |
93.5 |
95.1 |
95.6 |
97.1 |
2012-13 |
99.8 |
98.3 |
97.9 |
98.5 |
92.6 |
94.6 |
94.2 |
96.3 |
D.1.4.1 IIP - Consumer Durable Goods Industries |
|
2011-12 |
100.1 |
98.8 |
97.7 |
100.8 |
95.1 |
100.6 |
102.7 |
99.2 |
Average |
97.2 |
101.4 |
97.5 |
99.7 |
97.4 |
102.1 |
105.3 |
100.8 |
2012-13 |
100.2 |
98.2 |
97.5 |
101.0 |
94.8 |
100.8 |
102.4 |
99.1 |
D.1.4.2 IIP - Consumer Non-Durable Goods Industries |
|
2011-12 |
98.3 |
97.7 |
97.5 |
95.9 |
90.8 |
89.4 |
88.6 |
96.5 |
Average |
98.8 |
96.0 |
94.1 |
94.6 |
91.1 |
90.8 |
90.3 |
97.3 |
2012-13 |
98.3 |
97.7 |
97.7 |
95.9 |
90.9 |
89.4 |
88.4 |
96.3 |
D.2.1 IIP - Mining |
| |
2011-12 |
97.4 |
99.1 |
95.2 |
93.7 |
92.9 |
90.1 |
98.5 |
101.0 |
Average |
96.8 |
99.5 |
95.5 |
95.1 |
93.4 |
91.7 |
98.8 |
100.2 |
2012-13 |
97.5 |
99.2 |
95.1 |
93.7 |
92.9 |
90.0 |
98.4 |
101.1 |
Table 1: Monthly Seasonal Factors of Selected Economic Time Series (April - March) (Contd.) |
|
Year |
Dec |
Jan |
Feb |
Mar |
Peak
Month |
Peak
Value |
Trough
Month |
Trough
Value |
1 |
10 |
11 |
12 |
13 |
14 |
15 |
16 |
17 |
C.2 Consumer Price Index for Agricultural Labourers (base: 1986-87=100) |
|
2011-12 |
100.7 |
100.0 |
99.6 |
99.1 |
Nov |
101.1 |
Apr |
98.8 |
Average |
100.4 |
99.8 |
99.4 |
99.1 |
Nov |
101.0 |
Apr |
98.9 |
2012-13 |
100.7 |
100.0 |
99.6 |
99.2 |
Nov |
101.1 |
Apr |
98.8 |
C.3 Consumer Price Index for Rural Labourers (base: 1986-87=100) |
|
2011-12 |
100.7 |
100.1 |
99.7 |
99.1 |
Nov |
101.0 |
Apr |
98.9 |
Average |
100.4 |
99.8 |
99.5 |
99.1 |
Nov |
101.0 |
Apr |
99.0 |
2012-13 |
100.7 |
100.1 |
99.7 |
99.2 |
Nov |
101.0 |
Apr |
98.9 |
D. IIP (base: 2004-05 = 100) General Index |
|
2011-12 |
104.7 |
104.1 |
99.3 |
109.5 |
Mar |
109.5 |
Aug |
95.5 |
Average |
104.8 |
104.3 |
99.4 |
109.4 |
Mar |
109.4 |
Aug |
96.3 |
2012-13 |
104.6 |
104.1 |
99.4 |
109.5 |
Mar |
109.5 |
Aug |
95.5 |
D.1.1 IIP - Basic Goods Industries |
|
2011-12 |
102.8 |
104.6 |
98.5 |
110.0 |
Mar |
110.0 |
Sep |
94.9 |
Average |
103.1 |
104.3 |
97.5 |
108.6 |
Mar |
108.6 |
Sep |
95.5 |
2012-13 |
103.0 |
104.7 |
98.4 |
110.0 |
Mar |
110.0 |
Sep |
94.8 |
D.1.2 IIP - Capital Goods Industries |
|
2011-12 |
101.8 |
95.4 |
97.1 |
122.8 |
Mar |
122.8 |
May |
87.5 |
Average |
102.9 |
97.5 |
98.4 |
123.1 |
Mar |
123.1 |
Apr |
89.1 |
2012-13 |
101.9 |
95.6 |
97.5 |
122.9 |
Mar |
122.9 |
May |
87.2 |
D.1.3 IIP - Intermediate Goods Industries |
|
2011-12 |
102.8 |
100.9 |
97.5 |
105.5 |
Mar |
105.5 |
Feb |
97.5 |
Average |
103.1 |
100.6 |
96.6 |
105.2 |
Mar |
105.2 |
Apr |
96.3 |
2012-13 |
102.9 |
101.0 |
97.6 |
105.3 |
Mar |
105.3 |
Feb |
97.6 |
D.1.4 IIP - Consumer Goods Industries |
|
2011-12 |
107.1 |
107.9 |
104.5 |
108.0 |
Mar |
108.0 |
Aug |
92.8 |
Average |
107.3 |
109.4 |
104.4 |
108.2 |
Jan |
109.4 |
Aug |
93.5 |
2012-13 |
107.2 |
108.1 |
104.8 |
108.2 |
Mar |
108.2 |
Aug |
92.6 |
D.1.4.1 IIP - Consumer Durable Goods Industries |
|
2011-12 |
97.9 |
100.4 |
100.3 |
107.3 |
Mar |
107.3 |
Aug |
95.1 |
Average |
95.7 |
100.0 |
97.6 |
105.0 |
Oct |
105.3 |
Dec |
95.7 |
2012-13 |
98.2 |
100.3 |
100.4 |
107.7 |
Mar |
107.7 |
Aug |
94.8 |
D.1.4.2 IIP - Consumer Non-Durable Goods Industries |
|
2011-12 |
114.9 |
113.4 |
108.9 |
108.1 |
Dec |
114.9 |
Oct |
88.6 |
Average |
114.2 |
113.9 |
108.5 |
109.6 |
Dec |
114.2 |
Oct |
90.3 |
2012-13 |
114.7 |
113.4 |
109.2 |
108.1 |
Dec |
114.7 |
Oct |
88.4 |
D.2.1 IIP - Mining |
|
2011-12 |
107.0 |
107.5 |
102.1 |
115.5 |
Mar |
115.5 |
Sep |
90.1 |
Average |
106.3 |
107.3 |
101.3 |
114.5 |
Mar |
114.5 |
Sep |
91.7 |
2012-13 |
107.0 |
107.6 |
102.1 |
115.5 |
Mar |
115.5 |
Sep |
90.0 |
Table 1: Monthly Seasonal Factors of Selected Economic Time Series (April - March) (Contd.) |
|
Year |
Apr |
May |
Jun |
Jul |
Aug |
Sep |
Oct |
Nov |
1 |
2 |
3 |
4 |
5 |
6 |
7 |
8 |
9 |
D.2.2 IIP - Manufacturing |
|
2011-12 |
97.0 |
97.4 |
98.7 |
98.6 |
95.6 |
98.6 |
98.8 |
97.4 |
Average |
95.8 |
97.8 |
97.8 |
98.2 |
96.5 |
98.4 |
98.3 |
98.3 |
2012-13 |
97.1 |
97.2 |
98.6 |
98.7 |
95.6 |
98.5 |
98.9 |
97.3 |
D.2.2.1 IIP - Food products and beverages |
|
2011-12 |
99.7 |
92.9 |
93.4 |
84.8 |
73.8 |
70.1 |
75.7 |
96.5 |
Average |
98.9 |
90.8 |
88.2 |
81.9 |
72.8 |
70.6 |
76.7 |
97.5 |
2012-13 |
99.6 |
93.2 |
94.3 |
85.3 |
73.9 |
69.9 |
75.2 |
96.2 |
D.2.2.2 IIP - Textiles |
|
2011-12 |
98.6 |
97.7 |
97.3 |
101.3 |
102.9 |
100.9 |
102.2 |
99.2 |
Average |
98.4 |
99.2 |
98.5 |
101.5 |
102.2 |
100.0 |
101.6 |
99.9 |
2012-13 |
98.6 |
97.5 |
97.0 |
101.2 |
103.1 |
101.1 |
102.0 |
99.0 |
D.2.2.3 IIP - Wearing apparel; dressing and dyeing of fur |
|
2011-12 |
101.1 |
101.8 |
95.0 |
97.4 |
88.3 |
87.6 |
89.2 |
87.9 |
Average |
101.3 |
99.2 |
98.1 |
101.1 |
89.3 |
90.6 |
88.3 |
88.4 |
2012-13 |
100.9 |
102.5 |
94.5 |
96.8 |
88.2 |
87.5 |
89.5 |
87.5 |
D.2.2.4 IIP - Wood and products of wood & cork except furniture; articles of straw & plating materials |
|
2011-12 |
90.8 |
102.7 |
97.5 |
100.0 |
98.6 |
93.1 |
95.4 |
99.4 |
Average |
89.1 |
103.4 |
98.6 |
100.8 |
99.5 |
94.0 |
97.2 |
99.3 |
2012-13 |
90.8 |
102.7 |
97.1 |
99.7 |
98.7 |
92.9 |
95.1 |
99.3 |
D.2.2.5 IIP - Paper and paper products |
|
2011-12 |
97.0 |
101.0 |
98.4 |
101.9 |
102.5 |
99.1 |
100.3 |
98.4 |
Average |
97.3 |
101.3 |
99.1 |
102.5 |
102.7 |
99.6 |
99.8 |
97.8 |
2012-13 |
96.8 |
101.1 |
98.2 |
101.9 |
102.5 |
98.9 |
100.4 |
98.6 |
D.2.2.6 IIP - Publishing, printing & reproduction of recorded media |
|
2011-12 |
98.8 |
102.0 |
98.0 |
101.8 |
100.4 |
97.1 |
105.7 |
99.1 |
Average |
98.9 |
101.5 |
98.6 |
102.6 |
101.3 |
98.2 |
104.8 |
99.0 |
2012-13 |
98.9 |
101.9 |
97.9 |
101.6 |
100.3 |
97.0 |
105.8 |
99.1 |
D.2.2.7 IIP - Coke, refined petroleum products & nuclear fuel |
|
2011-12 |
96.0 |
98.6 |
100.9 |
102.0 |
100.5 |
95.8 |
100.6 |
96.9 |
Average |
95.0 |
98.6 |
100.7 |
102.5 |
100.5 |
96.6 |
100.8 |
97.1 |
2012-13 |
96.1 |
98.6 |
101.0 |
101.9 |
100.6 |
95.5 |
100.6 |
96.7 |
D.2.2.8 IIP - Chemicals and chemical products |
|
2011-12 |
97.3 |
102.0 |
102.6 |
104.3 |
101.8 |
102.2 |
97.9 |
97.1 |
Average |
95.9 |
101.3 |
102.9 |
104.3 |
102.2 |
102.4 |
99.6 |
97.8 |
2012-13 |
97.4 |
101.8 |
102.5 |
104.1 |
101.7 |
102.2 |
97.7 |
97.1 |
D.2.2.9 IIP - Rubber and plastics products |
|
2011-12 |
99.0 |
102.4 |
102.4 |
100.4 |
95.8 |
96.9 |
98.0 |
98.8 |
Average |
99.1 |
102.7 |
102.0 |
100.5 |
96.1 |
97.5 |
98.1 |
98.9 |
2012-13 |
99.1 |
102.2 |
102.3 |
100.3 |
95.7 |
96.8 |
98.0 |
98.8 |
Table 1: Monthly Seasonal Factors of Selected Economic Time Series (April - March) (Contd.) |
|
Year |
Dec |
Jan |
Feb |
Mar |
Peak Month |
Peak Value |
Trough Month |
Trough Value |
1 |
10 |
11 |
12 |
13 |
14 |
15 |
16 |
17 |
D.2.2 IIP - Manufacturing |
|
2011-12 |
105.1 |
103.9 |
99.8 |
109.1 |
Mar |
109.1 |
Aug |
95.6 |
Average |
105.2 |
104.2 |
100.0 |
109.2 |
Mar |
109.2 |
Apr |
95.8 |
2012-13 |
105.1 |
104.0 |
99.9 |
109.1 |
Mar |
109.1 |
Aug |
95.6 |
D.2.2.1 IIP - Food products and beverages |
|
2011-12 |
132.7 |
131.8 |
124.5 |
123.3 |
Dec |
132.7 |
Sep |
70.1 |
Average |
135.8 |
134.8 |
125.7 |
124.3 |
Dec |
135.8 |
Sep |
70.6 |
2012-13 |
132.1 |
131.5 |
125.0 |
123.9 |
Dec |
132.1 |
Sep |
69.9 |
D.2.2.2 IIP - Textiles |
|
2011-12 |
101.3 |
102.4 |
96.8 |
99.7 |
Aug |
102.9 |
Feb |
96.8 |
Average |
101.5 |
101.7 |
95.2 |
100.5 |
Aug |
102.2 |
Feb |
95.2 |
2012-13 |
101.3 |
102.6 |
97.0 |
99.7 |
Aug |
103.1 |
Jun |
97.0 |
D.2.2.3 IIP - Wearing apparel; dressing and dyeing of fur |
|
2011-12 |
117.0 |
113.2 |
109.5 |
112.5 |
Dec |
117.0 |
Sep |
87.6 |
Average |
112.0 |
110.7 |
108.5 |
113.3 |
Mar |
113.3 |
Oct |
88.3 |
2012-13 |
117.1 |
113.4 |
109.6 |
112.8 |
Dec |
117.1 |
Sep |
87.5 |
D.2.2.4 IIP - Wood and products of wood & cork except furniture; articles of straw & plating materials |
|
2011-12 |
109.6 |
102.4 |
104.2 |
106.9 |
Dec |
109.6 |
Apr |
90.8 |
Average |
109.3 |
101.6 |
103.1 |
104.6 |
Dec |
109.3 |
Apr |
89.1 |
2012-13 |
109.7 |
102.9 |
104.4 |
107.1 |
Dec |
109.7 |
Apr |
90.8 |
D.2.2.5 IIP - Paper and paper products |
|
2011-12 |
100.2 |
99.9 |
95.9 |
105.6 |
Mar |
105.6 |
Feb |
95.9 |
Average |
100.3 |
99.5 |
95.0 |
105.5 |
Mar |
105.5 |
Feb |
95.0 |
2012-13 |
100.3 |
99.9 |
96.0 |
105.5 |
Mar |
105.5 |
Feb |
96.0 |
D.2.2.6 IIP - Publishing, printing & reproduction of recorded media |
|
2011-12 |
102.3 |
100.1 |
95.4 |
99.4 |
Oct |
105.7 |
Feb |
95.4 |
Average |
101.7 |
99.6 |
94.9 |
99.4 |
Oct |
104.8 |
Feb |
94.9 |
2012-13 |
102.4 |
100.1 |
95.6 |
99.5 |
Oct |
105.8 |
Feb |
95.6 |
D.2.2.7 IIP - Coke, refi ned petroleum products & nuclear fuel |
|
2011-12 |
102.2 |
103.6 |
98.0 |
104.7 |
Mar |
104.7 |
Sep |
95.8 |
Average |
101.7 |
103.7 |
97.5 |
105.1 |
Mar |
105.1 |
Apr |
95.0 |
2012-13 |
102.5 |
103.7 |
98.0 |
104.7 |
Mar |
104.7 |
Sep |
95.5 |
D.2.2.8 IIP - Chemicals and chemical products |
|
2011-12 |
100.5 |
99.2 |
94.6 |
100.9 |
Jul |
104.3 |
Feb |
94.6 |
Average |
100.3 |
98.8 |
93.8 |
100.6 |
Jul |
104.3 |
Feb |
93.8 |
2012-13 |
100.5 |
99.3 |
94.8 |
101.1 |
Jul |
104.1 |
Feb |
94.8 |
D.2.2.9 IIP - Rubber and plastics products |
|
2011-12 |
101.6 |
100.8 |
97.3 |
106.8 |
Mar |
106.8 |
Aug |
95.8 |
Average |
101.3 |
101.3 |
96.9 |
105.9 |
Mar |
105.9 |
Aug |
96.1 |
2012-13 |
101.7 |
100.8 |
97.3 |
107.0 |
Mar |
107.0 |
Aug |
95.7 |
Table 1: Monthly Seasonal Factors of Selected Economic Time Series (April - March) (Contd.) |
|
Year |
Apr |
May |
Jun |
Jul |
Aug |
Sep |
Oct |
Nov |
1 |
2 |
3 |
4 |
5 |
6 |
7 |
8 |
9 |
D.2.2.10 IIP - Other non-metallic mineral products |
| |
2011-12 |
101.5 |
100.6 |
97.1 |
99.9 |
94.9 |
93.3 |
101.3 |
94.9 |
Average |
101.0 |
101.4 |
98.1 |
98.9 |
95.2 |
93.9 |
100.7 |
95.7 |
2012-13 |
101.5 |
100.6 |
96.9 |
99.8 |
94.9 |
93.2 |
101.3 |
95.0 |
D.2.2.11 IIP - Basic metals |
| |
2011-12 |
96.6 |
99.5 |
98.7 |
99.7 |
99.7 |
98.4 |
100.4 |
97.6 |
Average |
98.5 |
100.2 |
98.5 |
99.3 |
100.5 |
98.0 |
101.1 |
97.7 |
2012-13 |
96.5 |
99.4 |
98.8 |
99.6 |
99.5 |
98.4 |
100.4 |
97.6 |
D.2.2.12 IIP - Fabricated metal products, except machinery & equipment |
| |
2011-12 |
83.0 |
88.6 |
96.7 |
94.9 |
94.4 |
102.3 |
95.1 |
97.2 |
Average |
84.9 |
91.5 |
97.9 |
95.0 |
94.4 |
102.3 |
96.0 |
98.6 |
2012-13 |
82.9 |
88.1 |
96.4 |
94.9 |
94.2 |
102.3 |
94.8 |
97.2 |
D.2.2.13 IIP - Machinery and equipment n.e.c. |
| |
2011-12 |
98.5 |
102.8 |
95.8 |
89.6 |
88.9 |
99.0 |
91.5 |
88.5 |
Average |
97.1 |
101.9 |
97.6 |
90.9 |
90.3 |
99.3 |
92.7 |
90.1 |
2012-13 |
98.7 |
102.5 |
95.3 |
89.2 |
88.7 |
98.8 |
91.3 |
88.6 |
D.2.2.14 IIP - Office, accounting and computing machinery |
| |
2011-12 |
85.4 |
87.7 |
114.9 |
78.1 |
101.2 |
118.8 |
85.9 |
94.8 |
Average |
82.7 |
92.3 |
113.3 |
81.1 |
101.0 |
122.1 |
88.1 |
94.2 |
2012-13 |
86.4 |
86.7 |
114.9 |
76.9 |
101.1 |
118.9 |
85.7 |
94.7 |
D.2.2.15 IIP - Radio, TV and communication equipment & apparatus |
| |
2011-12 |
92.1 |
91.2 |
98.7 |
105.2 |
99.4 |
104.3 |
106.2 |
105.2 |
Average |
94.0 |
94.1 |
99.1 |
103.6 |
100.7 |
101.4 |
109.2 |
105.0 |
2012-13 |
91.8 |
90.7 |
98.4 |
106.0 |
99.3 |
104.8 |
106.3 |
105.3 |
D.2.2.16 IIP - Medical, precision and optical instruments, watches and clocks |
| |
2011-12 |
83.8 |
95.2 |
100.2 |
98.5 |
95.7 |
100.8 |
97.2 |
93.1 |
Average |
82.5 |
97.4 |
103.1 |
101.0 |
98.2 |
101.1 |
96.5 |
90.4 |
2012-13 |
83.6 |
94.8 |
100.0 |
97.9 |
95.5 |
100.6 |
97.5 |
93.8 |
D.2.2.17 IIP - Motor vehicles, trailers & semi-trailers |
| |
2011-12 |
99.7 |
95.3 |
91.5 |
99.4 |
96.4 |
98.4 |
94.5 |
100.3 |
Average |
95.9 |
97.9 |
91.3 |
99.5 |
97.6 |
97.8 |
98.3 |
101.1 |
2012-13 |
100.3 |
94.9 |
91.4 |
99.2 |
96.0 |
98.5 |
93.8 |
100.6 |
D.2.2.18 IIP - Other transport equipment |
| |
2011-12 |
91.8 |
94.1 |
94.5 |
99.6 |
101.0 |
103.2 |
109.4 |
103.8 |
Average |
91.2 |
96.0 |
94.9 |
97.3 |
100.2 |
105.1 |
110.4 |
106.4 |
2012-13 |
92.2 |
93.8 |
94.4 |
99.8 |
100.9 |
102.9 |
109.7 |
103.2 |
D.2.3 IIP - Electricity |
| |
2011-12 |
101.1 |
103.8 |
99.1 |
100.8 |
100.7 |
97.5 |
101.5 |
95.4 |
Average |
100.2 |
103.5 |
98.3 |
99.8 |
100.1 |
98.4 |
101.6 |
96.4 |
2012-13 |
101.2 |
103.9 |
99.0 |
100.8 |
100.8 |
97.3 |
101.4 |
95.4 |
Table 1: Monthly Seasonal Factors of Selected Economic Time Series (April - March) (Contd.) |
| |
Year |
Dec |
Jan |
Feb |
Mar |
Peak Month |
Peak Value |
Trough Month |
Trough Value |
1 |
10 |
11 |
12 |
13 |
14 |
15 |
16 |
17 |
D.2.2.10 IIP - Other non-metallic mineral products |
| |
2011-12 |
102.6 |
103.2 |
99.9 |
111.0 |
Mar |
111.0 |
Sep |
93.3 |
Average |
102.4 |
102.8 |
99.1 |
110.9 |
Mar |
110.9 |
Sep |
93.9 |
2012-13 |
102.6 |
103.3 |
100.0 |
111.0 |
Mar |
111.0 |
Sep |
93.2 |
D.2.2.11 IIP - Basic metals |
| |
2011-12 |
100.8 |
103.6 |
97.3 |
107.9 |
Mar |
107.9 |
Apr |
96.6 |
Average |
100.8 |
102.0 |
96.5 |
107.5 |
Mar |
107.5 |
Feb |
96.5 |
2012-13 |
101.0 |
103.6 |
97.3 |
107.8 |
Mar |
107.8 |
Apr |
96.5 |
D.2.2.12 IIP - Fabricated metal products, except machinery & equipment |
| |
2011-12 |
106.9 |
100.6 |
102.1 |
139.2 |
Mar |
139.2 |
Apr |
83.0 |
Average |
106.1 |
100.4 |
101.2 |
133.2 |
Mar |
133.2 |
Apr |
84.9 |
2012-13 |
107.2 |
100.6 |
102.3 |
139.6 |
Mar |
139.6 |
Apr |
82.9 |
D.2.2.13 IIP - Machinery and equipment n.e.c. |
| |
2011-12 |
97.2 |
99.7 |
109.1 |
140.6 |
Mar |
140.6 |
Nov |
88.5 |
Average |
98.9 |
98.4 |
105.2 |
138.2 |
Mar |
138.2 |
Nov |
90.1 |
2012-13 |
97.4 |
100.0 |
109.6 |
140.5 |
Mar |
140.5 |
Nov |
88.6 |
D.2.2.14 IIP - Office, accounting and computing machinery |
| |
2011-12 |
112.3 |
75.3 |
86.8 |
159.5 |
Mar |
159.5 |
Jan |
75.3 |
Average |
108.9 |
77.0 |
85.3 |
155.0 |
Mar |
155.0 |
Jan |
77.0 |
2012-13 |
113.0 |
75.5 |
86.9 |
159.8 |
Mar |
159.8 |
Jan |
75.5 |
D.2.2.15 IIP - Radio, TV and communication equipment & apparatus |
| |
2011-12 |
108.2 |
104.7 |
93.2 |
91.7 |
Dec |
108.2 |
May |
91.2 |
Average |
102.3 |
103.4 |
94.1 |
93.7 |
Oct |
109.2 |
Mar |
93.7 |
2012-13 |
108.2 |
104.4 |
93.2 |
91.5 |
Dec |
108.2 |
May |
90.7 |
D.2.2.16 IIP - Medical, precision and optical instruments, watches and clocks |
| |
2011-12 |
110.2 |
100.9 |
95.8 |
129.7 |
Mar |
129.7 |
Apr |
83.8 |
Average |
111.2 |
98.0 |
94.5 |
127.3 |
Mar |
127.3 |
Apr |
82.5 |
2012-13 |
109.8 |
101.1 |
96.1 |
129.6 |
Mar |
129.6 |
Apr |
83.6 |
D.2.2.17 IIP - Motor vehicles, trailers & semi-trailers |
| |
2011-12 |
95.6 |
104.6 |
107.8 |
116.8 |
Mar |
116.8 |
Jun |
91.5 |
Average |
93.2 |
104.0 |
106.2 |
117.3 |
Mar |
117.3 |
Jun |
91.3 |
2012-13 |
95.7 |
104.9 |
108.0 |
116.5 |
Mar |
116.5 |
Jun |
91.4 |
D.2.2.18 IIP - Other transport equipment |
| |
2011-12 |
97.6 |
98.5 |
95.3 |
111.4 |
Mar |
111.4 |
Apr |
91.8 |
Average |
95.6 |
100.2 |
94.7 |
108.3 |
Oct |
110.4 |
Apr |
91.2 |
2012-13 |
97.9 |
98.1 |
95.6 |
111.7 |
Mar |
111.7 |
Apr |
92.2 |
D.2.3 IIP - Electricity |
| |
2011-12 |
98.7 |
100.5 |
94.7 |
106.2 |
Mar |
106.2 |
Feb |
94.7 |
Average |
100.3 |
101.7 |
94.2 |
105.0 |
Mar |
105.0 |
Feb |
94.2 |
2012-13 |
98.7 |
100.5 |
94.8 |
106.1 |
Mar |
106.1 |
Feb |
94.8 |
Table 1: Monthly Seasonal Factors of Selected Economic Time Series (April - March) (Contd.) |
|
Year |
Apr |
May |
Jun |
Jul |
Aug |
Sep |
Oct |
Nov |
1 |
2 |
3 |
4 |
5 |
6 |
7 |
8 |
9 |
D.3 Cement Production |
|
|
|
|
|
|
|
|
|
| |
2011-12 |
104.5 |
102.7 |
99.2 |
97.4 |
92.1 |
89.9 |
98.3 |
92.5 |
Average |
104.7 |
104.8 |
101.4 |
96.9 |
91.0 |
90.9 |
98.0 |
93.8 |
2012-13 |
104.4 |
102.6 |
98.9 |
97.3 |
92.2 |
89.7 |
98.4 |
92.4 |
D.4 Steel Production |
| |
2011-12 |
95.6 |
101.3 |
100.5 |
99.2 |
101.3 |
97.8 |
99.8 |
95.9 |
Average |
96.0 |
99.0 |
98.2 |
98.7 |
100.1 |
97.8 |
101.1 |
98.2 |
2012-13 |
95.4 |
101.2 |
100.7 |
99.2 |
101.4 |
97.7 |
99.8 |
95.9 |
D.5 Coal Production |
| |
2011-12 |
90.7 |
93.6 |
89.1 |
85.5 |
83.1 |
79.3 |
94.1 |
104.0 |
Average |
91.3 |
93.3 |
89.3 |
87.5 |
85.9 |
84.5 |
97.0 |
103.1 |
2012-13 |
90.5 |
93.7 |
88.9 |
85.7 |
82.2 |
78.7 |
93.2 |
104.5 |
D.6 Crude Oil Production |
| |
2011-12 |
98.2 |
100.1 |
98.3 |
101.6 |
101.6 |
99.0 |
102.5 |
99.8 |
Average |
98.3 |
100.6 |
98.9 |
101.4 |
101.0 |
98.4 |
102.4 |
99.2 |
2012-13 |
98.1 |
100.1 |
98.2 |
101.9 |
101.7 |
98.9 |
102.4 |
99.8 |
D.7 Petroleum Refi nery Production |
| |
2011-12 |
97.2 |
100.7 |
100.0 |
102.4 |
100.4 |
95.3 |
100.1 |
96.5 |
Average |
96.0 |
100.7 |
100.4 |
101.6 |
100.5 |
97.2 |
99.7 |
97.6 |
2012-13 |
97.3 |
100.9 |
100.0 |
102.4 |
100.3 |
94.9 |
99.9 |
96.4 |
D.8 Fertiliser Production |
| |
2011-12 |
82.2 |
95.8 |
100.4 |
105.8 |
105.9 |
101.7 |
106.5 |
106.0 |
Average |
81.8 |
95.2 |
98.8 |
105.3 |
105.4 |
102.8 |
107.9 |
107.1 |
2012-13 |
82.5 |
95.9 |
100.5 |
105.9 |
106.0 |
101.3 |
106.4 |
105.6 |
D.9 Natural Gas Production |
| |
2011-12 |
97.6 |
101.8 |
98.7 |
102.4 |
101.1 |
97.7 |
101.6 |
98.9 |
Average |
97.3 |
101.6 |
98.2 |
102.1 |
100.4 |
97.8 |
103.0 |
99.7 |
2012-13 |
97.7 |
101.5 |
98.8 |
102.4 |
100.8 |
97.6 |
101.4 |
98.8 |
D.10 Production of Commercial Motor Vehicles |
| |
2011-12 |
92.7 |
91.7 |
91.9 |
98.8 |
98.1 |
100.8 |
95.3 |
102.9 |
Average |
86.4 |
92.7 |
92.2 |
97.1 |
95.0 |
99.8 |
100.8 |
105.5 |
2012-13 |
92.8 |
91.3 |
92.1 |
98.8 |
97.6 |
101.1 |
94.7 |
102.8 |
D.11 Production of Passenger Vehicles |
| |
2011-12 |
102.2 |
96.9 |
88.7 |
101.1 |
95.2 |
97.3 |
101.8 |
101.6 |
Average |
97.2 |
100.6 |
89.4 |
103.9 |
97.8 |
99.7 |
101.4 |
100.7 |
2012-13 |
102.6 |
96.6 |
88.3 |
101.0 |
95.1 |
97.1 |
101.3 |
101.8 |
E.1 Cargo handled at Major Ports |
| |
2011-12 |
100.5 |
102.8 |
95.5 |
96.3 |
94.7 |
91.9 |
98.8 |
100.3 |
Average |
99.0 |
102.1 |
94.6 |
97.3 |
95.6 |
92.7 |
100.6 |
100.2 |
2012-13 |
100.3 |
102.8 |
95.7 |
96.1 |
94.4 |
91.9 |
98.9 |
100.3 |
Table 1: Monthly Seasonal Factors of Selected Economic Time Series (April - March) (Contd.) |
|
Year |
Dec |
Jan |
Feb |
Mar |
Peak Month |
Peak Value |
Trough Month |
Trough Value |
1 |
10 |
11 |
12 |
13 |
14 |
15 |
16 |
17 |
D.3 Cement Production |
| |
2011-12 |
101.5 |
105.5 |
103.0 |
113.9 |
Mar |
113.9 |
Sep |
89.9 |
Average |
101.6 |
104.3 |
100.2 |
112.9 |
Mar |
112.9 |
Sep |
90.9 |
2012-13 |
101.3 |
105.6 |
103.2 |
114.0 |
Mar |
114.0 |
Sep |
89.7 |
D.4 Steel Production |
| |
2011-12 |
101.3 |
103.9 |
98.7 |
104.8 |
Mar |
104.8 |
Apr |
95.6 |
Average |
101.6 |
103.7 |
98.2 |
106.9 |
Mar |
106.9 |
Apr |
96.0 |
2012-13 |
101.5 |
103.9 |
98.6 |
104.6 |
Mar |
104.6 |
Apr |
95.4 |
D.5 Coal Production |
| |
2011-12 |
113.8 |
117.3 |
114.1 |
136.3 |
Mar |
136.3 |
Sep |
79.3 |
Average |
112.3 |
115.5 |
110.3 |
131.2 |
Mar |
131.2 |
Sep |
84.5 |
2012-13 |
114.5 |
117.5 |
114.7 |
136.1 |
Mar |
136.1 |
Sep |
78.7 |
D.6 Crude Oil Production |
| |
2011-12 |
102.7 |
101.3 |
92.6 |
102.3 |
Dec |
102.7 |
Feb |
92.6 |
Average |
102.0 |
102.0 |
92.8 |
102.8 |
Mar |
102.8 |
Feb |
92.8 |
2012-13 |
102.6 |
101.2 |
92.6 |
102.2 |
Dec |
102.6 |
Feb |
92.6 |
D.7 Petroleum Refinery Production |
| |
2011-12 |
102.7 |
102.9 |
96.6 |
105.3 |
Mar |
105.3 |
Sep |
95.3 |
Average |
101.5 |
103.5 |
96.7 |
104.7 |
Mar |
104.7 |
Apr |
96.0 |
2012-13 |
103.0 |
102.9 |
96.6 |
105.3 |
Mar |
105.3 |
Sep |
94.9 |
D.8 Fertiliser Production |
| |
2011-12 |
107.1 |
105.5 |
94.8 |
88.2 |
Dec |
107.1 |
Apr |
82.2 |
Average |
109.0 |
104.3 |
93.7 |
88.4 |
Dec |
109.0 |
Apr |
81.8 |
2012-13 |
106.9 |
105.7 |
95.1 |
88.3 |
Dec |
106.9 |
Apr |
82.5 |
D.9 Natural Gas Production |
| |
2011-12 |
102.1 |
102.3 |
93.2 |
103.0 |
Mar |
103.0 |
Feb |
93.2 |
Average |
102.5 |
102.0 |
92.5 |
102.7 |
Oct |
103.0 |
Feb |
92.5 |
2012-13 |
102.1 |
102.4 |
93.5 |
103.1 |
Mar |
103.1 |
Feb |
93.5 |
D.10 Production of Commercial Motor Vehicles |
| |
2011-12 |
98.3 |
108.2 |
103.9 |
117.8 |
Mar |
117.8 |
May |
91.7 |
Average |
98.1 |
107.7 |
104.2 |
118.6 |
Mar |
118.6 |
Apr |
86.4 |
2012-13 |
99.0 |
108.4 |
104.3 |
117.2 |
Mar |
117.2 |
May |
91.3 |
D.11 Production of Passenger Vehicles |
| |
2011-12 |
91.1 |
102.8 |
108.7 |
113.1 |
Mar |
113.1 |
Jun |
88.7 |
Average |
85.3 |
105.6 |
105.1 |
113.6 |
Mar |
113.6 |
Dec |
85.3 |
2012-13 |
91.4 |
102.8 |
109.2 |
113.0 |
Mar |
113.0 |
Jun |
88.3 |
E.1 Cargo handled at Major Ports |
| |
2011-12 |
104.9 |
107.7 |
97.7 |
109.1 |
Mar |
109.1 |
Sep |
91.9 |
Average |
103.9 |
105.8 |
98.0 |
110.2 |
Mar |
110.2 |
Sep |
92.7 |
2012-13 |
105.0 |
107.9 |
97.6 |
109.1 |
Mar |
109.1 |
Sep |
91.9 |
Table 1: Monthly Seasonal Factors of Selected Economic Time Series (April - March) (Contd.) |
|
Year |
Apr |
May |
Jun |
Jul |
Aug |
Sep |
Oct |
Nov |
1 |
2 |
3 |
4 |
5 |
6 |
7 |
8 |
9 |
E.2 Revenue on Railway Freight Traffic |
| |
2011-12 |
97.4 |
99.9 |
96.3 |
97.6 |
95.9 |
92.5 |
97.6 |
98.5 |
Average |
97.2 |
100.9 |
96.8 |
97.3 |
95.4 |
93.0 |
97.9 |
98.6 |
2012-13 |
97.3 |
99.9 |
96.3 |
97.6 |
96.0 |
92.4 |
97.7 |
98.7 |
E.3 Sales of Commercial Motor Vehicles |
| |
2011-12 |
86.9 |
90.2 |
96.3 |
95.2 |
95.5 |
105.6 |
95.6 |
93.5 |
Average |
80.1 |
88.7 |
95.4 |
89.7 |
94.2 |
106.0 |
100.1 |
96.2 |
2012-13 |
87.2 |
90.4 |
95.8 |
95.6 |
95.5 |
105.8 |
95.2 |
93.5 |
E.4 Sales of Passenger Vehicles |
| |
2011-12 |
96.4 |
97.6 |
92.6 |
94.7 |
98.3 |
99.3 |
103.6 |
98.7 |
Average |
89.7 |
98.0 |
94.7 |
95.6 |
99.9 |
101.3 |
103.6 |
98.0 |
2012-13 |
96.9 |
97.3 |
92.0 |
94.7 |
98.0 |
99.2 |
103.1 |
98.7 |
E.5 Passenger flown (Km) - Domestic |
| |
2011-12 |
100.1 |
113.2 |
105.0 |
96.7 |
92.4 |
88.3 |
101.3 |
102.4 |
Average |
99.4 |
111.0 |
102.9 |
95.5 |
93.3 |
89.6 |
100.1 |
101.8 |
2012-13 |
99.8 |
112.9 |
105.3 |
96.8 |
92.2 |
88.2 |
101.4 |
102.7 |
E.6 Passenger flown (Km) - International |
| |
2011-12 |
93.9 |
98.5 |
96.4 |
101.4 |
104.2 |
105.8 |
110.8 |
101.6 |
Average |
94.6 |
99.5 |
96.2 |
100.1 |
102.2 |
103.9 |
108.1 |
101.6 |
2012-13 |
93.8 |
98.3 |
96.4 |
101.6 |
104.5 |
105.9 |
110.5 |
101.4 |
E.7 Freight Tonne Km flown - Domestic |
| |
2011-12 |
95.6 |
100.5 |
102.7 |
110.8 |
108.0 |
95.4 |
94.7 |
94.8 |
Average |
95.1 |
99.6 |
102.7 |
108.8 |
107.8 |
93.6 |
92.0 |
94.3 |
2012-13 |
95.8 |
100.8 |
103.1 |
110.9 |
107.8 |
95.6 |
94.9 |
94.7 |
E.8 Freight Tonne Km flown - International |
| |
2011-12 |
98.6 |
105.0 |
97.5 |
105.9 |
102.4 |
101.6 |
102.3 |
92.0 |
Average |
101.3 |
102.7 |
97.5 |
102.2 |
99.9 |
103.2 |
103.8 |
95.9 |
2012-13 |
98.6 |
105.6 |
97.4 |
105.7 |
101.8 |
100.9 |
102.5 |
91.5 |
F.1 Exports* |
| |
2011-12 |
99.7 |
101.6 |
102.8 |
103.4 |
97.9 |
100.3 |
97.3 |
88.9 |
Average |
97.0 |
100.2 |
99.8 |
100.1 |
98.2 |
100.7 |
99.9 |
91.0 |
2012-13 |
99.5 |
101.8 |
102.5 |
103.5 |
97.7 |
100.4 |
96.8 |
89.1 |
F.2 Imports* |
| |
2011-12 |
104.0 |
107.4 |
102.8 |
104.9 |
100.5 |
97.8 |
105.0 |
95.5 |
Average |
100.6 |
107.4 |
100.3 |
103.0 |
100.9 |
102.2 |
104.2 |
96.7 |
2012-13 |
103.4 |
107.5 |
102.5 |
104.4 |
99.7 |
97.0 |
105.3 |
94.9 |
* Valued in US Dollar |
Table 1: Monthly Seasonal Factors of Selected Economic Time Series (April - March) (Concld.) |
|
Year |
Dec |
Jan |
Feb |
Mar |
Peak Month |
Peak Value |
Trough Month |
Trough Value |
1 |
10 |
11 |
12 |
13 |
14 |
15 |
16 |
17 |
E.2 Revenue on Railway Freight Traffic |
| |
2011-12 |
105.0 |
105.7 |
99.1 |
114.4 |
Mar |
114.4 |
Sep |
92.5 |
Average |
104.5 |
105.7 |
98.9 |
114.0 |
Mar |
114.0 |
Sep |
93.0 |
2012-13 |
105.1 |
105.7 |
99.1 |
114.3 |
Mar |
114.3 |
Sep |
92.4 |
E.3 Sales of Commercial Motor Vehicles |
| |
2011-12 |
102.2 |
103.4 |
108.2 |
126.9 |
Mar |
126.9 |
Apr |
86.9 |
Average |
101.1 |
106.4 |
108.1 |
131.6 |
Mar |
131.6 |
Apr |
80.1 |
2012-13 |
102.8 |
103.4 |
107.9 |
126.8 |
Mar |
126.8 |
Apr |
87.2 |
E.4 Sales of Passenger Vehicles |
| |
2011-12 |
88.2 |
106.5 |
107.9 |
116.7 |
Mar |
116.7 |
Dec |
88.2 |
Average |
87.2 |
106.9 |
103.2 |
121.2 |
Mar |
121.2 |
Dec |
87.2 |
2012-13 |
88.6 |
107.0 |
108.1 |
116.6 |
Mar |
116.6 |
Dec |
88.6 |
E.5 Passenger flown (Km) - Domestic |
| |
2011-12 |
108.8 |
102.6 |
94.8 |
94.6 |
May |
113.2 |
Sep |
88.3 |
Average |
109.9 |
104.5 |
96.1 |
95.2 |
May |
111.0 |
Sep |
89.6 |
2012-13 |
109.0 |
102.5 |
94.7 |
94.6 |
May |
112.9 |
Sep |
88.2 |
E.6 Passenger flown (Km) - International |
| |
2011-12 |
102.1 |
93.4 |
91.7 |
100.4 |
Oct |
110.8 |
Feb |
91.7 |
Average |
103.4 |
94.6 |
92.1 |
103.5 |
Oct |
108.1 |
Feb |
92.1 |
2012-13 |
102.2 |
93.1 |
92.0 |
100.6 |
Oct |
110.5 |
Feb |
92.0 |
E.7 Freight Tonne Km flown - Domestic |
| |
2011-12 |
103.0 |
105.5 |
90.3 |
98.0 |
Jul |
110.8 |
Feb |
90.3 |
Average |
105.8 |
108.7 |
92.7 |
98.3 |
Jul |
108.8 |
Oct |
92.0 |
2012-13 |
102.7 |
105.2 |
90.4 |
98.0 |
Jul |
110.9 |
Feb |
90.4 |
E.8 Freight Tonne Km flown - International |
| |
2011-12 |
95.4 |
90.8 |
93.2 |
115.7 |
Mar |
115.7 |
Jan |
90.8 |
Average |
97.5 |
88.7 |
91.9 |
115.4 |
Mar |
115.4 |
Jan |
88.7 |
2012-13 |
95.8 |
91.7 |
93.3 |
115.3 |
Mar |
115.3 |
Nov |
91.5 |
F.1 Exports* |
| |
2011-12 |
100.7 |
97.4 |
95.6 |
114.9 |
Mar |
114.9 |
Nov |
88.9 |
Average |
99.3 |
100.4 |
96.0 |
116.4 |
Mar |
116.4 |
Nov |
91.0 |
2012-13 |
100.7 |
97.3 |
95.7 |
115.4 |
Mar |
115.4 |
Nov |
89.1 |
F.2 Imports* |
| |
2011-12 |
96.6 |
97.1 |
92.5 |
97.8 |
May |
107.4 |
Feb |
92.5 |
Average |
96.6 |
97.7 |
89.1 |
100.1 |
May |
107.4 |
Feb |
89.1 |
2012-13 |
96.8 |
97.9 |
93.5 |
98.0 |
May |
107.5 |
Feb |
93.5 |
* Valued in US Dollar
Note: 1. Average Figures relate to the reference period 2002-03 to 2011-12
2. Figures for 2012-13 are the forecasts of seasonal factors |
Table 2: Range (Difference Between Peak and Trough) of Seasonal Factors |
Year |
2002-03 |
2003-04 |
2004-05 |
2005-06 |
2006-07 |
2007-08 |
2008-09 |
2009-10 |
2010-11 |
2011-12 |
Average Range |
1 |
2 |
3 |
4 |
5 |
6 |
7 |
8 |
9 |
10 |
11 |
A.1.1 Broad Money (M3) |
2.3 |
2.6 |
2.9 |
3.1 |
3.2 |
3.1 |
2.8 |
2.4 |
2.1 |
2.0 |
2.7 |
A.1.1.1 Net Bank Credit to Government |
4.0 |
4.1 |
4.3 |
4.8 |
5.2 |
5.4 |
5.4 |
5.1 |
4.8 |
4.6 |
4.8 |
A.1.1.2 Bank Credit to Commercial Sector |
3.4 |
3.5 |
3.7 |
4.0 |
4.2 |
4.2 |
4.2 |
4.1 |
4.0 |
3.9 |
3.9 |
A.1.2 Narrow Money (M1) |
5.6 |
5.5 |
5.6 |
5.9 |
6.3 |
6.4 |
6.2 |
5.8 |
5.5 |
5.2 |
5.8 |
A.1.2.1 Currency with the Public |
7.3 |
7.0 |
6.9 |
6.9 |
6.9 |
6.8 |
6.7 |
6.5 |
6.3 |
6.1 |
6.7 |
A.1.3 Reserve Money (RM) |
6.6 |
7.1 |
7.5 |
7.5 |
7.0 |
6.4 |
6.6 |
6.8 |
6.9 |
6.9 |
6.9 |
A.1.3.1 Currency in Circulation |
7.4 |
7.2 |
7.0 |
6.9 |
6.9 |
6.8 |
6.6 |
6.4 |
6.1 |
5.9 |
6.7 |
A.1.3.1.1 Notes in Circulation |
7.6 |
7.3 |
7.2 |
7.1 |
7.0 |
6.9 |
6.7 |
6.5 |
6.2 |
6.1 |
6.8 |
A.2.1 Deposits (Banking Department) |
12.5 |
13.4 |
14.4 |
14.8 |
13.8 |
13.2 |
13.0 |
13.5 |
13.7 |
14.3 |
13.7 |
A.2.2 Liabilities to the Banking System (SCBs) |
7.4 |
8.4 |
10.3 |
11.1 |
12.0 |
11.8 |
11.9 |
11.6 |
11.6 |
11.7 |
10.8 |
A.2.3 Aggregate Deposits (SCBs) |
2.1 |
2.4 |
2.7 |
3.0 |
3.1 |
3.0 |
2.9 |
2.6 |
2.4 |
2.2 |
2.6 |
A.2.3.1 Demand Deposits (SCBs) |
10.0 |
11.8 |
13.3 |
14.0 |
14.7 |
14.9 |
15.0 |
14.7 |
14.4 |
14.2 |
13.7 |
A.2.3.2 Time Deposits (SCBs) |
1.8 |
1.7 |
1.7 |
1.7 |
1.7 |
1.7 |
1.7 |
1.7 |
1.6 |
1.7 |
1.7 |
A.3.1 Cash in Hand and Balances with RBI (SCBs) |
15.3 |
15.4 |
14.0 |
13.8 |
12.8 |
11.4 |
10.2 |
8.3 |
6.7 |
6.2 |
11.4 |
A.3.2 Assets with the Banking System (SCBs) |
10.9 |
11.7 |
13.1 |
14.2 |
16.1 |
17.7 |
18.5 |
19.2 |
20.3 |
21.2 |
16.3 |
A.3.3 Bank Credit (SCBs) |
3.4 |
3.5 |
3.6 |
3.7 |
3.9 |
4.0 |
4.1 |
4.1 |
4.2 |
4.3 |
3.9 |
A.3.3.1 Loans, Cash, Credits and Overdrafts (SCBs) |
2.9 |
3.0 |
3.3 |
3.6 |
4.0 |
4.3 |
4.4 |
4.4 |
4.4 |
4.4 |
3.9 |
A.3.3.2 Food Credit (SCBs) |
15.8 |
15.8 |
16.3 |
17.0 |
17.7 |
18.3 |
19.2 |
20.7 |
22.0 |
22.7 |
18.6 |
A.3.3.3 Non-Food Credit (SCBs) |
3.7 |
3.4 |
3.3 |
3.5 |
3.8 |
4.2 |
4.5 |
4.6 |
4.5 |
4.6 |
4.0 |
A.3.4 Investments (SCBs) |
3.5 |
3.5 |
3.4 |
3.6 |
3.8 |
4.1 |
4.4 |
4.6 |
4.7 |
4.7 |
4.0 |
B. WPI (base: 2004-05=100) |
1.1 |
1.1 |
1.3 |
1.3 |
1.4 |
1.5 |
1.4 |
1.3 |
1.1 |
1.1 |
1.3 |
All Commodities |
|
|
|
|
|
|
|
|
|
|
|
B.1 WPI - Primary Articles |
3.3 |
3.6 |
3.9 |
4.1 |
4.2 |
4.2 |
3.8 |
3.5 |
3.2 |
2.9 |
3.7 |
B.1.1 WPI - Food Articles |
4.1 |
4.6 |
5.1 |
5.6 |
5.9 |
6.0 |
6.1 |
6.1 |
6.1 |
6.1 |
5.6 |
B.1.1.1 WPI - Food Grains (Cereals+Pulses) |
1.5 |
1.4 |
1.5 |
1.8 |
2.1 |
2.3 |
2.3 |
2.0 |
1.7 |
1.4 |
1.8 |
B.1.1.1.1 WPI - Cereals |
1.1 |
1.4 |
1.8 |
1.8 |
1.8 |
1.8 |
1.8 |
1.7 |
1.5 |
1.3 |
1.6 |
B.1.1.1.1.1 WPI - Wheat |
5.1 |
5.4 |
5.6 |
5.7 |
5.6 |
5.1 |
4.7 |
4.3 |
4.3 |
2.1 |
4.8 |
B.1.1.1.1.2 WPI - Rice |
2.9 |
2.4 |
2.0 |
1.7 |
1.4 |
1.3 |
1.4 |
1.7 |
2.0 |
2.1 |
1.9 |
B.1.1.1.2 WPI - Pulses |
5.4 |
5.2 |
5.6 |
5.8 |
5.9 |
5.7 |
5.1 |
4.7 |
4.3 |
3.9 |
5.2 |
B.1.1.2 WPI - Fruits & Vegetables |
18.6 |
18.9 |
19.1 |
19.4 |
19.0 |
18.2 |
17.5 |
17.5 |
17.6 |
17.5 |
18.3 |
B.1.1.2.1 WPI - Potatoes |
48.7 |
49.3 |
49.9 |
51.1 |
51.8 |
53.3 |
53.5 |
53.4 |
52.8 |
52.3 |
51.6 |
B.1.1.2.2 WPI - Onions |
48.6 |
45.6 |
43.6 |
43.4 |
44.5 |
45.7 |
49.4 |
52.3 |
54.8 |
55.6 |
48.3 |
B.1.1.3 WPI - Milk |
1.7 |
1.3 |
1.2 |
1.0 |
0.7 |
0.5 |
0.4 |
0.7 |
0.9 |
1.2 |
0.9 |
B.1.1.4 WPI - Egg, Meat and Fish |
5.3 |
5.1 |
5.2 |
5.1 |
4.6 |
3.9 |
3.1 |
2.6 |
2.7 |
3.1 |
4.1 |
Table 2: Range (Difference Between Peak and Trough) of Seasonal Factors (Contd.) |
Year |
2002-03 |
2003-04 |
2004-05 |
2005-06 |
2006-07 |
2007-08 |
2008-09 |
2009-10 |
2010-11 |
2011-12 |
Average Range |
1 |
2 |
3 |
4 |
5 |
6 |
7 |
8 |
9 |
10 |
11 |
B.1.1.4.1 WPI - Egg |
16.2 |
15.4 |
13.9 |
12.3 |
10.6 |
9.1 |
8.1 |
7.9 |
8.9 |
9.4 |
11.2 |
B.1.1.4.2 WPI - Meat |
5.0 |
5.4 |
5.2 |
4.7 |
3.8 |
2.9 |
2.0 |
1.6 |
1.8 |
1.9 |
3.4 |
B.1.1.4.3 WPI - Fish |
8.1 |
7.1 |
7.0 |
7.3 |
6.8 |
5.5 |
5.2 |
4.9 |
5.6 |
6.2 |
6.4 |
B.1.1.5 WPI - Protein Items (viz., Pulses, Milk, Egg, Meat and Fish) Group |
1.8 |
1.8 |
1.8 |
1.9 |
1.9 |
1.9 |
2.0 |
2.1 |
2.3 |
2.5 |
2.0 |
B.1.2 WPI - Non-Food Articles |
2.5 |
2.2 |
2.0 |
2.2 |
2.5 |
2.6 |
2.4 |
3.5 |
4.2 |
4.6 |
2.9 |
B.1.2.1 WPI - Fibres |
4.4 |
4.1 |
3.9 |
4.2 |
4.7 |
4.4 |
3.3 |
2.5 |
2.0 |
2.3 |
3.6 |
B.1.2.1.1 WPI - Raw Cotton |
5.7 |
5.7 |
6.0 |
7.0 |
7.6 |
7.1 |
5.2 |
3.9 |
3.2 |
2.8 |
5.4 |
B.1.2.2 WPI - Oil Seeds |
4.5 |
4.0 |
3.5 |
3.2 |
3.2 |
3.4 |
3.9 |
4.2 |
4.4 |
4.4 |
3.9 |
B.2 WPI - Manufactured Products |
0.6 |
0.8 |
1.1 |
1.3 |
1.4 |
1.4 |
1.4 |
1.3 |
1.2 |
1.2 |
1.2 |
B.2.1 WPI - Food Products |
2.0 |
2.1 |
1.9 |
1.6 |
1.2 |
1.0 |
0.9 |
1.1 |
1.3 |
1.4 |
1.5 |
B.2.1.1 WPI - Grain Mill Products |
6.0 |
5.5 |
4.9 |
4.3 |
3.7 |
3.3 |
3.1 |
3.0 |
3.0 |
3.0 |
4.0 |
B.2.1.2 WPI - Sugar |
2.6 |
2.4 |
2.0 |
1.6 |
1.5 |
1.6 |
1.8 |
2.0 |
2.3 |
2.6 |
2.1 |
B.2.1.3 WPI - Edible Oils |
3.0 |
2.6 |
2.2 |
2.1 |
2.1 |
2.0 |
1.9 |
1.8 |
1.6 |
1.5 |
2.1 |
B.3 WPI - Freely Priced Petroleum Products (ex-Petrol Group) |
|
|
6.0 |
5.8 |
5.4 |
4.8 |
4.3 |
3.4 |
3.5 |
4.2 |
4.7 |
B.4 WPI - Non Food Manufactured Products |
0.4 |
0.5 |
0.8 |
0.9 |
1.1 |
1.2 |
1.2 |
1.2 |
1.2 |
1.2 |
1.0 |
B.5 WPI - Non Food Non-Fuel |
0.8 |
0.9 |
1.2 |
1.5 |
1.6 |
1.8 |
1.9 |
1.9 |
2.0 |
2.1 |
1.6 |
C.1 Consumer Price Index for Industrial Workers(base: 2001=100) |
1.6 |
1.6 |
1.7 |
1.8 |
1.9 |
2.0 |
1.9 |
1.9 |
1.9 |
2.0 |
1.8 |
C.2 Consumer Price Index for Agricultural Labourers (base: 1986-87=100) |
2.1 |
2.0 |
2.0 |
2.1 |
2.2 |
2.2 |
2.2 |
2.2 |
2.2 |
2.2 |
2.2 |
C.3 Consumer Price Index for Rural Labourers(base: 1986-87=100) |
2.0 |
1.9 |
1.9 |
2.0 |
2.1 |
2.1 |
2.2 |
2.1 |
2.1 |
2.1 |
2.1 |
D. IIP (base: 2004-05 = 100) General Index |
12.4 |
12.7 |
13.5 |
14.0 |
14.1 |
13.8 |
13.9 |
13.9 |
13.9 |
14.0 |
13.6 |
D.1.1 IIP - Basic Goods Industries |
10.2 |
10.6 |
11.5 |
12.4 |
13.2 |
13.8 |
14.4 |
14.7 |
15.0 |
15.1 |
13.1 |
D.1.2 IIP - Capital Goods Industries |
30.2 |
33.2 |
35.8 |
36.8 |
36.8 |
35.8 |
34.3 |
32.9 |
34.2 |
35.3 |
34.5 |
D.1.3 IIP - Intermediate Goods Industries |
7.0 |
8.0 |
9.0 |
9.7 |
10.1 |
10.1 |
9.6 |
8.9 |
8.3 |
8.0 |
8.9 |
D.1.4 IIP - Consumer Goods Industries |
20.0 |
19.3 |
17.9 |
16.1 |
15.3 |
14.7 |
14.6 |
14.8 |
14.9 |
15.2 |
16.3 |
D.1.4.1 IIP - Consumer Durable Goods Industries |
12.6 |
12.6 |
12.4 |
13.1 |
12.8 |
11.8 |
9.4 |
9.5 |
11.0 |
12.2 |
11.7 |
D.1.4.2 IIP - Consumer Non- Durable Goods Industries |
25.5 |
24.3 |
23.0 |
22.6 |
23.2 |
23.9 |
24.9 |
25.5 |
26.2 |
26.3 |
24.5 |
Table 2: Range (Difference Between Peak and Trough) of Seasonal Factors (Contd.) |
Year |
2002-03 |
2003-04 |
2004-05 |
2005-06 |
2006-07 |
2007-08 |
2008-09 |
2009-10 |
2010-11 |
2011-12 |
Average Range |
1 |
2 |
3 |
4 |
5 |
6 |
7 |
8 |
9 |
10 |
11 |
D.2.1 IIP - Mining |
17.9 |
19.2 |
20.8 |
22.2 |
23.3 |
24.3 |
24.8 |
25.1 |
25.2 |
25.4 |
22.8 |
D.2.2 IIP - Manufacturing |
12.6 |
13.1 |
14.2 |
14.7 |
14.8 |
14.3 |
13.5 |
13.3 |
13.4 |
13.5 |
13.7 |
D.2.2.1 IIP - Food products and beverages |
|
|
|
67.9 |
67.6 |
66.4 |
65.1 |
64.0 |
63.3 |
62.5 |
65.3 |
D.2.2.2 IIP - Textiles |
|
|
|
8.0 |
7.8 |
7.5 |
7.2 |
6.7 |
6.3 |
6.1 |
7.1 |
D.2.2.3 IIP - Wearing apparel; dressing and dyeing of fur |
|
|
|
26.9 |
26.1 |
25.7 |
25.3 |
26.2 |
28.0 |
29.4 |
26.8 |
D.2.2.4 IIP - Wood and products of wood & cork except furniture; articles of straw & plating materials |
|
|
|
22.5 |
22.0 |
20.9 |
19.7 |
18.9 |
18.7 |
18.8 |
20.2 |
D.2.2.5 IIP - Paper and paper products |
|
|
|
10.9 |
11.0 |
10.9 |
10.6 |
10.2 |
9.9 |
9.7 |
10.5 |
D.2.2.6 IIP - Publishing, printing & reproduction of recorded media |
|
|
|
9.5 |
9.6 |
9.7 |
9.9 |
10.0 |
10.2 |
10.2 |
9.9 |
D.2.2.7 IIP - Coke, refined petroleum products & nuclear fuel |
|
|
|
11.3 |
10.8 |
10.3 |
9.9 |
9.9 |
9.1 |
8.9 |
10.0 |
D.2.2.8 IIP - Chemicals and chemical products |
|
|
|
10.1 |
10.4 |
10.8 |
11.0 |
10.8 |
10.3 |
9.7 |
10.5 |
D.2.2.9 IIP - Rubber and plastics products |
|
|
|
8.6 |
9.1 |
9.4 |
9.8 |
9.9 |
10.6 |
11.0 |
9.8 |
D.2.2.10 IIP - Other non-metallic mineral products |
|
|
|
16.3 |
16.4 |
16.6 |
17.0 |
17.2 |
17.6 |
17.7 |
17.0 |
D.2.2.11 IIP - Basic metals |
|
|
|
11.3 |
11.3 |
11.3 |
11.0 |
10.8 |
10.8 |
11.3 |
11.1 |
D.2.2.12 IIP - Fabricated metal products, except machinery & equipment |
|
|
|
40.8 |
42.2 |
44.7 |
48.0 |
51.7 |
54.4 |
56.2 |
48.3 |
D.2.2.13 IIP - Machinery and equipment n.e.c. |
|
|
|
44.9 |
45.2 |
46.5 |
48.2 |
50.2 |
51.4 |
52.1 |
48.3 |
D.2.2.14 IIP - Office, accounting and computing machinery |
|
|
|
70.2 |
71.7 |
74.5 |
78.8 |
82.2 |
84.3 |
84.3 |
78.0 |
D.2.2.15 IIP - Radio, TV and communication equipment & apparatus |
|
|
|
17.8 |
16.8 |
15.9 |
15.3 |
14.7 |
15.8 |
17.1 |
16.2 |
D.2.2.16 IIP - Medical, precision and optical instruments, watches and clocks |
|
|
|
44.5 |
44.4 |
44.5 |
44.2 |
44.9 |
45.2 |
45.9 |
44.8 |
D.2.2.17 IIP - Motor vehicles, trailers & semi-trailers |
|
|
|
26.2 |
26.1 |
26.2 |
26.3 |
26.2 |
25.8 |
25.3 |
26.0 |
D.2.2.18 IIP - Other transport equipment |
|
|
|
20.7 |
20.4 |
19.9 |
19.2 |
18.6 |
19.2 |
19.6 |
19.7 |
D.2.3 IIP - Electricity |
11.4 |
11.1 |
10.4 |
10.0 |
10.0 |
10.5 |
10.8 |
11.3 |
11.5 |
11.5 |
10.8 |
D.3 Cement Production |
24.4 |
22.9 |
21.7 |
21.2 |
21.1 |
21.3 |
22.0 |
22.7 |
23.5 |
24.0 |
22.5 |
D.4 Steel Production |
12.2 |
12.5 |
12.5 |
12.1 |
11.6 |
10.5 |
9.7 |
9.4 |
9.1 |
9.2 |
10.9 |
Table 2: Range (Difference Between Peak and Trough) of Seasonal Factors (Concld.) |
Year |
2002-03 |
2003-04 |
2004-05 |
2005-06 |
2006-07 |
2007-08 |
2008-09 |
2009-10 |
2010-11 |
2011-12 |
Average Range |
1 |
2 |
3 |
4 |
5 |
6 |
7 |
8 |
9 |
10 |
11 |
D.5 Coal Production |
35.0 |
36.4 |
39.2 |
42.7 |
46.7 |
49.5 |
51.3 |
53.5 |
55.5 |
57.0 |
46.7 |
D.6 Crude Oil Production |
10.0 |
10.3 |
10.1 |
10.1 |
10.0 |
10.0 |
9.9 |
10.0 |
10.1 |
10.1 |
10.0 |
D.7 Petroleum Refinery Production |
9.5 |
9.7 |
9.5 |
9.2 |
8.8 |
8.6 |
8.1 |
8.3 |
9.1 |
10.0 |
9.1 |
D.8 Fertiliser Production |
|
|
28.5 |
28.5 |
28.4 |
28.0 |
27.3 |
26.4 |
25.6 |
24.9 |
27.2 |
D.9 Natural Gas Production |
|
|
10.8 |
11.1 |
11.5 |
11.6 |
11.1 |
10.4 |
10.0 |
9.9 |
10.8 |
D.10 Production of Commercial Motor Vehicles |
47.3 |
42.3 |
36.8 |
33.2 |
30.1 |
28.4 |
27.4 |
27.3 |
26.9 |
26.1 |
32.6 |
D.11 Production of Passenger Vehicles |
30.0 |
31.6 |
32.5 |
32.2 |
31.2 |
29.4 |
26.8 |
24.6 |
23.7 |
24.4 |
28.6 |
E.1 Cargo handled at Major Ports |
15.3 |
17.1 |
18.1 |
18.4 |
18.3 |
17.9 |
17.6 |
17.4 |
17.4 |
17.3 |
17.5 |
E.2 Revenue on Railway Freight Traffic |
19.2 |
19.2 |
19.8 |
20.7 |
21.3 |
21.8 |
21.9 |
21.9 |
21.8 |
21.9 |
20.9 |
E.3 Sales of Commercial Motor Vehicles |
73.0 |
63.4 |
57.2 |
53.2 |
50.5 |
47.7 |
45.2 |
43.0 |
41.2 |
40.1 |
51.4 |
E.4 Sales of Passenger Vehicles |
46.9 |
43.4 |
39.3 |
35.0 |
32.9 |
31.7 |
30.8 |
29.8 |
29.3 |
28.5 |
34.8 |
E.5 Passenger flown (Km) - Domestic |
22.7 |
22.5 |
21.5 |
20.4 |
20.7 |
22.1 |
23.2 |
24.3 |
24.7 |
24.8 |
22.7 |
E.6 Passenger flown (Km) - International |
12.2 |
13.3 |
13.7 |
14.2 |
15.8 |
17.4 |
18.5 |
19.2 |
19.5 |
19.1 |
16.3 |
E.7 Freight Tonne Km flown - Domestic |
19.1 |
20.5 |
20.7 |
19.9 |
18.8 |
17.2 |
17.9 |
19.3 |
20.1 |
20.5 |
19.4 |
E.8 Freight Tonne Km flown - International |
23.9 |
26.7 |
27.5 |
27.7 |
27.9 |
28.5 |
27.7 |
26.8 |
25.7 |
24.9 |
26.7 |
F.1 Exports* |
25.5 |
26.8 |
27.1 |
26.0 |
24.6 |
23.8 |
24.2 |
24.8 |
25.5 |
26.0 |
25.4 |
F.2 Imports* |
15.6 |
16.7 |
18.2 |
19.4 |
20.9 |
21.4 |
20.7 |
18.8 |
16.9 |
14.9 |
18.4 |
* Valued in US Dollar |
|


