
Performance of Private Corporate Business Sector, 2013-14 - આરબીઆઈ - Reserve Bank of India


Performance of Private Corporate Business Sector, 2013-14
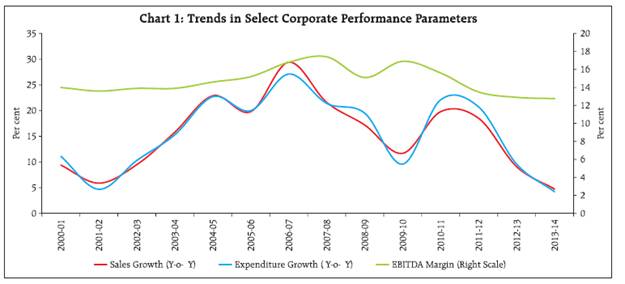
Sales growth of the private (non-financial) corporate business sector moderated for the third consecutive year during 2013-14 caused by decrease in the sales growth of manufacturing sector and the services sector (other than IT). IT sector has recovered in 2013-14 showing higher growth in sales and net profit after some moderation last year. Net profit of the manufacturing sector contracted in 2013-14 after recovering to some extent last year. The performance of small companies has further deteriorated as seen from the contraction of the sales, EBITDA and net profit in 2013-14. Percentage share of small companies in aggregate sales is small and steadily shrinking since 2007-08. This may be a cause of concern as small companies play an important role in industrial growth, innovation and employment generation. Small companies across all sectors (manufacturing, IT and non-IT service) have shown increase in their interest expenditure to sales ratios since 2007-08. Sales growth, however showed an improvement in the medium sized textile companies and for the pharmaceuticals industry, primarily driven by the large companies. EBITDA margins improved for the small sized construction companies. Quarterly results of 2,291 common companies showed an overall declining trend in sales growth during the previous eight quarters. However, it also showed increase in net profit growth in Q4:2013- 14 on a Y-o-Y basis. Limited results for Q1:2014-15 hinted an improvement in sales growth and profitability. The article analyses the performance of the private corporate business sector during 2013-14 based on the profit and loss statements of 2,854 listed non-government non-financial (NGNF) companies. Other important financial statements have also been referred, subject to availability. Besides analyzing the aggregate performance, the article provides a brief analysis by size and major industry groups. It also captures the evolving trend in sales, expenditure and profit margins of the corporate sector over a longer horizon. Detailed data has been made available in the Reserve Bank of India website. 1. Aggregate sales growth moderated and net profits contracted 1.1. Sales growth (Y-o-Y) of 2,854 companies of the private corporate sector continued to decelerate in 2013-14, for the third consecutive year. Sales growth this year was the lowest since 2000-01 (Chart 1). Though, the expenditure on various heads grew at lower rates in 2013-14 as compared to 2012-13, the earnings before interest, tax, depreciation and amortization (EBITDA) growth also moderated in 2013-14 (Table 1). The trends in various components of expenditure as a proportion to sales since 2007-08 till 2013-14 revealed that at the aggregate level, CRM (cost of raw materials) to sales recorded a steady increase till 2011-12 and then moderated to some extent in the last two years, while staff cost to sales ratios have increased in the recent two years after remaining stable for three consecutive years (2009-10 to 2011-12) (Table 6). EBITDA margin remained steady in 2012-13 and 2013-14, although significantly at a lower level than that in 2007-08 (Table 2).
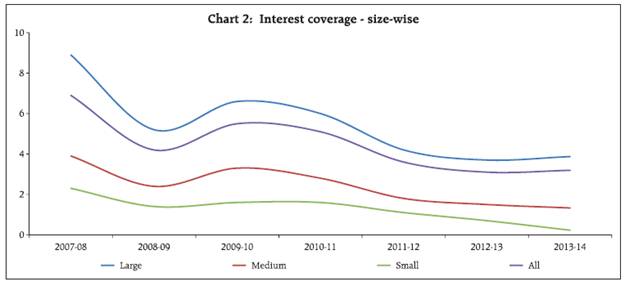
1.2. With ‘non-core’ income growth staying at similar level in 2013-14, as that of previous year, earnings before interest and tax (EBIT) growth slowed down. Net profit of listed NGNF companies contracted in 2013-14 for the third consecutive year. Consequently, net profit margin of the private corporate sector declined over the last three years. This is due to the moderation in expenditure growth during the period. 2. Performance of small companies further worsened 2.1. Size-wise comparison of private corporate sector showed that small companies (sales less than `1 billion) faced major setback in 2013-14. It reported sharp contraction in sales following a trend set since 2008-09. This impacted EBITDA growth heavily. Large companies (sales more than `10 billion) recorded higher EBITDA growth, while sales growth moderated. Medium companies (sales between `1 billion to `10 billion) also recorded lower sales growth and contraction in profits. For small and medium companies EBITDA and net profit margins have been declining since 2009-10. Large companies showed both margins at last year’s level. Interest coverage ratio (EBIT/Interest Expenses) showed a steady decrease since 2007-08 across all sizes. Small companies are struggling to service their debt as evident from alarmingly low interest coverage ratio in 2013-14 (Chart 2). 2.2. Sales of small companies have remained low as a percentage of aggregate sales of the listed non-financial private companies. Even that share has declined further over the years to stand at a meagre 1.3 per cent in 2013-14 (Table 3). However, they still continue to be the largest group in terms of numbers. The number and share of sales of large companies have improved over time, and has accordingly dominated the aggregate sales growth. Only large sized companies have maintained positive net profit margins in the last two years, while the small and medium sized companies are into losses. Declining fortune of the small companies is a matter of concern as they have important role to play in economic growth and in employment generation. 3. IT sector showed improvement 3.1. Manufacturing sector have shown moderation in the sales growth. Services sector (other than IT) recorded its lowest sales growth in last seven years. On the other hand, IT sector has shown overall improved performance in 2013-14, recording increase in sales and EBITDA growth. It also, recorded a sizeable increase in net profit growth in 2013-14 (Table 5). EBITDA margins declined for the manufacturing and the non-IT services sectors. However, like small companies across the sectors, the small IT companies recorded contracting sales. Furthermore, small IT companies witnessed losses at the operating level itself (EBITDA negative).
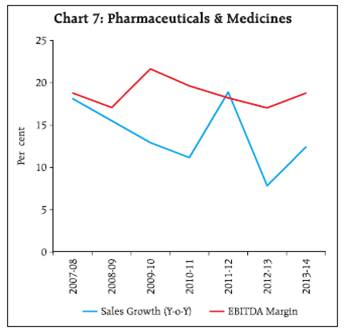
3.2. During 2013-14, CRM to sales ratio declined for the manufacturing sector as a whole, while staff costs increased. For services sectors (IT and non-IT), CRM to sales ratio declined over a period of time whereas staff cost to sales has steadily increased. Across the sectors and size groups it is observed that staff cost to sales ratio is higher for small companies (Table 6). This hints at the importance of labour as a factor of production amongst the small companies. Staff cost to sales ratio is also high for IT companies irrespective of size. At the aggregate level, interest to sales ratio has increased from 2.3 per cent in 2007-08 to stand at 3.7 per cent in 2013-14, witnessing fluctuations in between. 4. Sales moderated across industries but smaller companies suffered more even in comparatively better performing industries 4.1. Most of the industries followed the general trend of lower sales growth and lower profit (EBITDA) margins in 2013-14 compared to 2012-13 except the pharmaceuticals industry.
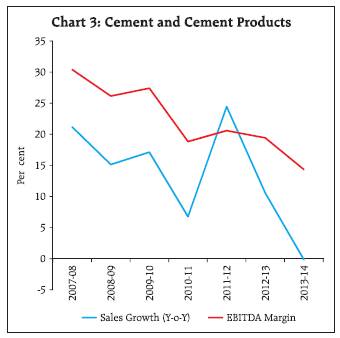
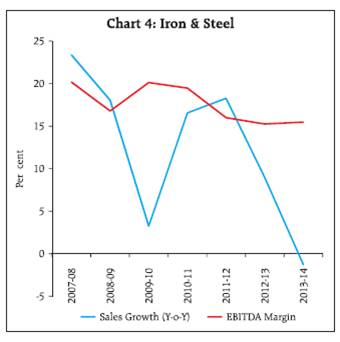
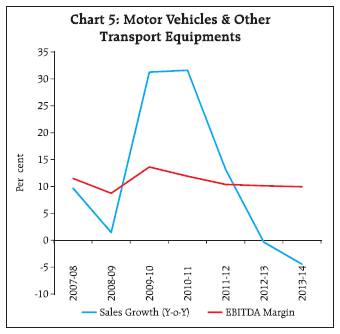
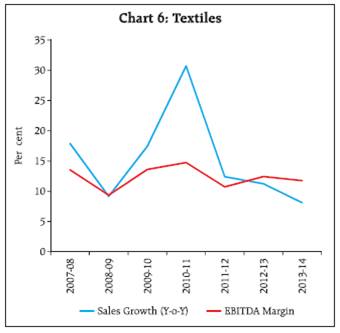
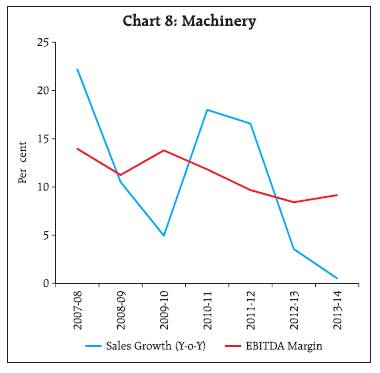
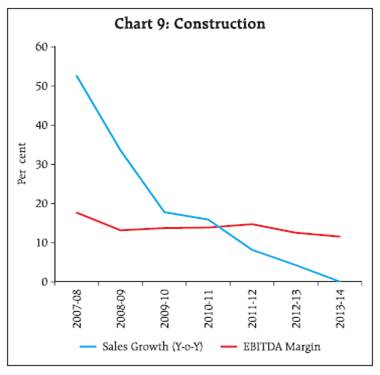
4.2. In the basic goods sector, sales growth of two major industries viz., cement and iron & steel declined sharply, taking them into contraction in 2013-14 to -0.1 and -1.3 respectively from a peak of 24.5 and 18.3 per cent respectively in 2011-12. EBITDA margins continued to decline for two consecutive years in both cement and iron & steel industries (Chart 3 & 4). Also, a size wise analysis indicates a pronounced difference in sales growth and profit margins of small and large size companies of both these industries (Table 7). While the small cement companies could still record positive profit margins, small companies in iron & steel industry suffered a very steep sales contraction, accompanied by losses at the operating (EBITDA) and net (Net Profit) levels in 2013-14. Based on the available cash flow statements, it is observed that, the iron & steel industry made higher amount of investments along with further additions to inventory in 2013-14. The cement industry, on the other hand showed lesser investments and also decrease in inventories in 2013-14. 4.3. In consumer goods sector, motor vehicles industry witnessed a huge decline in sales growth in 2011-12 which was followed by further contraction in sales in 2012-13 and 2013-14 (Chart 5). Textile industry also witnessed decline in sales growth for three consecutive years (Chart 6) with noticeable differences between the large and the small size companies (Table 7). Sales growth in pharmaceuticals and medicines industries (Chart 7) witnessed upward trend in 2013-14 at aggregate level and in respect of the large size companies only. Sales growth of the small and the medium size companies declined during the year 2013-14 (Table 7). Net profit margins in consumer goods sector showed a marginal improvement except in textiles industries. Small companies in textile industry suffered negative net profit margins successively for 2012-13 and 2013-14. Among major industries, the motor vehicles industry generated higher operating cash flows as compared to the corresponding operating profits (EBITDA) in 2013-14 due to lowering of inventory levels and higher trade payables. 4.4. In capital goods sector, which is considered a vehicle of growth, the two major industries viz., construction and machinery recorded three years of decelerating sales growth. A marginal growth in EBITDA and net profit margins was witnessed by machinery industry in the year 2013-14 (Chart 8 & 9 ). Construction industry has not yet come out of crisis since the year 2011-12 except that the small companies of this industry showed a recovery in EBITDA and net profit margins in the year 2013-14 in spite of sharp contraction in sales (Table 7). Investments declined steadily with rising inventory levels in the construction industry and cash flow from operations also was the lowest among all major industries, although it recovered to some extent in 2013-14. 5. On a quarterly basis, decline in sales growth remained unabated, profit margins steadied. 5.1. An analysis over the quarters, of the performance of a common sample of 2,291 listed private non-financial companies revealed a steady decline in sales growth till Q1: 2013-14, followed by an upward movement in Q2:2013-14. Subsequently, sales growth declined in Q3, remaining flat in Q4 (Table 8). EBITDA contracted in Q2:2013-14 after a marginal recovery in Q1:2013-14 following a successive decline in growth rates for three consecutive quarters. The situation improved in Q3, followed again by a decline in Q4. 5.2. Growth rates in interest expenses declined gradually until it showed an upturn in Q2:2013-14. However, it declined once again in subsequent Q3 and then showed an increase in Q4. Other income exhibited a fluctuating pattern of rise and fall of varying magnitudes in alternate quarters. 5.3. Net profit contracted during Q4:2012-13 to Q2:2013-14, recovered to a positive growth of 9.9 per cent in Q3:2013-14 and improved to 19.5 per cent in Q4. Lesser tax provisions in Q4 helped to improve net profit growth further in Q4, despite lower growth rates of EBITDA (operating profits) and EBIT (gross profits). Interest coverage ratio has improved during the recent quarters. EBITDA margins in Q4:2013-14 remained at a level similar to that in Q1:2012-13, with range-bound fluctuations during the eight quarter period. Net profit margins have shown improvement during the last two quarters. 5.4. Limited results available so far for Q1:2014-15 (April-June 2014) indicated an improvement in sales growth, with higher EBITDA and net profits and better profitability. Annex Explanatory Notes 1. To compute the growth rates in any period, a common set of companies for the current and previous period is considered. 2. The classification of industries and sectors broadly follows the National Industrial Classification (NIC). 3. The manufacturing sector consists of industries like Iron & Steel, Cement & Cement products, Machinery & Machine Tools, Motor Vehicles, Rubber, Paper, Food products etc. This does not include ‘Tea Plantations’ and ‘Mining & Quarrying’ industries. The services (other than IT) sector includes Real Estate, Wholesale & Retail Trade, Hotel & Restaurants, Transport, Storage and Communication industries. This does not include Construction and Electricity Generation & Supply Industries. 4. FOREX gain and loss are reported on net basis by companies and included in the net profit calculation. While net FOREX loss is considered as a part of the expenditure and thus included in EBITDA, net FOREX gain is considered as a part of other income and included in EBIT. 5. Other income includes various regular incomes like rents, dividends, royalties etc. and does not include extra-ordinary income/expenses. 6. Extra-ordinary income/expenses are included in EBT and net profit. As the name suggests, these income/ expenses can be very large for some of the companies in a particular quarter. 7. Some companies report interest on net basis. However, some companies include the interest expenses on gross basis, where, interest received is reported in other income. 8. The ratio / growth rate for which denominator is negative or negligible is not calculated, and is indicated as ‘$’.
* Prepared in the Corporate Studies Division of the Department of Statistics and Information Management, Reserve Bank of India, Mumbai. The previous study ‘Performance of Private Corporate Business Sector, 2012-13’ was published in the October 2013 issue of the RBI Bulletin. |
||||||||||||||||||||||||||||||||||||||||||||||||||||||||||||||||||||||||||||||||||||||||||||||||||||||||||||||||||||||||||||||||||||||||||||||||||||||||||||||||||||||||||||||||||||||||||||||||||||||||||||||||||||||||||||||||||||||||||||||||||||||||||||||||||||||||||||||||||||||||||||||||||||||||||||||||||||||||||||||||||||||||||||||||||||||||||||||||||||||||||||||||||||||||||||||||||||||||||||||||||||||||||||||||||||||||||||||||||||||||||||||||||||||||||||||||||||||||||||||||

આ પેજ શેર કરો:


રિઝર્વ બેંક ઑફ ઇન્ડિયા મોબાઇલ એપ્લિકેશન ઇન્સ્ટૉલ કરો અને લેટેસ્ટ ન્યૂઝનો ઝડપી ઍક્સેસ મેળવો!


