REPORT OF THE
TECHNICAL ADVISORY GROUP ON DEVELOPMENT OF HOUSING START-UP INDEX IN INDIA |
 |
| |
| |
| |
Reserve Bank of India
Mumbai |
| |
January 2009 |
| |
| |
January 30, 2009 |
Dr. Rakesh Mohan Deputy
Governor Reserve Bank of
India Central Office
Mumbai-400001 |
| |
Dear Sir, |
| |
Sub: Report of the Technical Advisory Group on Development of Housing Start-Up Index in India |
| |
We are pleased to submit the Report of the Technical Advisory Group on Development of Housing Start-Up Index in India appointed vide the R.B.I, memorandum dated 31-07-2007 |
| |
 |
| |
| Foreword |
| |
Given the well-known lags in monetary policy transmission, it is critical that monetary policy actions are guided by the evolving macroeconomic outlook. Since actual data are often available with substantial lags, monetary authorities around the world supplement the information from actual data with forward-looking surveys. Like other central banks, in order to strengthen the analytical framework for the conduct of monetary policy, the Reserve Bank has, over the past few years, initiated a number of surveys to capture timely information on the major leading indicators of economic activity. These include, inter alia, ‘industrial outlook survey’, ‘survey of inventories, order books and capacity utilization’ and ‘inflation expectations survey for households’. These surveys have provided extremely timely and useful inputs in the conduct of monetary policy by the Reserve Bank.
In this context, housing activity is considered as amongst the important lead indicators of economic activity, given its strong and substantial forward and backward linkages with other sectors of the economy. In particular, information on trends in number of new houses being started can provide useful information on the likely pace of economic activity over a horizon that is of interest to the central bank. An increase in the number of houses getting started (measured through Housing Start-Up Index, HSUI) would be indicative of an increase in investment, business and consumer optimism and vice versa. Unlike many other countries, information on various indicators of housing activity is quite meager. Information on residential and commercial property prices is also of recent origin in our case and the same is available for only some select cities and for short periods. Given the limited available data in regard to housing indicators on the one hand and consistent with our recent efforts to expand database in regard to leading indicators on the other hand, it was considered desirable to develop a HSUI for India. Accordingly, the Reserve Bank of India constituted a “Technical Advisory Group (TAG) on Development of Housing Start Up Index in India” under the Chairmanship of Prof. Amitabh Kundu, JNU, New Delhi, to suggest a feasible methodological framework and institutional arrangement for construction of HSUI for the Indian economy. The TAG has done a really pioneering job as it started from scratch in our case. Its efforts in providing a coherent methodology and painstaking efforts to provide estimates of start-up coefficients through pilot surveys are highly commendable. I am sure that the methodology recommended by the TAG in its Report will help us in developing a reliable and timely House Start-up Index in a meaningful manner and further enrich our conduct of monetary policy. I place on record my appreciation to the TAG members and the various Government organization and authorities for their keen interest, enthusiasm and participation in the deliberations and finalisation of the Report. I would also like to acknowledge the contribution of the Reserve Bank’s officials from the Department of Statistics and Information Management for providing secretarial support and shouldering the responsibility of analyzing the survey results and preparation of the Report. Finally, I would like to place on record my deep appreciation of the professional skill and utmost dedication of Prof. Amitabh Kundu, Chairman, TAG, who led the group effectively for completing this significant task. Without his continuous leadership, involvement and commitment, it would not have been possible to bring out this Report. Rakesh Mohan
Deputy Governor May 29, 2009 |
| Preface |
| |
Housing start is considered to be a lead indicator in many developed and developing economies because of the strong forward and backward linkages it has with various sectors. The number of housing starts during a given period reflects the institutional response in a country to the current demand and supply situation in the market, as reflected though operationalisation of the existing building permits into actual starts. This has an impact not only on the construction activities but also on several consumer durables and investment goods sector of the economy. The decision to set up a Technical Advisory Group (TAG) by the Reserve Bank of India to consider bringing out Housing Start up Index (HSUI) on a regular basis is extremely timely. This is particularly so because the current meltdown of the economy at global level as also in many less developed countries have been linked partially to the ‘developments’ in the housing sector. Indeed, these have powerful multiplier effects on the economy, operating through the intersectoral linkages in the production system. It makes a significant impact on financial sectors as well, as has been realized with some amount of concern, in recent months. The members of the TAG consider construction of HSUI and its regular release to be an extremely important and challenging responsibility which has been long overdue. They plead for taking urgent measures to put into operation an institutional structure entrusted with the responsibility of bringing out HSUI, keeping in view the global practices as also the ground reality of India into consideration. This indeed, can become a powerful tool for monitoring the movements in several segments of the economy. The start up coefficients, computed from the data in recent past, reflect institutional and social response to housing permits, in terms of their conversion into actual housing starts. The time required for administrative and procedural clearances after the issuance of permits, to complete the formalities of obtaining loans, organizing materials, construction process etc. can be considered to be somewhat rigid or fixed in the short run. As housing is a long term decision, predictions based on these coefficients, that reflect procedural and social rigidities governing the house construction process, are likely to be fairly reliable. Understandably, the actual housing starts at any point of time are likely to be influenced by a host of other factors like price of building material, interest rates in general and that for housing loans, policy pronouncements, legislations, administrative orders affecting construction sector etc. To an extent, these would affect the demand and supply parameters in the housing market that, in turn, would determine the number of application for permits. The institutional response - in terms of the number of permits actually issued - would have some time lag. It is nonetheless clear that market based factors would get incorporated in the computation of the index through the key variable – the number of permits issued in recent past, say the last two years. The TAG believes that the HSUI can be used by housing related agencies as the basic or core predictor. These agencies can combine the values of this index with other short term indicators and policy variables to arrive at more detailed projections of housing activity, if they so desire. Let me put on record my gratitude for the keen interest and enthusiasm with which the TAG members have participated in the deliberations and finalisation of the Report. The analytical insights and meticulous care with which they have commented on the conceptual and methodological issues and examined technical aspects of data availability and reliability in the meetings as also through internet communication have been commendable. It is only because of the full cooperation of the members that the complex methodological issues as also those related to institutional grounding could be resolved and the Report submitted within a short time. The members of TAG would put on record sincere thanks to Dr. Rakesh Mohan, Deputy Governor, Reserve Bank of India for envisaging the need of this exercise and providing valuable insights and suggestions during the entire period of the Group’s functioning. Special thanks are for the Directorates of Economics and Statistics (DES), Tamil Nadu, Maharashtra and Delhi that conducted the pilot survey. Thanks are due to the core team comprising Mr. Sanjoy Bose, Director, Dr. A.K. Tripathi, Director, Ms. Sushila Augustine, Director and Mr. Joice John, Research Officer of Department of Statistics and Information Management, RBI for shouldering the total responsibility of analyzing the survey results and preparing the draft of the Report. My special words of appreciation for Ms. Sushila Augustine and Mr. Joice John who always responded to various queries and suggestions without any delay. Our gratitude is to Dr. Amal Kanti Ray, Officer-in-Charge, Department of Statistics and Information Management, RBI for creating an excellent environment and facilities in overseeing the pilot survey, coordinating the Group meetings and making extremely valuable suggestions. |
| |
| |
| January 30, 2009 |
|
Amitabh Kundu
|
| |
|
| |
|
|
|
| |
|
| |
|
| Abbreviations |
CMHC |
Canada Mortgage and Housing Corporation |
CSO |
Central Statistical Organisation |
DES |
Directorate of Economics and Statistics |
DSIM |
Department of Statistics and Information Management |
FSA |
Floor Space Area |
GR |
Growth Rate |
HIG |
High Income Group |
HSRM |
Housing Start Rate Matrix |
HSUI |
Housing Start Up Index |
HUDCO |
Housing and Urban Development Corporation |
LIG |
Low Income Group |
MHU |
Multiple Housing Unit |
MIG |
Middle Income Group |
NBO |
National Buildings Organisation |
NCAER |
National Council of Applied Economic Research |
NHB |
National Housing Bank |
NP |
Non-permit Survey |
NSSO |
National Sample Survey Organisation |
RBI |
Reserve Bank of India |
SBP |
Survey of Building Permits |
SHS |
Survey of Housing Starts |
SHU |
Single Housing Unit |
SOC |
Survey of Constructions |
SUP |
Survey of Use of Permits |
TAG |
Technical Advisory Group |
TN |
Tamil Nadu |
US |
United States |
|
| Section 1 |
INTRODUCTION |
| |
| 1.1 Genesis of the Technical Advisory Group |
| |
1.1.1 House is generally the most important asset of a household and accounts for a major share of its wealth. Any movements in the housing sector may, therefore, make a significant impact on economic activities in the country including on that of the financial sector. The former would have powerful multiplier effect on the economy operating through the intersectoral linkages in the production system. The number of housing starts during a given period reflects the institutional response to the existing number of building permits, besides the current demand for houses. This would have an impact on the outlook of the construction industry due to the backward linkages. Housing starts is considered to be a lead economic indicator because of the forward-linkages.
1.1.2 Given this perspective, it has been considered necessary to develop a Housing Start-up Index which can be used as a tool to monitor the movements in certain segments of the Indian economy on a regular basis. The index must be constructed through development of an appropriate methodology after overviewing the international best practices. Accordingly, the Reserve Bank of India has constituted a Technical Advisory Group for "Development of Housing Start-up Index" vide, Memorandum signed by Deputy Governor, Dr. Rakesh Mohan on July 30, 2007 (Annex 1).
1.1.3 The Terms of Reference of the Technical Advisory Group are as given below: |
| |
| (i) To review base paper on concepts, methodology, approach to generate the database for construction of the indices and suggest a feasible methodological framework for construction of HSUI for the Indian economy, with a view to assist monetary policy formulation, and to guide and oversee its implementation.
(ii) To recommend modalities of entrusting the work for construction of HSUI by appropriate external agency or institution, including scope of work and deliverables.
(iii) To evaluate the work of the external agency/institution and recommend its acceptance by the Bank.
(iv) Any other issue as deemed necessary for development of the HSUI. |
| |
| 1.1.4 The constitution of the Technical Advisory Group is as follows: |
| |
1. |
Prof. Amitabh Kundu
School of Social Sciences
Jawaharlal Nehru University
New Delhi. |
Chairman |
2. |
Dr. R. B. Barman
Ex-Executive Director
Reserve Bank of India,
Mumbai |
Vice-Chairman |
3. |
Dr. M. D. Patra
Monetary Policy Department
Reserve Bank of India
Mumbai |
Member |
4. |
Shri. S. Sridhar
Chairman & Managing Director
National Housing Bank
New Delhi |
Member |
5. |
Dr. S. K. Nath
Ex-Director General
Central Statistical Organization (CSO)
Ministry of Statistics and P.I
Government of India
New Delhi |
Member |
6. |
Shri. D. S. Negi
Director (NBO),
Ministry of Housing & Urban Poverty Alleviation
Government of India
New Delhi |
Member |
7. |
Shri. K.L Dhingra
Chief Managing Director
Housing and Urban Development Corporation (HUDCO)
New Delhi |
Member |
8. |
Shri. S. K. Sinha
Ex-Director General and CEO
National Sample Survey Organisation (NSSO)
Ministry of Statistics and P.I
Government of India
New Delhi |
Member |
9. |
Shri. D. R. Bhosale
Director, Directorate of Economics & Statistics,
Govt. of Maharashtra
Mumbai |
Member |
10. |
Smt. M. Sheela Priya
Sp.Commissioner and Director
Dept. of Economics & Statistics
Govt. of Tamil Nadu
Chennai |
Member |
11. |
Shri. K. K. Mondal
Director, Bureau of Applied Economics & Statistics
Govt. of West Bengal
Kolkata |
Member |
12. |
Dr. B. K. Sharma
Director and Chief Registrar (Births and Deaths)
Directorate of Economics & Statistics
Govt. of National Capital Territory of Delhi
New Delhi |
Member |
13. |
Chief General Manager (Personal Banking)
State Bank of India
Mumbai |
Member |
14. |
Dr. D. B. Gupta
National Council of Applied Economic Research
New Delhi |
Member |
15. |
Prof. Bharat Ramaswami
Planning Unit, Indian Statistical Institute
New Delhi |
Member |
16. |
Prof. Abhay Pethe
Professor of Urban Economics and Regional Development
Department of Economics, Mumbai University
Mumbai |
Member |
17 |
Dr. Amal Kanti Ray
Officer-in-Charge, DSIM
Reserve Bank of India, Mumbai |
Member Secretary |
|
| |
1.1.5. The Department of Statistics and Information Management (DSIM) (Statistical Analysis Division) provided the secretarial support to the Technical Advisory Group.
1.2 Report Outline
1.2.1 The Group deliberated on issues regarding the development of sound and reliable Housing Start-Up Index during its four meetings held in Mumbai. During the first two meetings, the issues concerning the scope, coverage, relevance and operationalisation of the index were discussed in some detail. The issues relating to the concept of housing start up, sources of data, data collection mechanism, periodicity of compilation, need for pilot survey etc. were also deliberated. The Group had the benefit of the presence and participation of the Deputy Governor Dr. Rakesh Mohan in its third meeting which finalized the methodology of the pilot survey and detailed out the procedures and institutioinalisation of the index building exercise. Decisions were taken also regarding the selection of the urban centres for the survey, sampling technique, survey questionnaires and the methodology of data analysis. The fourth and final meeting, where again Dr. Rakesh Mohan was present, discussed the empirical results of the surveys conducted in Coimbatore, Mumbai, Delhi, Delhi, Villupuram and Saswad. The Group felt there was a need for conducting a survey on the processes including the formal requirements for issuance of building permits by the various municipal bodies across the country. As suggested by the Group a meeting of the municipal commissioners and officers from town planning departments/urban development authorities from some selected cities with members of the Group was held at National Building Organisation, New Delhi to deliberate on the issues relating to the existing system of data collection on building permits and explore the possibility of setting up a mechanism for compilation and collation of the exiting data and collection of some additional data on the building permits. The study note on permit issuing processes across the country based on the information given by the municipal commissioners and officers from town planning departments/urban development authorities from some selected cities were circulated among the members. Based on the discussions and decisions in earlier meetings as also the analysis of the data gathered by NBO, the Group finalised the methodology for construction of the index on a regular basis and proposed an institutional structure that would be responsible for its operationalisation, as presented in this Report.
1.2.2 The Report is divided into five sections. Section 2 discusses international practices in constructing house construction related indices and the experiences of building related to data/information base for housing sector in India. Section 3 gives insight into the methodological issues for construction of HSUI, taking the empirical context of Indian urban scenario into consideration. Section 4 presents the pilot survey results and enumerates the limitations of the data used in this and similar empirical studies in the country. The recommendations of the Group are presented in Section 5.
1.3 Acknowledgements
1.3.1 Preparation of HSUI being the maiden venture of its kind, the challenges were many. The contribution by each of the members and their institutions were crucial in completing the projects in a meaningful manner and all of them must be sincerely thanked for their efforts. The Group expresses sincere thanks to Dr. Rakesh Mohan, Deputy Governor, Reserve Bank of India for his valuable insights and suggestions provided during the entire period of the Group’s functioning. The Group also thanks Dr P. K. Mohanty of the Ministry of Housing and Urban Poverty Alleviation, the Joint Secretary in charge of NBO, for providing information regarding the present system of data generation in the Ministry and assisting in formalizing a system of data compilation for HSUI on a regular basis. The Group is thankful to Shri. Radhey Shyam, former Adviser, DSIM, RBI, Shri. Sangeet Shukla, CGM, State Bank of India, Shri. T. Prabhakaran, former Director Finance, HUDCO and Shri. P.K Ray, former Director General and CEO (In charge), NSSO who were part of this Group in its initial phases. Special thanks are for the Directorates of Economics and Statistics (DES), Tamil Nadu, Maharashtra and Delhi that undertook the responsibility of conducting the pilot survey. The Group is thankful to Dr. M. Murughan and Shri S. Sudalaimuthu of DES – TN, Shri. K.S.P Rao, Ex-Deputy Director General, NSSO, Shri. Raj Pal, Principal Adviser, NHB, Smt. Uttara Dasgupta, GM, SBI Shri. K. L Paulson, DGM, SBI and Shri. Avanish Mishra, NBO for representing their organizations in various meetings and putting forward invaluable suggestions as also to Mr. Deepak Gahlowt was a special invitee in the third meeting to present his work on municipal housing permit system. The Group is also thankful to Shri. A.B Chakraborty, Adviser, Monetary Policy Department (MPD), RBI and Dr. O.P Mall, Director, MPD, RBI for their contributions.
1.3.2 The Group is thankful to Dr. Amal Kanti Ray, Officer-in-Charge, Department of Statistics and Information Management, RBI for creating an excellent environment and facilities in overseeing the pilot survey and coordinating the Group meetings. His continuous persuasion for completion of the Report is highly appreciated. The Group also recognizes to Shri. Sanjoy Bose, Director, Dr. A.K. Tripathi, Director, Smt. Sushila Augustine, Director and Shri Joice John, Research Officer of Department of Statistics and Information Management, RBI for shouldering the total responsibility of analyzing the survey results and preparing the Report.
1.3.3 The Group places on record the valuable contributions, encouraging thoughts and support for design of the survey schedules, conduct of pilot survey and firming up the methodology for compilation of Housing Start Up Index (HSUI) by ex-officio members, Dr. R. B. Barman, former Executive Director, RBI, Dr. S. K. Nath, former Director General, Central Statistical Organization (CSO) and Shri. S. K. Sinha, former Director General and CEO, National Sample Survey Organisation (NSSO).
Section 2
INTERNATIONAL PRACTICES AND DOMESTIC EXPERIENCES
2.1 Background
2.1.1 Housing Starts as a Lead indictor: Housing Start indices are considered to be lead economic indicators because these give an idea regarding the level of activities in a number of sectors of the economy in immediate future and in this sense it is forward-looking. A high level of housing activity can trigger economic growth, cause interest rates to rise and may have inflationary impact. Similarly, decline in housing activity could slow down the economy, cause yields and interest rates to fall, dampen investments in linked sectors and push the real economy into recession. The current meltdown of the economy is being linked to the crisis emanating from the housing sector. The developments in the latter have direct causal effect on the real economic activities as also the financial sector, which amplifies macroeconomic shocks. Furthermore, these can become autonomous sources of macroeconomic and financial fluctuations. Because of the high outlays needed to start construction projects, an increase in housing starts is often taken as an indication of commitment of related investment in other sectors. It reflects an enhancement of business and consumer optimism. The housing starts figures provide insight into the upcoming demand for consumer durables in near future, since new house constructions/purchases are typically followed by large expenditures on a wide range of consumer products. Conversely, an economy that is growing rapidly is noted as having a high demand for housing and large number of housing starts.
2.1.2 Ripple effect of housing demand: The housing sector has powerful multiplier effects across the commodity and service markets that impact on the overall growth performance of the economy. Changes in the rate of housing starts reflect demand for new dwelling units, impacting on the outlook for construction industry. As new house/building constructions get started, the demand for construction materials goes up. Further, employment in the construction activities rises immediately, causing a higher demand for a large number of consumption goods including durables, which eventually may cause the general price rise in the country. Once the houses are sold, these generate revenues in the hands of the house-builders and open a myriad of consumption opportunities for the buyer. Refrigerators, washing and drying machines, furniture, etc. are a few things that new house buyers would often spend their money on. The economic "ripple effect" in the Indian context has been noted to be substantial, especially when new houses are coming up at a rate higher than in the past. In a more specific sense, the housing starts data carry valuable clues for house-builders, producers and suppliers of construction materials, banks, lenders, and house furnishings companies, for their future decisions.
2.2 International Practices
2.2.1 Internationally, countries like Canada, United States, Japan, France, Australia, and New Zealand are compiling data related to building permits/housing starts on a regular basis. Most of these countries compile housing starts using housing permits data, collected either through census or sampling method. The practices followed in these countries are summarised below.
2.2.2 Statistics Canada publishes data on house permits on a monthly basis. The monthly Building Permits Survey of the Canadian municipalities collects data on the value of construction intentions in the non-residential sector; and the number of dwelling units authorized in the residential sector and their value. The Survey collects information also on the number of dwelling units demolished. It covers all the municipalities that issue permits. At present more than 2,350 Canadian municipalities, representing all provinces and territories are covered by the survey. Data sources and methodology are detailed in Annex-2.
2.2.3 Building permits data are widely used as a lead indicator for the construction industry in Canada; the issuance of a building permit is one of the first steps in the construction process. Statistics on building permits are essential for the computation of capital expenditures in building construction, depreciation by components and estimation of net capital stock on quarterly and annual basis. The results of this Survey are used by Canada Mortgage and Housing Corporation (CMHC) as a reference base for conducting a monthly survey of housing starts and completions. There are, thus, a wide range of users – from economists in public and private production sectors and development planners to construction industry analysts and housing market analysts in Canada.
2.2.4 The United States Census Bureau compiles and publishes data on 'New Residential Construction' on a monthly basis, based on sample survey. The purpose of the survey is to provide statistics on the construction of new privately owned residential structures in the country. The data relate to new housing units intended for occupancy and maintenance by the occupants. These include single-family unit as well as multiple-family unit buildings but exclude hotels, motels, and group residential structures such as nursing houses and college dormitories. Also excluded are the publicly owned housing and manufactured mobile housing units. Units in structures built by private developers with partial public subsidies are all classified as private housing and hence included in the database.
2.2.5 Statistics on housing units authorized by building permits include those that are issued under local permit-issuing jurisdictions by a building or zoning permit agency. Statistics are based upon reports submitted by local building permit officials in response to a mail survey. Approximately 9,000 of the 20,000 permit issuing places in the United States are surveyed monthly, the remaining being surveyed annually. Estimates of Housing Units Authorized, but Not Started; Housing Starts; Housing Units under Construction; and Housing Completions are obtained from the Survey of Construction (SOC). SOC comprises two parts: (i) Survey of Use of Permits (SUP) which estimates the number of new construction in areas that require a building permit and (ii) Non-permit Survey (NP) estimating the amount of new constructions in areas that do not require a building permit. Data from both parts of the SOC are collected by Census field representatives. For SUP, they visit a sample of permit offices and select a sample of permits issued for new housing. These permits are then followed through to record the date of their starting and completion. From these sample surveys, related housing statistics are estimated. The detailed methodology is presented in Annex-3.
2.2.6 The Japanese Ministry of Land, Infrastructure and Transport announces Japan's total housing starts every month under official statistics of Japan. The Housing Starts figure gives insight into consumer activity in Japan, since new home purchases typically require a large investment for consumers.
2.2.7 In France, the National Institute of Statistics and Economic Studies, Directorate-General of the Ministry of the Economy, Finance, and Industry, publishes the information on house starts on monthly basis. The rate of growth in housing construction is released as percentage change over the preceding year.
2.2.8 Australian Bureau of Statistics publishes dwelling starts on quarterly basis. The number, which is officially called Construction of Dwellings, measures growth in the construction sector and reflects the overall health of the housing market. The headline number is the percentage change in Dwelling Starts from the previous month's figure.
2.2.9 Statistics New Zealand, a government department and New Zealand's national statistical office publishes data on building permits on monthly data. Building Permits or Building Consents, are issued when a building project is authorized for construction. Since Building Consents are the earliest signals of expanded housing supply, this is taken as a lead indicator by most actors in the housing market. The headline figure is the percentage change in new consents for house construction in the month.
2.3 Explorations into the Existing Data on House Construction in India
2.3.1 Considerable information on house construction is available from permit issuing authorities in India, as is the case of several other countries. The permit issuing authorities in India vary depending on the nature of settlement, as discussed below: |
| |
| - Municipal Corporation
- Town Planning Authority
- Tahsildaar (Nagar Parishad / Palika)
- Gram Panchayat |
| |
| 2.3.2 The documents in the hand of the above-mentioned authorities, where the information related to construction statistics are noted may be mentioned as follows: |
| |
| - Building Plan Register
- The individual files for the building permits that contain various documents like Project Proposal, Building Plan Approval, Commencement Certificate, Occupancy Certificate and Completion Certificate. |
| |
2.3.3 In view of the diversity of the practices and sources of the information, the Group examined the existing system and the data collected on construction related activities at various institutions like, National Buildings Organisation (NBO) - an organisation under the Ministry of Housing and Urban Poverty Alleviation- Government of India, DES-Government of Tamil Nadu, DES-Government of Delhi etc. The purpose was to analyse and assess the relevance and usability of the existing information for constructing a HSUI.
2.3.4 The NBO collects data on current housing and building construction activities in public and private sectors, prices of building materials, wage rates of labour, dates of issuance of building permits and that of completion certificates and Building Construction Cost Index based on the data from 63 major cities on annual basis with the help of the State Directorate of Economics and Statistics (DES).
2.3.5 National Building Organization has entrusted the responsibility of collecting the construction related statistics on a regular basis to the State DESs. The latter collect and compile information under the guidelines issued by the NBO. Houses are categorized by their plinth area such as Low Income Group (LIG), Middle Income Group (MIG) and High Income Group (HIG) and construction statistics is complied for public and private sectors separately. Data on construction in public sector includes all projects of Public Undertakings costing Rupees 2.5 million and above. The data are collected annually from the divisional offices of the public organizations in a uniform format prescribed by NBO. Private sector constructions include all permissions (residential and non-residential) issued by the local bodies. All the Class I and II towns and 10 per cent of the Class III to VI towns selected at random are covered under this system.
2.3.6 The details provided by NBO, DES-Tamil Nadu (TN) and Delhi on existing information system related to new construction activities are placed in Annex-4. Besides providing details of existing database in Tamil Nadu, DES-TN also undertook a study and conducted a sample survey on total permits issued for new constructions in Chennai during 2004-05 to identify the start-up rates (the proportion of houses started to total building permits issued). The framework and findings of this quick study are as follows: |
| • The survey did not include non-residential constructions. Also, addition and alteration of constructions to the existing buildings were not covered. New constructions, taken up in an unauthorized manner, were also not covered in this survey.
• A fairly representative year 2004-05 is selected as the reference year for the study. As the construction permissions issued by local bodies are valid for three years, those not reporting any construction at the time of the survey can be taken to have lapsed. The names and addresses of the permission holders, numbering about 5792, who were sanctioned the Construction permissions during the reference year, were collected from the Municipal Corporation. Individual permission holders were the respondents of this survey.
• Chennai Corporation has got 10 administrative zones. Variability was noticed in zone-wise distribution in the number of permissions issued. Consequently, a stratified random sampling method with proportionate allocation to the zones was adopted in the pilot survey. Two per cent of permission holders, numbering about 114 were randomly selected for detailed data collection. The questionnaires have been canvassed to the permission holders or their household members.
• Out of 114 building permissions pursued, in 111 cases, house constructions have started while in 3 cases, this has not happened. Out of 111 cases where house construction had started, only 10 were observed to have not been completed till the date of the survey. |
| |
| 2.3.7 At the instance of TAG, a meeting of the municipal commissioners and officers from town planning departments/urban development authorities from some selected cities with members of the Group was held at NBO, New Delhi to deliberate on issues relating to the existing system of data collection on building permits and explore suitable mechanisms for collection, compilation and collation of data on building permits. The municipal commissioners/officers present in the meeting were requested to submit the data as per the Schedule-A and B, Annex-5. Schedule-B is devised in order to find out the differences in the nature of institutions and variations in the procedures for issuance of permits across the states and cities in the country. This annexure includes questionnaires pertaining to the critical issues on house construction linked processes and practices. Based on the information from Schedules A and B in Annex- 5, the following points can be made |
| |
| • Responses from eleven municipal bodies were received in NBO. These include Ahmedabad, Delhi, Kolkata, Mumbai, Coimbatore, Puri, Bilaspur, Korba, Bhilai, Agarthala and Bhopal.
•The data on building permissions issued during the quarter April -June 2008 through Schedule A, Annex-5 is received from all the eleven cities. However information on house construction linked processes and practices through Schedule-B in Annex-5 is received only from two centers namely, Puri and Mumbai .
• As regards construction linked processes and practices, the information (Schedule B, Annex-5 ) is received only from two centres. It is, therefore, difficult to come to any conclusion regarding the nature of practices followed in various cities across the country. However, the procedures adopted in the cities of Puri and Mumbai are similar except a few exceptions.
• One can derive only a few conclusions from the limited information (Schedule B, Annex-5) that have been collected and analysed. The attempt nonetheless revealed that the information required for constructing HSUI are largely available at the city level and are already being complied, although not very systematically. One can also argue that the system can be strengthened to generate whatever additional data requirements may come up for undertaking the exercise. For this, the inter-institutional linkages are to be strengthened and there must be political will at the highest level, backing up the effort. |
| |
Section 3
METHODOLOGY
3.1 Background
3.1.1 The Group observed that the present data collection system as organised and updated by National Building Organization can be strengthened and fine tuned to have the requisite base data for constructing a housing start-up index (HSUI) on a quarterly basis.
3.1.2 The objective of the HSUI is to track the changes in the level of construction activities in housing sector, which can identify and signal growth or reversionary tendencies in the housing sector. The housing starts in a particular quarter can be estimated from the permits issued in that quarter and the various past quarters by using the rates at which the permits have got converted into starts in the recent past. It would therefore be important to construct a series of start rates (coefficients) for the permits given during the preceding quarters based on the information on actual starts after the issuance of the permits. These coefficients are expected to be different for different quarters due to the seasonality involved in the housing starts. The data on housing starts for a two year period or eight quarters has been considered appropriate for building up the series of coefficients. For the housing starts, out of the permits given before two years, an 'aggregate coefficient’ may be calculated based on the actual empirical data. Thus, there will be nine coefficients for each quarter of the year, eight for the preceding quarters, and one more for the residual permits that are two-year old. Since these coefficients are likely to be different for each of the four quarters, one would end up building up a matrix with four rows and nine columns.
3.1.3 Once the matrix of start-up rates is constructed based on survey data, the number of house construction started in a particular quarter, say A out of the permits issued in a preceding quarter, say B, can be obtained by multiplying the number of housing units authorised through issuance of permits in quarter B with the corresponding start rate (coefficient) in the matrix. Aggregation of the nine values thus obtained would give the total number of housing starts in the quarter A.
3.1.4 The Group decided that the scope of the index should be limited to new built residential buildings in urban areas of India, whose construction is authorised through issuance of building permits. Consequently, the pilot surveys undertaken to estimate the coefficients do not include permits for non-residential buildings including commercial, institutional and industrial buildings. Furthermore, the surveys do not include the publicly owned/built residential housing units. These cover only urban areas because the residential construction activities here are likely to affect macroeconomic parameters much more than in the rural areas. Un-authorised constructions can be excluded from the scope of the analysis. It is possible to assume that the excluded components are multicollinear with the formal residential units and hence the index can signal the direction of movement for both.
3.1.5 After overviewing the results of the survey conducted by DES-TN, the Group felt about the need to conduct a comprehensive pilot surveys in few cites/town in order to generate housing start coefficients and test their sturdiness. It is only then that these numbers can be recommended for application to the information on the number of building permits for constructing HSUI. The objective of the pilot surveys should be to construct the Start up Coefficient Matrix with adequate empirical strength so that HSUI can be constructed on a quarterly basis. It should help in identifying the difficulties and challenges in this exercise as also sorting out the issues related to sampling design, selection of variables, weighting pattern, choice of base year etc.
3.1.6 The Group suggested that the pilot survey, using a common methodology and schedules, should be conducted in 3 class I cities and 3 small towns. A subgroup was constituted for designing of the schedules for data collection. The comments/suggestions on the schedules prepared by the subgroup were obtained from the members based on which the methodology for data collection for the pilot study was also finalized. The three class-I cities identified for the survey were Mumbai, Delhi and Coimbatore. The respective Directorate of Economic and Statistics (DES) were entrusted with the data collection job. It was considered important to collect information from one small town in the states of Maharashtra and Tamil Nadu and one near the National Capital Territory of Delhi for the calendar years 2003 and 2004. The choice of two calendar years was made with a view to identify temporal differences in the start rates as it may help to fix the periodicity for conducting such surveys for generating the coefficients, to be used for constructing HSUI. The concerned DESs were requested to conduct the surveys by selecting the town as per the framework of the project and report the results to the Group.
3.1.7 The Terms and Definitions used in the study are presented in Annex 6.
3.2 Data Collection
3.2.1 The data related to housing starts were collected in two stages as per the survey schedule given in Annex-7. The survey schedule has two parts.
3.2.2 Collection of Information on Building Permits: Information on the permits issued for new residential construction was collected from the permit issuing authorities in all cities and towns through Schedule –Part I given in Annex-7. The permits for alterations of the existing building were not included in their survey. However, the permits given for additional housing units in the existing building; construction of new building by demolishing the old existing building were included. The survey excluded all non-residential buildings, as noted above. However, mixed-use houses like residential cum commercial, residential cum industrial units etc. were included.
3.2.3 Survey conducted for determining the coefficients of Housing Starts: The data on housing starts were collected by drawing a sample from the permits issued for new residential buildings in city during the four quarters in certain reference year. The reference year was assumed to be two or three years old, generally coinciding with the period of validity of the license. The survey tracked these sample permits in order to ascertain in which quarter and year during the subsequent period, the owner or the builder who obtained the permit actually started the construction. The information was obtained using the Schedule –Part II, given in Annex 7.
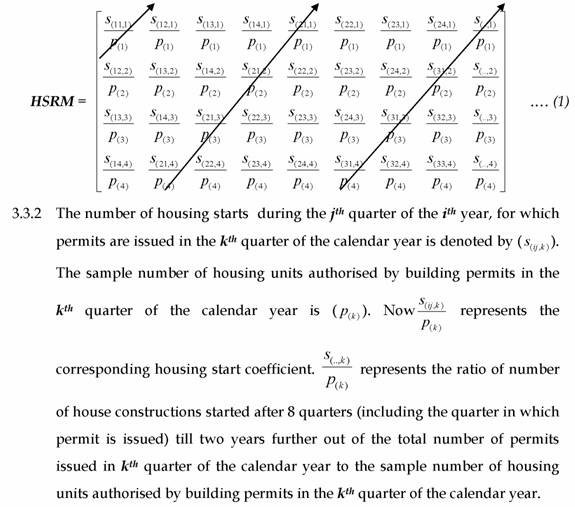
3.2.4 Sampling method: The sample selection for the survey was based on a stratified sampling method in which the units in each stratum were randomly selected. In each administrative/tax zone/ward, the data on permits were further stratified based on the type of the building (Single Housing Unit (SHU) or Multiple Housing Unit (MHU)). For example, if a particular centre had 5 zones, each zone was further stratified into 2 strata. i.e. in total 10 strata. In each such stratum, 5 per cent sample of the total building permits for new residential construction was selected based on systematic sampling procedure. If the 5 per cent of the total happens to be fraction, the next integer was taken as the sample size. If total number of permits in a stratum was less than 10, then all permits were taken to constitute the sample. If 5 per cent of the total number of permits in a stratum turned out to be less than 10, then the sample size was taken as 10. 3.3 Housing Start Rates (coefficients) 3.3.1 The data collected on permits using Schedule –Part I, pertain to four periods of the reference year (2003 - from the first quarter to the fourth quarter). These were taken as the starting observations for the survey. It tried to estimate the number of house constructions started in all the succeeding quarters out of the sample, staring from the quarter in which the permits were issued till the latest period. Following international practice, all the house constructions started after the lapse of two years of issue of permits till two years further were added together. The last coefficient would indicate the house starts taking place over for two years - after the lapse of two years. This may be taken to reflect the coefficient of start ups in a quarter out of all old two year old permits till two years further. All houses started beyond 4 years of permit issue were assumed as not started. Based on this data corresponding to different quarters of the years, 9 start-up rates (1 for the quarter in which permits were issued, 7 for the 7 succeeding quarters and 1 for all the starts after 2 years till two years further) were computed. This produces a 4x9 matrix of start rates (coefficients) (see (1) and (2)). This matrix (HSRM) is used for estimating the number of housing starts in each quarter, using the methodology described below. |
| |
| old permits till two years further. All houses started beyond 4 years of permit issue were assumed as not started. Based on this data corresponding to different quarters of the years, 9 start-up rates (1 for the quarter in which permits were issued, 7 for the 7 succeeding quarters and 1 for all the starts after 2 years till two years further) were computed. This produces a 4x9 matrix of start rates (coefficients) (see (1) and (2)). This matrix (HSRM) is used for estimating the number of housing starts in each quarter, using the methodology described below. |
| |
|
|
| |
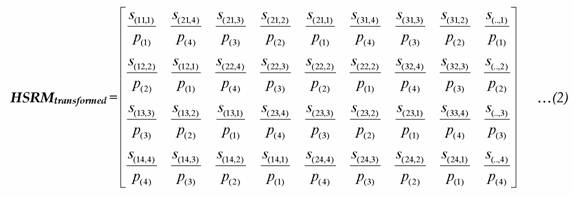
| 3.3.3 The first start rate coefficient that is to be applied for estimating the housing starts in a quarter is computed by dividing the number of constructions started in that quarter for which permits are issued in that quarter itself. Understandably, many more house constructions would start during this quarter for which permissions have been obtained in pervious quarters. But the coefficients in the first row of the matrix HSRM show how the permits given in the first quarter got converted into housing start in the subsequent quarters. The second row gives the corresponding coefficients for the second quarter. To estimate the number of starts in a quarter, therefore the matrix HSRM is to be transformed. The transformed matrix HSRMtransformed is obtained by rearranging HSRM. |
| |
|
|
| |
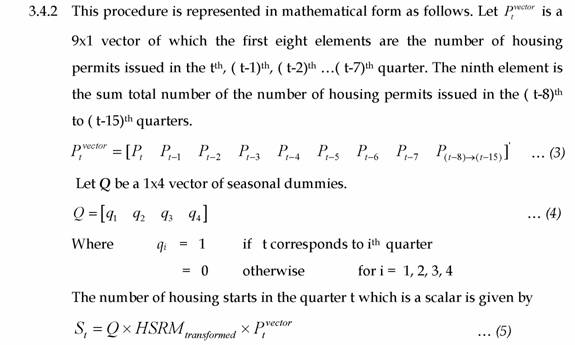
3.3.4 This matrix HSRMtransformed is to be used for estimating the housing start figure for a particular quarter. The first row of HSRMtransformed gives the coefficients of housing start for the first quarter of the calendar year, based on permissions given in previous quarters. Similarly the second, third and fourth rows correspond to the second, third and fourth quarters of the calendar year respectively. The four series of start rates (coefficients) corresponding to the four quarters are estimated to incorporate the factor of seasonality. This matrix of start rates can be obtained separately for SHU and MHU and can be used for estimating the housing start in each quarter separately for SHU and MHU. 3.4 Compilation of Housing Starts 3.4.1 The number of SHU or MHU house constructions started in a particular centre during a particular quarter can be obtained by multiplying the start rates (coefficients) in the HSRMtransformed matrix with the corresponding total number of housing permits issued (in the current as also the preceding quarters). The choice of the row or the set of start rates depends on the quarter for which the housing starts are to be estimated. For example, if we are interested in estimating the number of housing starts in the third quarter of the calendar year then the third row of the HSRMtransformed matrix should be used along with the corresponding figures for housing permits. |
| |
|
|
| |
3.4.3 The number of housing starts can be estimated by two methods: i) by adding the number of housing starts corresponding to SHU and MHU giving equal weights; ii) by adding the number of housing starts corresponding to SHU and MHU giving weights proportional to the average Floor Space Area (FSA) corresponding to each category. 3.5 Compilation of Housing Start-Up Index 3.5.1 As the number of urban centers in India is quiet large, compiling housing starts for each and every center and thereby obtaining an All India figure on a quarterly basis is difficult. As an alternative, a few centers can be chosen and an index can be developed at All India level using the information obtained from these selected centers.
3.5.2 The Group proposes that the HSUI may be computed using the housing starts coefficients estimated for select centres using methodology, as explained in sections 3.3 and 3.4.
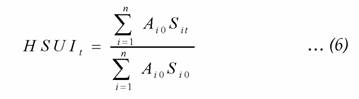
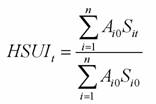
3.5.3 The HSUI is estimated using the formulae given below |
| |
|
|
| |
Where n is the number of centres, Ai0 is the average FSA in the ith centre in the base period; Sitis the number of housing starts in the tth quarter in ith centre; Si0is the number of housing starts in the base period in ith centre. |
| |
Section 4
PILOT SURVEY RESULTS AND LIMITATIONS OF METHODOLOGY
4.1 The Case study in Coimbatore
4.1.1 In Coimbatore, 1421 permits were issued during the calendar year 2003 (January – December), of which 42 (3.0 per cent) permits did not specify the type of the building. Of the remaining 1379 permits, 838 (60.8 per cent) were for Single Housing Units (SHU) and 541 (39.2 per cent) were for Multiple Housing Units (MHU).
4.1.2 During 2004, 1625 permits were issued, of which 7 (0.4 per cent) permits did not carry the information regarding the type of the building. Of the remaining, 804 (49.7 per cent) were for Single Housing Units (SHU) and 814 (50.3 per cent) were for Multiple Housing Units (MHU).
4.1.3 The quarter wise permits issued in Coimbatore during 2003 and 2004 are given in Table 4.1.1. |
| |
| Table 4.1.1 - Total Number of Permits Issued in Coimbatore |
Year |
Quarter |
Type |
Total |
SHU |
MHU |
2003 |
1Q |
216
71.1% |
88
28.9% |
304
100.0% |
2Q |
191
59.0% |
133
41.0% |
324
100.0% |
3Q |
184
56.6% |
141
43.4% |
325
100.0% |
4Q |
247
58.0% |
179
42.0% |
426
100.0% |
Total |
838
60.8% |
541
39.2% |
1,379
100.0% |
2004 |
1Q |
245
57.6% |
180
42.4% |
425
100.0% |
2Q |
178
47.0% |
201
53.0% |
379
100.0% |
3Q |
197
47.8% |
215
52.2% |
412
100.0% |
4Q |
184
45.8% |
218
54.2% |
402
100.0% |
Total |
804
49.7% |
814
50.3% |
1,618
100.0% |
|
| |
| 4.1.4 Based on the sampling design discussed above, a total of 608 permit sites were selected. Of which 320 sites correspond to permits issued in 2003 and 288 sites to the following year. The zone wise sample permit sites visited are given in Table 4.1.2. |
| |
| Table 4.1.2- Sample Number of Buildings covered in Coimbatore |
Permits issued in |
2003 |
2004 |
Total |
East Zone |
80 |
80 |
160 |
West Zone |
80 |
80 |
160 |
North Zone |
80 |
80 |
160 |
South Zone |
80 |
48 |
128 |
Total |
320 |
288 |
608 |
|
| |
4.1.5 Of the 320 permit site visits corresponding to 2003, 182 were for SHU and 138 for MHU. Of the 288 permits given during the year 2004, 174 were for SHU and 114 for MHU.
4.1.6 Of the 182 building sanctions given in 2003 for SHU, 8 (4.4 per cent) had not stared construction till the date of visit. Of the 138 permits given for MHU, 3 (2.2 per cent) were yet to start their construction. Similarly, out of 174 and 114 permits issued to SHU and MHU respectively during the calendar year 2004, 9 (5.2 per cent) and 1 (0.9 per cent) had not started their construction.
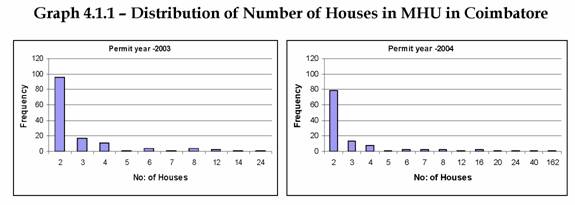
4.1.7 The frequency distribution of the number of houses in the MHU is given below in Graph 4.1.1. One permit issued in the year 2004 consisted of a MHU with 162 housing units, which was revealed during the sample survey. This was removed from the sample while constructing the start rate matrix because of its large size affecting the macro results. |
| |
|
|
| |
4.1.8 Table 4.1.3 provides the average Floor Space Area (FSA) in Sq.ft in the 4 zones for SHU and MHU. The average FSA did not vary much across the zones. However, the SHU were found to have higher average FSA than MHU.
|
| |
| Table 4.1.3 –Average Floor Space Area in Coimbatore |
Zone |
Average Area (Sq.ft) |
SHU |
MHU |
East |
1219 |
673 |
West |
1112 |
871 |
North |
1353 |
612 |
South |
1488 |
889 |
Total |
1270 |
785 |
|
| |
| 4.1.9 The per cent distribution of the housing starts for SHU and MHU are given in Table 4.1.4 and Table 4.1.5 respectively. From theses tables it would be seen that about 90 per cent of permits issued during 2003 and 2004 got started within 2 quarters. |
| |
| Table 4.1.4 - Distribution of Housing Starts (SHU) in Coimbatore(per cent) |
| Started |
1Q2003 |
2Q2003 |
3Q2003 |
4Q2003 |
1Q2004 |
2Q2004 |
3Q2004 |
4Q2004 |
1Q2005 |
2Q2005 |
3Q2005 |
Not Started |
Issued |
|
|
|
|
|
|
|
|
|
|
|
|
1Q2003 |
74.5 |
10.6 |
6.4 |
-- |
-- |
2.1 |
-- |
-- |
-- |
-- |
-- |
6.4 |
2Q2003 |
x |
83.0 |
10.6 |
2.1 |
-- |
-- |
-- |
-- |
-- |
2.1 |
-- |
2.1 |
3Q2003 |
x |
x |
61.5 |
28.8 |
-- |
1.9 |
-- |
-- |
-- |
-- |
-- |
7.7 |
4Q2003 |
x |
x |
x |
66.7 |
27.8 |
-- |
-- |
-- |
5.6 |
-- |
-- |
-- |
| Started |
1Q2004 |
2Q2004 |
3Q2004 |
4Q2004 |
1Q2005 |
2Q2005 |
3Q2005 |
4Q2005 |
1Q2006 |
2Q2006 |
3Q2006 |
Not Started |
Issued |
|
|
|
|
|
|
|
|
|
|
|
|
1Q2004 |
63.6 |
31.8 |
2.3 |
2.3 |
-- |
-- |
-- |
-- |
-- |
-- |
-- |
-- |
2Q2004 |
x |
60.0 |
20.0 |
8.9 |
2.2 |
-- |
-- |
-- |
-- |
-- |
-- |
8.9 |
3Q2004 |
x |
x |
57.5 |
27.5 |
5.0 |
-- |
-- |
7.5 |
-- |
-- |
-- |
2.5 |
4Q2004 |
x |
x |
x |
57.8 |
24.4 |
4.4 |
2.2 |
2.2 |
-- |
-- |
-- |
8.9 |
|
| x: Not computable --: Nil/Negligible |
| |
| Table 4.1.5- Distribution of Housing Starts (MHU) in Coimbatore(per cent) |
| Started |
1Q2003 |
2Q2003 |
3Q2003 |
4Q2003 |
1Q2004 |
2Q2004 |
3Q2004 |
4Q2004 |
1Q2005 |
2Q2005 |
3Q2005 |
Not Started |
Issued |
|
|
|
|
|
|
|
|
|
|
|
|
1Q2003 |
52.1 |
35.3 |
10.5 |
2.1 |
-- |
-- |
-- |
-- |
-- |
-- |
-- |
-- |
2Q2003 |
x |
66.3 |
29.1 |
-- |
-- |
-- |
-- |
-- |
-- |
-- |
-- |
4.7 |
3Q2003 |
x |
x |
82.6 |
15.2 |
-- |
-- |
-- |
-- |
-- |
-- |
-- |
2.2 |
4Q2003 |
x |
x |
x |
91.7 |
5.6 |
-- |
-- |
1.4 |
1.4 |
-- |
-- |
-- |
| |
1Q2004 |
2Q2004 |
3Q2004 |
4Q2004 |
1Q2005 |
2Q2005 |
3Q2005 |
4Q2005 |
1Q2006 |
2Q2006 |
3Q2006 |
Not Started |
1Q2004 |
57.6 |
39.0 |
-- |
1.7 |
-- |
-- |
-- |
-- |
-- |
1.7 |
-- |
-- |
2Q2004 |
x |
62.5 |
25.0 |
2.8 |
4.2 |
2.8 |
-- |
-- |
-- |
-- |
-- |
2.8 |
3Q2004 |
x |
x |
60.4 |
27.1 |
8.3 |
2.1 |
-- |
2.1 |
-- |
-- |
-- |
-- |
4Q2004 |
x |
x |
x |
85.6 |
14.4 |
-- |
-- |
-- |
-- |
-- |
-- |
-- |
|
| x: Not computable --: Nil/Negligible |
| |
| 4.1.10 As described in the methodology in section 3.4, start rate matrices were obtained separately for SHU and MHU for the permit years 2003 and 2004. These are given in Tables 4.1.6 to 4.1.9. |
| |
Table 4.1.6 Start Rate Matrix in Coimbatore
for MHU for 2003
| 1Q |
0.52 |
0.06 |
-- |
-- |
-- |
0.01 |
-- |
-- |
-- |
2Q |
0.66 |
0.35 |
-- |
-- |
-- |
-- |
-- |
-- |
-- |
3Q |
0.83 |
0.29 |
0.11 |
-- |
-- |
-- |
-- |
-- |
-- |
4Q |
0.92 |
0.15 |
-- |
0.02 |
0.01 |
-- |
-- |
-- |
-- |
|
Table 4.1.7 Start Rate Matrix in Coimbatore
for MHU for 2004
| 1Q |
0.58 |
0.14 |
0.08 |
0.04 |
-- |
-- |
-- |
-- |
0.02 |
2Q |
0.63 |
0.39 |
-- |
0.02 |
0.03 |
-- |
-- |
-- |
-- |
3Q |
0.60 |
0.25 |
-- |
-- |
-- |
-- |
-- |
-- |
-- |
4Q |
0.86 |
0.27 |
0.03 |
0.02 |
-- |
0.02 |
-- |
-- |
-- |
|
--: Nil/Negligible Table 4.1.8 Start Rate Matrix in Coimbatore
for SHU for 2003
1Q |
0.75 |
0.28 |
-- |
-- |
-- |
0.06 |
-- |
-- |
-- |
2Q |
0.83 |
0.11 |
-- |
0.02 |
-- |
0.02 |
-- |
-- |
0.02 |
3Q |
0.62 |
0.11 |
0.06 |
-- |
-- |
-- |
-- |
-- |
-- |
4Q |
0.67 |
0.29 |
0.02 |
-- |
-- |
-- |
-- |
-- |
-- |
|
--: Nil/Negligible Table 4.1.9 Start Rate Matrix in Coimbatore
for SHU for 2004
1Q |
0.64 |
0.24 |
0.05 |
0.02 |
-- |
-- |
-- |
-- |
-- |
2Q |
0.60 |
0.32 |
0.04 |
-- |
-- |
-- |
-- |
-- |
-- |
3Q |
0.58 |
0.20 |
0.02 |
0.02 |
-- |
-- |
-- |
-- |
-- |
4Q |
0.58 |
0.28 |
0.09 |
0.02 |
0.02 |
0.08 |
-- |
-- |
-- |
|
| --: Nil/Negligible |
--: Nil/Negligible |
|
| |
| 4.1.11 The absolute difference between the matrices obtained through the permit issued in 2003 and 2004 for the MHU and SHU are given in Table 4.1.10 and 4.1.11 respectively. The standard errorsξ of these differences are reported in Table 4.1.12 to 4.1.13. The statistical significance in the difference was tested using the asymptotic test of equality of proportions. The start rates based on permits issued in 2003 and 2004 were found to be not statistically different at 1 per cent level of significance, expect for 3 cells for MHU (Table 4.1.10, 4.1.11). |
| |
Table 4.1.10 Absolute Difference in 2003 and 2004
Start Rates in Coimbatore for MHU
1Q |
0.06 |
0.09 |
0.08* |
0.04 |
-- |
0.01 |
-- |
-- |
0.02 |
2Q |
0.04 |
0.04 |
-- |
0.02 |
0.03 |
-- |
-- |
-- |
-- |
3Q |
0.22* |
0.04 |
0.11* |
-- |
-- |
-- |
-- |
-- |
-- |
4Q |
0.06 |
0.12 |
0.03 |
-- |
0.01 |
0.02 |
-- |
-- |
-- |
|
Table 4.1.11 Absolute Difference in 2003 and 2004
Start Rates in Coimbatore for SHU
1Q |
0.11 |
0.03 |
0.05 |
0.02 |
-- |
0.06 |
-- |
-- |
-- |
2Q |
0.23 |
0.21 |
0.04 |
0.02 |
-- |
0.02 |
-- |
-- |
0.02 |
3Q |
0.04 |
0.09 |
0.04 |
0.02 |
-- |
-- |
-- |
-- |
-- |
4Q |
0.09 |
0.01 |
0.07 |
0.02 |
0.02 |
0.08 |
-- |
-- |
-- |
|
*Significantly different at 1 per level of significance --: Nil/Negligible |
| Table 4.1.12 SE$ of Difference of 2003 and 2004
Start Rates in Coimbatore for MHU
1Q |
0.07 |
0.04 |
0.03 |
0.02 |
-- |
0.01 |
-- |
-- |
0.01 |
2Q |
0.08 |
0.08 |
-- |
0.02 |
0.02 |
-- |
-- |
-- |
-- |
3Q |
0.06 |
0.06 |
0.03 |
-- |
-- |
-- |
-- |
-- |
-- |
4Q |
0.04 |
0.05 |
0.02 |
0.02 |
0.01 |
0.01 |
-- |
-- |
-- |
|
Table 4.1.13 SE$ in Difference of 2003 and 2004
Start Rates in Coimbatore for SHU
1Q |
0.10 |
0.09 |
0.03 |
0.02 |
-- |
0.03 |
-- |
-- |
-- |
2Q |
0.09 |
0.08 |
0.03 |
0.02 |
-- |
0.02 |
-- |
-- |
0.02 |
3Q |
0.10 |
0.08 |
0.04 |
0.02 |
-- |
-- |
-- |
-- |
-- |
4Q |
0.11 |
0.10 |
0.05 |
0.02 |
0.02 |
0.04 |
-- |
-- |
-- |
|
| --: Nil/Negligible |
--: Nil/Negligible |
|
| |
| 4.1.12 Given the fact that the indices for the two years are not at variance with each other, it is decided to combine them. The start rate matrices obtained by combining the matrices for 2003 and 2004 for SHU and MHU are given in Table 4.1.14 and 4.1.15 respectively. |
| |
Table 4.1.14 Start Rate Matrix@ in Coimbatore
for MHU
1Q |
0.55 |
0.10 |
0.04 |
0.02 |
-- |
0.01 |
-- |
-- |
0.01 |
2Q |
0.65 |
0.37 |
-- |
0.01 |
0.01 |
-- |
-- |
-- |
-- |
3Q |
0.71 |
0.27 |
0.05 |
-- |
-- |
-- |
-- |
-- |
-- |
4Q |
0.89 |
0.21 |
0.01 |
0.02 |
0.01 |
0.01 |
-- |
-- |
-- |
|
Table 4.1.15 Start Rate Matrix@ in Coimbatore
for SHU
1Q |
0.69 |
0.26 |
0.02 |
0.01 |
-- |
0.02 |
-- |
-- |
-- |
2Q |
0.72 |
0.21 |
0.02 |
0.01 |
-- |
0.01 |
-- |
-- |
0.01 |
3Q |
0.60 |
0.15 |
0.04 |
0.01 |
-- |
-- |
-- |
-- |
-- |
4Q |
0.62 |
0.28 |
0.05 |
0.01 |
0.01 |
0.03 |
-- |
-- |
-- |
|
| --: Nil/Negligible |
--: Nil/Negligible |
|
| |
4.2 Case Study of Villupuram 4.2.1 In Villupuram, 35 permits were issued in 2003 of which, 19 (54.3 per cent) were for SHU and 16 (45.7 per cent) were for MHU. Among the 30 permits issued in 2004, 24 (80 per cent) were for SHU, while only 6 (20 per cent) for MHU. The numbers of permits disaggregated by different quarters of the year are given in Table 4.2.1. 4.2.2 All the permit sites were visited for the housing start survey (Schedule Part-II) as the number of permits was small. It was found that construction had begun for all the permits given during 2003 for SHU, expect just one case. It was also found that all the MHU for which permits were given in 2003 and 2004 had exactly 2 housing units. |
| |
| Table 4.2.1 - Total Number of Permits Issued in Villupuram |
Year |
Quarter |
Type |
Total |
SHU |
MHU |
2003 |
1Q |
2
40.0% |
3
60.0% |
5
100.0% |
2Q |
10
58.8% |
7
42.2% |
17
100.0% |
3Q |
3
50.0% |
3
50.0% |
6
100.0% |
4Q |
4
57.1% |
3
42.9% |
7
100.0% |
Total |
19
54.3% |
16
45.7% |
35
100.0% |
2004 |
1Q |
8
80.0% |
2
20.0% |
10
100.0% |
2Q |
5
62.5% |
3
37.5% |
8
100.0% |
3Q |
4
100.0% |
0
0.0% |
4
100.0% |
4Q |
7
87.5% |
1
12.5% |
8
100.0% |
Total |
24
80.0% |
6
20.0% |
30
100.0% |
|
| |
4.2.3 Villupuram being a small centre, the number of permits issued in each quarter was noted as very small. Consequently, the SHU and MHU units were combined to obtain a single start rate matrix for the town. The per cent distribution of the housing starts is given in Table 4.2.2. It is important that almost 80 per cent of the constructions got started in the same quarter in which permits were issued.
4.2.4 The average FSA of SHU was found to be 935 sq.ft. MHU were noted to have a lower average FSA of 381 sq.ft. only. |
| |
| Table 4.2.2- Distribution of Housing Starts in Villupuram (per cent) |
| Started |
1Q2003 |
2Q2003 |
3Q2003 |
4Q2003 |
1Q2004 |
2Q2004 |
3Q2004 |
4Q2004 |
1Q2005 |
2Q2005 |
3Q2005 |
Not Started |
Issued |
|
|
|
|
|
|
|
|
|
|
|
|
1Q2003 |
100.0 |
-- |
-- |
-- |
-- |
-- |
-- |
-- |
-- |
-- |
-- |
-- |
2Q2003 |
x |
96.2 |
-- |
-- |
-- |
-- |
-- |
-- |
-- |
-- |
-- |
3.8 |
3Q2003 |
x |
x |
77.8 |
22.2 |
-- |
-- |
-- |
-- |
-- |
-- |
-- |
-- |
4Q2003 |
x |
x |
x |
90.0 |
10.0 |
-- |
-- |
-- |
-- |
-- |
-- |
-- |
| Started |
1Q2004 |
2Q2004 |
3Q2004 |
4Q2004 |
1Q2005 |
2Q2005 |
3Q2005 |
4Q2005 |
1Q2006 |
2Q2006 |
3Q2006 |
Not Started |
Issued |
|
|
|
|
|
|
|
|
|
|
|
|
1Q2004 |
75.0 |
16.7 |
18.3 |
-- |
-- |
-- |
-- |
-- |
-- |
-- |
-- |
-- |
2Q2004 |
x |
81.8 |
9.1 |
9.1 |
-- |
-- |
-- |
-- |
-- |
-- |
-- |
-- |
3Q2004 |
x |
x |
100.0 |
-- |
-- |
-- |
-- |
-- |
-- |
-- |
-- |
-- |
4Q2004 |
x |
x |
x |
88.9 |
11.1 |
-- |
-- |
-- |
-- |
-- |
-- |
-- |
|
x: Not computable --: Nil/Negligible |
| |
| 4.2.5 Start rate matrices were obtained separately for 2003 and 2004 using the methodology described in section 3.4. The results are given in Tables 4.2.3 and 4.2.4. |
| |
Table 4.2.3 Start Rate Matrix in Villupuram
for 2003
| 1Q |
1.00 |
0.10 |
-- |
-- |
-- |
-- |
-- |
-- |
-- |
2Q |
0.96 |
-- |
-- |
-- |
-- |
-- |
-- |
-- |
-- |
3Q |
0.78 |
-- |
-- |
-- |
-- |
-- |
-- |
-- |
-- |
4Q |
0.90 |
0.22 |
-- |
-- |
-- |
-- |
-- |
-- |
-- |
|
Table 4.2.4 Start Rate Matrix in Villupuram
for 2004
| 1Q |
0.75 |
0.11 |
-- |
-- |
-- |
-- |
-- |
-- |
-- |
2Q |
0.82 |
0.17 |
-- |
-- |
-- |
-- |
-- |
-- |
-- |
3Q |
1.00 |
0.09 |
0.18 |
-- |
-- |
-- |
-- |
-- |
-- |
4Q |
0.89 |
-- |
0.09 |
-- |
-- |
-- |
-- |
-- |
-- |
|
| --: Nil/Negligible |
--: Nil/Negligible |
|
| |
4.2.6 The absolute differences between the coefficients in the two matrices were computed as reported in Table 4.2.5. The values of the corresponding standard errors of the differences are given in 4.2.6. The statistical significance in the differences was tested using asymptotic test of equality of proportionsξ. The analysis suggests that the start rates based on permits issued during 2003 and the following year are not significantly different. (Table 4.2.5). The stability in these coefficients over time thus increases the confidence level in using these coefficients for making projections for housing starts for future years.
4.2.7 The start rate matrix obtained by combining the matrices for 2003 and 2004 is given in Table 4.2.7. |
| |
Table 4.2.5 Absolute Difference in 2003 and 2004
Start Rates in Villupuram
| 1Q |
0.25 |
0.01 |
-- |
-- |
-- |
-- |
-- |
-- |
-- |
2Q |
0.14 |
0.17 |
-- |
-- |
-- |
-- |
-- |
-- |
-- |
3Q |
0.22 |
0.09 |
0.18 |
-- |
-- |
-- |
-- |
-- |
-- |
4Q |
0.01 |
0.22 |
0.09 |
-- |
-- |
-- |
-- |
-- |
-- |
|
Table 4.2.6 SE$ in Difference of 2003 and 2004 Start Rates in Villupuram
| 1Q |
0.13 |
0.15 |
-- |
-- |
-- |
-- |
-- |
-- |
-- |
2Q |
0.12 |
0.11 |
-- |
-- |
-- |
-- |
-- |
-- |
-- |
3Q |
0.14 |
0.14 |
0.19 |
-- |
-- |
-- |
-- |
-- |
-- |
4Q |
0.14 |
0.13 |
0.10 |
-- |
-- |
-- |
-- |
-- |
-- |
|
*Significantly different at 1 per level of significance
--: Nil/Negligible |
|
| |
| Table 4.2.7 Start Rate Matrix@ in Villupuram |
1Q |
0.83 |
0.11 |
-- |
-- |
-- |
-- |
-- |
-- |
-- |
2Q |
0.92 |
0.11 |
-- |
-- |
-- |
-- |
-- |
-- |
-- |
3Q |
0.85 |
0.03 |
0.12 |
-- |
-- |
-- |
-- |
-- |
-- |
4Q |
0.89 |
0.15 |
0.03 |
-- |
-- |
-- |
-- |
-- |
-- |
|
| --: Nil/Negligible |
| |
4.3 Case Study of Delhi (South Zone)
4.3.1 Owing to the time and manpower constraints, DES-Government of Delhi, could conduct the survey only in Delhi-south zone and not in the entire city. In the selected area- Delhi South Zone, - as many as 147 and 163 permits were issued during the calendar years of 2003 and 2004 respectively. The quarter wise details of the permits issued are given in Table 4.3.1. |
| |
| Table 4.3.1 - Total Number of Permits Issued in Delhi (South) |
Year |
Quarter |
Frequency |
Percent |
2003 |
1Q |
36 |
24.5 |
2Q |
63 |
42.9 |
3Q |
30 |
20.4 |
4Q |
18 |
12.2 |
Total |
147 |
100.0 |
2004 |
1Q |
33 |
20.2 |
2Q |
40 |
24.5 |
3Q |
43 |
26.4 |
4Q |
47 |
28.8 |
Total |
163 |
100.0 |
|
| |
4.3.2 Of the 310 permits issued, 93 were surveyed through Schedule Part II. Of these, 4 permits were excluded from the tabulation as there were insufficient data. Of the remaining 89 permit sites, 47 permit sites correspond to the year2003 and 42 permit sites to 2004. These were visited for collection of information pertaining to housing starts.
4.3.3 Of the 47 permits issued in 2003, construction had not stared in just 1 (2.1 per cent) case till the date of the present survey. Similarly, for 2004 too, only one (2.4 per cent) holder of the permit had not started construction. The distribution of the housing starts is given in Table 4.3.2. From theses tables it could be argued that about 80 per cent of permit holders in both the years started their work within two quarters of getting their permit. |
| |
| Table 4.3.2- Distribution of Housing Starts in Delhi (South)(per cent) |
| Started |
1Q2003 |
2Q2003 |
3Q2003 |
4Q2003 |
1Q2004 |
2Q2004 |
3Q2004 |
4Q2004 |
1Q2005 |
2Q2005 |
3Q2005 |
Not Started |
Issued |
|
|
|
|
|
|
|
|
|
|
|
|
1Q2003 |
47.4 |
23.7 |
15.8 |
-- |
5.3 |
-- |
7.9 |
-- |
-- |
-- |
-- |
-- |
2Q2003 |
x |
68.8 |
12.5 |
-- |
9.4 |
-- |
-- |
9.4 |
-- |
-- |
-- |
-- |
3Q2003 |
x |
x |
43.8 |
37.5 |
9.4 |
9.4 |
-- |
-- |
-- |
-- |
-- |
-- |
4Q2003 |
x |
x |
x |
73.1 |
3.8 |
11.5 |
-- |
-- |
-- |
-- |
-- |
11.5 |
| Started |
1Q2004 |
2Q2004 |
3Q2004 |
4Q2004 |
1Q2005 |
2Q2005 |
3Q2005 |
4Q2005 |
1Q2006 |
2Q2006 |
3Q2006 |
Not Started |
Issued |
|
|
|
|
|
|
|
|
|
|
|
|
1Q2004 |
48.6 |
42.9 |
-- |
-- |
8.6 |
-- |
-- |
-- |
-- |
-- |
-- |
-- |
2Q2004 |
x |
66.7 |
22.2 |
11.1 |
-- |
-- |
-- |
-- |
-- |
-- |
-- |
-- |
3Q2004 |
x |
x |
66.7 |
25.0 |
8.3 |
-- |
-- |
-- |
-- |
-- |
-- |
-- |
4Q2004 |
x |
x |
x |
42.4 |
39.4 |
-- |
9.1 |
-- |
-- |
-- |
-- |
9.1 |
|
x: Not computable --: Nil/Negligible |
| |
| 4.3.4 Start rate matrices obtained separately for 2003 and 2004 using the methodology described in section 3.4 are given in Tables 4.3.3 and 4.3.4 |
| |
Table 4.3.3 Start Rate Matrix in Delhi (South)
for 2003
| 1Q |
0.47 |
0.04 |
0.09 |
0.09 |
0.05 |
-- |
-- |
-- |
-- |
2Q |
0.69 |
0.24 |
0.12 |
0.09 |
-- |
-- |
-- |
-- |
-- |
3Q |
0.44 |
0.13 |
0.16 |
-- |
-- |
-- |
0.08 |
-- |
-- |
4Q |
0.73 |
0.38 |
0.00 |
-- |
-- |
-- |
0.09 |
-- |
-- |
|
Table 4.3.4 Start Rate Matrix in Delhi (South)
for 2004
| 1Q |
0.49 |
0.39 |
0.08 |
-- |
0.09 |
-- |
-- |
-- |
-- |
2Q |
0.67 |
0.43 |
-- |
-- |
-- |
-- |
-- |
-- |
-- |
3Q |
0.67 |
0.22 |
-- |
0.09 |
-- |
-- |
-- |
-- |
-- |
4Q |
0.42 |
0.25 |
0.11 |
-- |
-- |
-- |
-- |
-- |
-- |
|
| --: Nil/Negligible |
--: Nil/Negligible |
|
| |
4.3.5 The absolute difference between the elements of the matrices for the year 2003 and 2004 and the corresponding standard errors are reported in Table 4.3.5 and 4.3.6 respectively. The statistical significance of the difference is tested using asymptotic test of equality of proportionsξ. The start rates based on permits issued in 2003 and 2004 are found to be not different at 1 per cent level of significance. Only in case of 2 cell values, the difference turns Out to be significant. (Table 4.3.5).
4.3.6 The start rate matrix obtained by combining the matrices for 2003 and 2004 is given in Table 4.3.7. |
| |
Table 4.3.5 Absolute Difference in 2003 and 2004
Start Rates in Delhi (South)
| 1Q |
0.01 |
0.36* |
0.01 |
0.09 |
0.03 |
-- |
-- |
-- |
-- |
2Q |
0.02 |
0.19 |
0.12* |
0.09 |
-- |
-- |
-- |
-- |
-- |
3Q |
0.23 |
0.10 |
0.16 |
0.09 |
-- |
-- |
0.08 |
-- |
-- |
4Q |
0.31 |
0.13 |
0.11 |
-- |
-- |
-- |
-- |
-- |
-- |
|
Table 4.3.6 SE$ in Difference of 2003 and 2004 Start Rates in Delhi (South)
| 1Q |
0.12 |
0.09 |
0.07 |
0.05 |
0.06 |
-- |
-- |
-- |
-- |
2Q |
0.12 |
0.12 |
0.05 |
0.05 |
-- |
-- |
-- |
-- |
-- |
3Q |
0.11 |
0.09 |
0.06 |
0.05 |
-- |
-- |
0.04 |
-- |
-- |
4Q |
0.13 |
0.13 |
0.06 |
-- |
-- |
-- |
0.06 |
-- |
-- |
|
| *Significantly different at 1 per level of significance |
| --: Nil/Negligible |
|
| |
| Table 4.3.7 Start Rate Matrix@ in Delhi (South) |
1Q |
0.48 |
0.24 |
0.09 |
0.06 |
0.07 |
-- |
-- |
-- |
-- |
2Q |
0.68 |
0.33 |
0.05 |
0.05 |
-- |
-- |
-- |
-- |
-- |
3Q |
0.54 |
0.16 |
0.08 |
0.05 |
-- |
-- |
0.04 |
-- |
-- |
4Q |
0.56 |
0.32 |
0.05 |
-- |
-- |
-- |
0.06 |
-- |
-- |
|
| |
4.4 Case Study of Saswad
4.4.1 In Saswad, of the 44 permits issued in 2003, 38 (86.4 per cent) were for SHU while 6 (13.6 per cent) were for MHU. Among the 48 permits issued in 2004, 29 (60.4 per cent) were for SHU while 19 (39.6 per cent) were for MHU. The quarter wise breakup of the permits issued is given in Table 4.4.1. It is found that in the second quarter in 2003, only one permit was issued.
4.4.2 As the number of permits was small, all the permit sites were covered in the survey. One permit issued in 2004 was found to be providing no information on type of the building in the permit document as well as in the sample survey. Hence this permit was excluded from the analysis.
4.4.3 12.1 per cent of the SHU and 18.2 per cent of MHU for which permits issued in 2003 had not stared the construction till the date of survey. Similarly, in case of the permits issued in 2004, for 10.3 per cent of the SHU and 16.7 per cent of MHU, construction has not started till the date of the survey. |
| |
Table 4.4.1 - Total Number of Permits Issued in Saswad |
Year |
Quarter |
Type |
Total |
SHU |
MHU |
2003 |
1Q |
10
83.3% |
2
16.7% |
12
100% |
2Q |
1
100% |
0
0% |
1
100% |
3Q |
11
84.6% |
2
15.4% |
13
100% |
4Q |
16
88.9% |
2
11.1% |
18
100% |
Total |
38
88.6% |
6
11.4% |
44
100% |
2004 |
1Q |
7
43.8% |
9
56.3% |
16
100% |
2Q |
8
88.9% |
1
11.1% |
9
100% |
3Q |
8
50.0% |
8
50.0% |
16
100% |
4Q |
6
85.7% |
1
14.3% |
7
100% |
Total |
29
60.4% |
19
39.6% |
48
100% |
|
| |
4.4.4 Saswad being a small centre, the number of permits issued in each quarter was found to be low. Hence the SHU and MHU were combined together and a single start rate matrix is compiled. The distribution of the housing starts is given in Table 4.4.2.
4.4.5 Start rate matrices are obtained separately for 2003 and 2004 using the methodology described in section 3.4. The results are given in Tables 4.4.3 and 4.4.4 Table 4.4.2- Distribution of Housing Starts in Saswad(per cent)
| Started |
1Q2003 |
2Q2003 |
3Q2003 |
4Q2003 |
1Q2004 |
2Q2004 |
3Q2004 |
4Q2004 |
1Q2005 |
2Q2005 |
3Q2005 |
Not Started |
Issued |
|
|
|
|
|
|
|
|
|
|
|
|
1Q2003 |
84.6 |
15.4 |
-- |
-- |
-- |
-- |
-- |
-- |
-- |
-- |
-- |
-- |
2Q2003 |
x |
100.0 |
-- |
-- |
-- |
-- |
-- |
-- |
-- |
-- |
-- |
-- |
3Q2003 |
x |
x |
35.3 |
29.4 |
-- |
-- |
-- |
-- |
-- |
-- |
10.8 |
23.5 |
4Q2003 |
x |
x |
x |
66.7 |
9.5 |
-- |
-- |
4.8 |
-- |
-- |
-- |
19.0 |
| Started |
1Q2004 |
2Q2004 |
3Q2004 |
4Q2004 |
1Q2005 |
2Q2005 |
3Q2005 |
4Q2005 |
1Q2006 |
2Q2006 |
3Q2006 |
Not Started |
Issued |
|
|
|
|
|
|
|
|
|
|
|
|
1Q2004 |
45.8 |
-- |
12.5 |
8.3 |
-- |
-- |
-- |
-- |
-- |
-- |
4.2 |
29.2 |
2Q2004 |
x |
33.3 |
44.4 |
22.2 |
-- |
-- |
-- |
-- |
-- |
-- |
-- |
-- |
3Q2004 |
x |
x |
71.9 |
8.8 |
18.4 |
-- |
-- |
0.9 |
-- |
-- |
-- |
-- |
4Q2004 |
x |
x |
x |
71.4 |
-- |
-- |
-- |
-- |
-- |
-- |
-- |
28.6 |
x: Not computable --: Nil/Negligible
Table 4.4.3 Start Rate Matrix in Saswad
for 2003
| 1Q |
0.85 |
0.10 |
-- |
-- |
-- |
-- |
-- |
-- |
-- |
2Q |
1.00 |
0.15 |
-- |
-- |
-- |
-- |
-- |
-- |
-- |
3Q |
0.35 |
-- |
-- |
-- |
-- |
-- |
-- |
-- |
0.11 |
4Q |
0.67 |
0.29 |
-- |
-- |
0.05 |
-- |
-- |
-- |
-- |
|
Table 4.4.4 Start Rate Matrix in Saswad
for 2004
| 1Q |
0.46 |
-- |
0.18 |
-- |
-- |
-- |
-- |
-- |
0.04 |
2Q |
0.33 |
-- |
-- |
-- |
-- |
-- |
-- |
-- |
-- |
3Q |
0.72 |
0.44 |
0.13 |
-- |
-- |
-- |
-- |
-- |
-- |
4Q |
0.71 |
0.09 |
0.22 |
0.08 |
-- |
0.01 |
-- |
-- |
-- |
|
| --: Nil/Negligible |
--: Nil/Negligible |
4.4.6 The absolute difference between the matrices constructed by following the permits issued in 2003 and 2004 and the corresponding standard errors of the differences are reported in Table 4.4.5 and 4.4.6 respectively. The statistical significance in the difference was tested using the asymptotic test of equality of proportionsξ. At 1 per cent level of significance, the start rates for 2003 and 2004 are found to be significantly different in 5 cells. Also, the extent of difference is found to be high here (Table 4.4.5).
Table 4.4.5 Absolute Difference in 2003 and 2004
Start Rates in Saswad
| 1Q |
0.39* |
0.10 |
0.18 |
-- |
-- |
-- |
-- |
-- |
0.04 |
2Q |
0.67* |
0.15 |
-- |
-- |
-- |
-- |
-- |
-- |
-- |
3Q |
0.37* |
0.44* |
0.13* |
-- |
-- |
-- |
-- |
-- |
0.11 |
4Q |
0.05 |
0.21 |
0.22 |
0.08 |
0.05 |
0.01 |
-- |
-- |
-- |
|
Table 4.4.6 SE$ in Difference of 2003 and 2004 Start Rates in Saswad
| 1Q |
0.14 |
0.08 |
0.08 |
-- |
-- |
-- |
-- |
-- |
0.04 |
2Q |
0.16 |
0.36 |
-- |
-- |
-- |
-- |
-- |
-- |
-- |
3Q |
0.12 |
0.05 |
0.03 |
-- |
-- |
-- |
-- |
-- |
0.08 |
4Q |
0.20 |
0.15 |
0.16 |
0.10 |
0.05 |
0.04 |
-- |
-- |
-- |
|
*Significantly different at 1 per level of significance |
--: Nil/Negligible |
4.4.7 The start rate matrix obtained by combining the matrices for 2003 and 2004 is given in Table 4.4.7.Table 4.4.7 Start Rate Matrix@ in Saswad
1Q |
0.59 |
0.07 |
0.16 |
-- |
-- |
-- |
-- |
-- |
0.03 |
2Q |
0.40 |
0.05 |
-- |
-- |
-- |
-- |
-- |
-- |
-- |
3Q |
0.67 |
0.40 |
0.08 |
-- |
-- |
-- |
-- |
-- |
0.01 |
4Q |
0.68 |
0.11 |
0.20 |
0.05 |
0.04 |
0.01 |
-- |
-- |
-- |
--: Nil/Negligible4.5 Case Study of Mumbai
4.5.1 Owing to the time and manpower constraints, DES of Maharashtra, could complete the survey in Mumbai in 8 months. In Mumbai, as many as 381 and 503 permits were issued during the calendar years of 2003 and 2004 respectively. The quarter-wise details of the permits issued are given in Table 4.5.1. Table 4.5.1 - Total Number of Permits Issued in Mumbai
Quarter |
Zone 1 (City) |
Zone 2 (Western) |
Zone 3 (Eastern) |
Total No: of Permits Issued in Mumbai |
1Q2003 |
5 |
22 |
18 |
45 |
2Q2003 |
17 |
64 |
18 |
99 |
3Q2003 |
23 |
72 |
29 |
124 |
4Q2003 |
19 |
69 |
25 |
113 |
1Q2004 |
17 |
59 |
35 |
111 |
2Q2004 |
30 |
84 |
19 |
133 |
3Q2004 |
32 |
60 |
27 |
119 |
4Q2004 |
17 |
93 |
30 |
140 |
Total |
160 |
523 |
201 |
884 |
4.5.2 Of the 884 permits issued, 307 were surveyed through Schedule Part II. Of these, 122 permit sites pertain to 2003, and 185 sites to the year 2004. These were visited for collection of information pertaining to housing starts.
4.5.3 Average number of houses in a permit is estimated to be 43.8 in 2003 and 56.7 in 2004.
4.5.4 Of the 122 sites visited corresponding to permits issued in 2003, construction had not started in 8 (6.6 per cent) cases. Out of 185 permit sites in 2004, 9 (4.9 per cent) had not started the construction. The profile of housing starts reveals that as compared to other cities where the pilot survey was conducted, the start rate in Mumbai is relatively low in first few quarters (Table 4.5.2) Table 4.5.2- Distribution of Housing Starts in Mumbai(per cent)
| Started |
1Q2003 |
2Q2003 |
3Q2003 |
4Q2003 |
1Q2004 |
2Q2004 |
3Q2004 |
4Q2004 |
1Q2005 |
2Q2005 |
3Q2005 |
Not Started |
Issued |
|
|
|
|
|
|
|
|
|
|
|
|
1Q2003 |
6.3 |
41.8 |
14.8 |
6.6 |
9.0 |
6.9 |
1.2 |
-- |
-- |
-- |
3.4 |
10.0 |
2Q2003 |
x |
20.9 |
27.7 |
7.3 |
3.8 |
6.5 |
9.2 |
0.6 |
12.7 |
-- |
7.5 |
3.7 |
3Q2003 |
x |
x |
21.1 |
17.4 |
23.9 |
3.4 |
-- |
9.7 |
5.5 |
-- |
13.3 |
5.6 |
4Q2003 |
x |
x |
x |
12.1 |
27.7 |
30.1 |
-- |
0.9 |
-- |
6.3 |
13.9 |
9.0 |
| Started |
1Q2004 |
2Q2004 |
3Q2004 |
4Q2004 |
1Q2005 |
2Q2005 |
3Q2005 |
4Q2005 |
1Q2006 |
2Q2006 |
3Q2006 |
Not Started |
Issued |
|
|
|
|
|
|
|
|
|
|
|
|
1Q2004 |
10.6 |
39.3 |
1.5 |
2.1 |
5.9 |
20.1 |
0.1 |
-- |
-- |
-- |
2.4 |
18 |
2Q2004 |
x |
45.7 |
12.4 |
24.9 |
2.6 |
5.9 |
4.3 |
1.2 |
-- |
-- |
0.9 |
2.2 |
3Q2004 |
x |
x |
33.3 |
50.1 |
0.8 |
5.2 |
1 |
4.4 |
-- |
-- |
5.2 |
-- |
4Q2004 |
x |
x |
x |
48.9 |
25.9 |
12.8 |
6.1 |
0.7 |
-- |
-- |
0.6 |
5.0 |
x: Not computable --: Nil/Negligible 4.5.5 Start rate matrices obtained separately for 2003 and 2004 are given in Tables 4.5.3 and 4.5.4
Table 4.5.3 Start Rate Matrix in Mumbai
for 2003
| 1Q |
0.06 |
0.28 |
0.24 |
0.04 |
0.09 |
-- |
0.06 |
0.13 |
0.03 |
2Q |
0.21 |
0.42 |
0.30 |
0.03 |
0.07 |
0.07 |
0.06 |
0.00 |
0.08 |
3Q |
0.21 |
0.28 |
0.15 |
0.00 |
0.00 |
0.09 |
-- |
0.14 |
0.13 |
4Q |
0.12 |
0.17 |
0.07 |
0.07 |
0.01 |
0.10 |
-- |
-- |
-- |
|
Table 4.5.4 Start Rate Matrix in Mumbai
for 2004
| 1Q |
0.11 |
0.26 |
0.01 |
0.03 |
0.06 |
-- |
-- |
-- |
0.02 |
2Q |
0.46 |
0.39 |
0.13 |
0.05 |
0.06 |
0.20 |
-- |
-- |
0.01 |
3Q |
0.33 |
0.12 |
0.02 |
0.06 |
0.01 |
0.04 |
-- |
0.01 |
0.05 |
4Q |
0.49 |
0.50 |
0.25 |
0.02 |
0.01 |
0.04 |
0.01 |
-- |
-- |
|
| --: Nil/Negligible |
--: Nil/Negligible |
4.5.6 The absolute differences between the matrices obtained through the permit issued in 2003 and 2004 and the corresponding standard errors$ of these differences are reported in Table 5 and 6 respectively. The statistical significance in the difference was tested using the asymptotic test of equality of proportionsξ. At 1 per cent level of significance, the start rates based on permits issued in 2003 and 2004 were found to be different in quiet a few cells. (Table 4.5.5).4.5.7 The matrix obtained by combining the start rate matrices for 2003 and 2004 is given in Table 4.5.7.
Table 4.5.5 Absolute Difference in 2003 and 2004
Start Rates in Mumbai
| 1Q |
0.05* |
0.02 |
0.23* |
-- |
0.03* |
-- |
0.06* |
0.13* |
-- |
2Q |
0.25* |
0.03 |
0.17* |
0.02 |
-- |
0.13* |
0.06* |
-- |
0.07* |
3Q |
0.12* |
0.15* |
0.13* |
0.06* |
-- |
0.05* |
-- |
0.13* |
0.08* |
4Q |
0.37* |
0.33* |
0.18* |
0.05* |
-- |
0.05* |
-- |
-- |
-- |
|
Table 4.5.6 SE$ of Difference of 2003 and 2004
Start Rates in Mumbai
| 1Q |
0.01 |
0.02 |
0.01 |
0.01 |
0.01 |
-- |
0.01 |
0.01 |
0.01 |
2Q |
0.01 |
0.02 |
0.01 |
0.01 |
0.01 |
0.01 |
0.01 |
0.00 |
0.01 |
3Q |
0.02 |
0.02 |
0.01 |
0.01 |
-- |
0.01 |
0.00 |
0.01 |
0.01 |
4Q |
0.01 |
0.01 |
0.01 |
0.01 |
-- |
0.01 |
-- |
-- |
-- |
|
*Significantly different at 1 per level of significance |
--: Nil/Negligible |
Table 4.5.7 Start Rate Matrix@ in Mumbai
1Q |
0.10 |
0.27 |
0.09 |
0.03 |
0.07 |
-- |
0.02 |
0.05 |
0.03 |
2Q |
0.36 |
0.40 |
0.20 |
0.05 |
0.06 |
0.17 |
0.02 |
-- |
0.03 |
3Q |
0.29 |
0.18 |
0.05 |
0.04 |
-- |
0.06 |
-- |
0.06 |
0.08 |
4Q |
0.35 |
0.39 |
0.18 |
0.03 |
-- |
0.06 |
-- |
-- |
-- |
--: Nil/Negligible 4.6 Compilation of HSUI – An Illustration of the Methodology
suggested in Section 3.4 the housing starts for 4th Quarter 2008 of Delhi (South) (C) can be obtained as:
Similarly the housing starts corresponding to other centers can also be worked out.
4.6.2 The present section presents the methodology for the compilation of HSUI within the analytical framework as discussed in the section 3.5. Let there be n centers. The objective of the exercise is simply to elaborate the steps involved and understand the empirical difficulties in this effort.
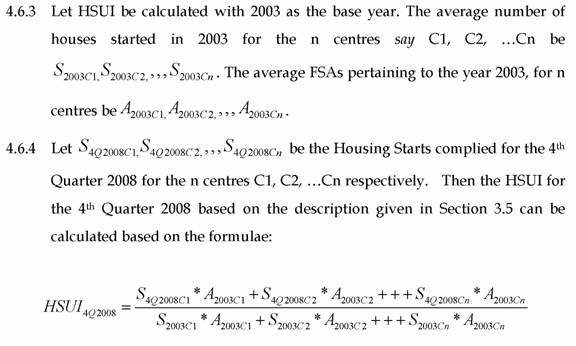
4.7 Difficulties and Limitations of the Exercise
4.7.1 All requisite information sought to be collected through Schedule Part I are available with the permit issuing authorities. Unfortunately, these are not available in the computerised form in many cases. It therefore became necessary to cull out the information from the registers and files maintained mostly in hand written form.
4.7.2 In the permit data, collected through Schedule Part-I (Survey of Building Permits), the data corresponding to some variables, for example number of housing units in the building, plinth area of the building and height of the building are not available even in the registers maintained by the concerned authorities. Hence the field staff had to go through the individual files for collecting the requisite information. In some centers (for example, Delhi), even the files did not contain the required information in several cases.
4.7.3 The information on the number of units in a Multiple Housing Unit (MHU), for which permission has been given, have been collected through Schedule Part-I but not very satisfactorily. This is a very important piece of information for working out housing starts. Importantly, this information was captured in the survey through Schedule Part-II (Sample Survey of Housing Starts) which was used for estimating the total number of housing units in the permits.
4.7.4 In case of MHU, it is difficult to ascertain the exact date by which construction can be taken to have started for each individual housing units. Hence all the housing units in an MHU are assumed to be started when the excavation or footing was laid for the building.
4.7.5 Some of the sites for which permits to construct houses were issued were found to be not occupied at the time of the survey and consequently the Part II schedule could not be canvassed. In some cases, the builder after handing over the building to the owner had shifted to a new address. In these cases, too, certain vital information like time of the building start could not be collected.
4.7.6 Some divergence was noted in the type of the permit issued as per the official records and the actual permit document, during the field survey. Some of the SHU permits were found to MHU and vice versa. However, for the compilation of the start rate matrices, the data from the field survey (Schedule Part II) were used. Notes:
ξ Test statistics for testing the equality of proportions is given by [(s1-s2)/SE] which follows N(0,1) asymptotically, where s1 and s2 corresponds to the start rates obtained in 2003 and 2004.
$ The SE in the difference of start rates is obtained by SQRT (s1(1-s1)/n1+s2(1-s2)/n2) @ The combined start rate s = (n1s1+n2s2)/(n1+n2). Section 5
RECOMMENDATIONS
5.1 Objective and Scope
5.1.1 The objective of constructing a Housing Start-Up Index (HSUI) is to measure the change in the level of activities in housing sector and to identify the growth/recessionary tendencies in this and related sectors of the economy.
5.1.2 The scope of HSUI would be limited to new built residential units in urban India, whose construction is authorised through issuance of building permits.
5.1.3 The HSUI may be constructed based on two sets of data
(a) The start up coefficients reflecting the recent experience of conversion of housing permits into housing starts and (b) the number of permits issued during the last two years or so. The Group recognized the fact that besides these, actual housing starts in any quarter are likely to be influenced by a host of other factors like price of building material, interest rate for housing loans, policy pronouncements, legislations, administrative orders affecting construction sector etc. To a certain extent, these factors would affect the demand and supply parameters of the housing market and consequently the number of permits issued, with possibly a time lag of a few months. One could, therefore, argue that these factors are included in the model through the number of permits.
5.1.4 The start up coefficients, computed from the data in recent past, reflect institutional and social response to housing permits in terms of their conversion into actual housing starts. The time required for administrative and procedural clearance after the issuance of permits, time taken to complete the formalities of obtaining loans, organizing material, community rituals etc. are considered to be rigid or fixed, at least in the short run. As housing is a long term decision, predictions based on these coefficients, that reflect to some extent procedural and social rigidities governing the house construction process, are likely to be fairly reliable.
5.1.5 The objective is to release the HSUI that can be used by housing related agencies as the basic or core predictor. The agencies can combine the index with other short term indicators and policy variables to come to more definitive projections of housing activity.
5.2 Periodicity
5.2.1 The Group observes that the present system of data collection, as reported by National Building Organization along with its formats may be fine tuned to obtain the requisite data on building permits on a quarterly basis. This would constitute the basic information for constructing the Housing Start-Up Index.
5.2.2 Conducting a field survey with adequate coverage of the urban centres that can be representative of the country as a whole would be the first step in institutionalising a system for regular release of HSUI. The Group recommends that this survey may be conducted once in three years for estimating/updating the start rate matrices for each of the selected centres. These start rates are to be used for computing the housing start figures in each of these centres using the data on building permits. These can then be aggregated to construct and release the HSUI on a quarterly basis.
5.2.3 The field survey for estimating the start rate matrices can be done in two phases. In the first phase, the data on building permits can be collected in the selected centres using Survey on Building Permits (SBP). The reference year for this survey would have to be three to four years before the date of conducting the Survey on the Housing Starts (SHS). The SHS is to be conducted in the second phase to determine the percentage distribution of the housing starts over the eight quarters (after the issuance of the permit, including the quarter of issuing) and thereafter and build start rate matrices in each of the centres.
5.3 Geographical Coverage 5.3.1 The Group recommends that as an initial effort, the HSUI may be launched based on such coefficient matrices constructed for 6 Metros and a select sample of Class I towns based on SBP and SHS. Small towns can be included at a later stage as it is found from the pilot survey that the number of housing starts in small centres is relatively less.
5.4 Sampling Method and Tools
5.4.1 The urban centres can be selected based on the number of permits issued as per the latest available data on building permits, by using probability proportional to size (PPS) method, so as to adequately represent of the total building permits issued at All India level. At the initial stage, when the exercise is limited to large cities only, appropriate adjustment in the method of city election may be made to make the sample representative of all class I cities.
5.4.2 Survey of Building Permits: The SBP can be conducted by collecting the details of all permits issued for new residential construction from permit issuing authorities of the selected centres, using Schedule –Part 1 given in Annex 7.
5.4.3 Survey on the Housing Starts: In this survey, a sample of permits issued for new residential buildings can be identified. The follow-up of this sample permits can be done by canvassing the Schedule–Part II of the questionnaire, as given in Annex 7, to the person responsible for the permit or the concerned builder. Information relating to starting of construction and other necessary aspects are to be obtained through this survey. A stratified sampling procedure as described in section 3.2.4 can be adopted for this survey in each center.
5.5 Estimation
5.5.1 Housing Starts Rate Matrix: From the data collected from Schedule –Part II,the number of sample houses started in all the succeeding quarters, staring from the quarter in which the sample permits are issued till the latest period can be obtained. In all the centres where pilot study has been conducted, it was noted that within 8 quarters of permit issue, more than 95 per cent of the construction gets started. Hence, all the housing units where construction started, after two year of issue of permits (8 quarters including the quarter in which permits are issued) are added to obtain the final residual aggregative coefficient. Based on this data corresponding to each quarter of year, 9 start rates (1 for the quarter in which permits are issued + 7 for the 7 succeeding quarters + 1 for all the starts after 1 year) corresponding to 4 different quarters of a year are worked out. Thus we estimate a 4x9 matrix of start rates (coefficients). This matrix can be transformed as described in section 3.3.3 to get the housing start rate matrix. The methodology for estimating housing start figures for release on a regular basis has been discussed in detail in section 3.3 of this Report.
5.5.2 It is found in the pilot study that the information on the number of housing units in a MHU is not available in most of the urban centres. The Group suggested that SHS can also be used to identify the average number of housing units in a MHU for different cities. This would be useful for estimating the number of housing units authorised to build through permits, in cases when the figure is not available in official records relating to issuance of permits.
5.5.3 Housing Starts: These start rate (coefficient) matrices can be used to obtain the housing starts for the selected Metros and Class I towns for which the regular data on building permits can be obtained without any difficulty on quarterly basis. The number of houses started in a particular centre for a particular quarter can be obtained by multiplying the start rates coefficients with the corresponding number of permits issued in that quarter and preceding quarters. The choice of the set of start rates to be used depends on the quarter for which the start rates are to be estimated. The methodology for compiling the housing starts is described in detail in section 3.4 of this Report.
5.5.4 Housing Start-Up Index: Separate HSUI can be compiled for different Classes of the centre (for example, Metros, Class 1 cities etc.) as well as for All India level using the year of Survey on Housing Starts as the base year. The formulae given below can be used to estimate the HSUI for the quarter t. |
| |
|
|
| |
| Where n is the number of centres, Ai0 is the average FSA of the ith centre in the base period; Sitis the number of housing starts in the tth quarter in ith centre; Si0is the number of housing starts in the base period in ith centre |
| |
5.6 Institutional Arrangement
5.6.1 A Standing Committee may be set up by the Reserve Bank of India to launch this initiative, monitor its progress, commission and overview the surveys for constructing start up matrices and consider increasing the scope and coverage of HSUI over time. It would have official members from the Central Statistical Organisation, office of the Registrar General, Ministry of Housing and Urban Poverty Alleviation and other concerned government departments, besides a few experts in the field.
5.6.2 National Buildings Organisation, Ministry of Housing & Urban Poverty Alleviation, Government of India is the nodal agency for collection and dissemination of housing and building construction statistics in the country. The Group recommends that NBO may collect the data on building permits issued for the new residential buildings in various centres (metros and class I cities at the first stage) across the country on a quarterly basis under the overall guidance of the Standing Committee.
5.6.3 Surveys to determine housing starts coefficients may be conducted every three years to examine the validity the matrix in use and identifying the areas where further research needs to be done to increase reliability of the estimates. RBI may coordinate with NSSO and NBO for the survey, based on which start rate matrices can be constructed for compilation of the HSUI.
5.6.4 An Advisory Committee on HSUI may be formed at NBO to guide and oversee the entire process of compilation of housing permit data from concerned local bodies and the Department of Economics and Statistics of the state governments, as specified by the Standing Committee, on a regular basis. The Advisory Committee may have members from Reserve Bank of India, National Statistical Commission, Central Statistical Organisation, National Sample Survey Organisation, Directorate of Economics and Statistics of select states that have a large number of Class I cities. |
| |
| Annex-1 |
| |
|
| Memorandum |
| |
|
|
|
|
|
General Instructions
- Residential Building: A building, which is primarily intended or used for dwelling/housing purposes. Other buildings are non-residential.
- Housing (Dwelling) unit: The accommodation availed by a household for its residential purpose. It may be an entire structure or a part thereof or consisting of more than one structure. There may be cases of more than one household occupying a single structure such as those living in independent flats, in which case, there will be as many housing units as the number of households in the structure. There may also be cases of one household occupying more than one structure (e.g. detached structure for sitting, sleeping, cooking, bathing etc.) for its housing accommodation. In this case, all the structure together constitutes a single housing unit.
- New Building Construction: New construction means the creation of an entirely new structure, whether or not the site on which it is built was previously occupied.
- Reported permits on residential buildings should only include newly owned residential buildings, which includes all residential buildings owned or partially owned by a private or private company or an individual during the period of construction.
- However, in a new building combining residential and nonresidential units (mixed buildings), even though the primary function of the entire building is for nonresidential purposes the permit should be included as the housing units in the mixed building are to be considered for the estimation of housing starts.
- Reported permits should not include commercial buildings, institutional buildings, industrial buildings and other buildings which include all buildings other than residential, industrial, commercial and institutional buildings e.g. cattle sheds, passenger shelters etc.
- Reported permits should not include demolitions, renovations and extensions of the existing building.
- Plinth Area: It means, ground area covered by the building above the plinth level. In case the building has more than one floor, it means the sum total of plinth areas of all the floors.
- Number of Storey: Number of Storey in building with ground floor only should be taken as one and it should be taken as ‘two’ if it has ground floor and first floor. It should be given in as similar manner for taller buildings. Barsati etc. on top floor construction may not be counted towards number of storey if covered area in is less than 25 percent of covered area on ground floor.
- Housing start: Work is begun when the first physical operation, such as, site-operation, delivery of materials and equipment to the site, start of excavation or laying foundation etc. is done after planning and designing stages. All housing units in a multiple housing unit building are defined as being started when excavation for the building has begun. For eg: if a particular building permit contains 50 housing units and the excavation begins for the footing or foundation of that building then it will be considered as 50 housing starts
- Building Completed(Work completed): A building on which work is completed and which is physically ready for occupation.
All permits pertaining to new residential construction issued during the calendar years (January to December) 2003and 2004 (total of eight quarters) should be collected through Schedule Part I.This listing could be used for the sample selection for the housing start survey. Sample selectionprocedure for the housing start survey (Schedule Part II) The sample selection will be based on a stratified sampling method in which the units in each stratum will be selected based on systematic random sampling method. In each administrative/tax zone/ward, the permits data can be further stratified based on type of the structure/building (Single housing unit (SHU) or Multiple housing unit (MHU)). (For eg. if a particular City have 5 zones. Then each zone should be further stratified into 2 strata. i.e. in total there will be 10 strata.) In each such stratum, a separate 5 per cent sample of the total building permits for new residential construction in that stratum should be selected separately based on systematic sampling procedure. If the 5 per cent of the total happens to be fraction the next possible integer should be taken as the sample size. (For. eg. 5 per cent of 201 is 10.1 then sample size is 11). If total number of permits in a stratum is less than 10 then all permits are to be taken into the sample. If the 5 per cent of the total number of permits in a stratum happens to be a number less than 10 then the sample size is to be taken as 10. Instructions for filling Schedule Part I
Question No: |
Instruction/Codes |
[1]
i), ii) and iii) |
Name along with the Census Code must be given |
[1]iv) |
Civic Status and code of the city/town |
[1]v) |
Class |
Population size |
Code |
Class I |
Population 1 Lakh & Above |
1 |
Class II |
50,000 to 99,999 |
2 |
Class III |
20,000 to 49,999 |
3 |
Class IV |
10,000 to 19,999 |
4 |
Class V |
5,000 to 9999 |
5 |
Class VI |
Below 5,000 |
6 |
|
[2] A |
Fill separate sheets for each quarter
Class |
Population size |
Code |
Quarter 1 |
January - March |
1 |
Quarter 2 |
April - June |
2 |
Quarter 3 |
July- September |
3 |
Quarter 4 |
October - December |
4 |
|
[2] B Cl.2 |
Administrative/Tax ward/zone of the building – This information for the pilot survey should be based on corporation or municipality records. |
[2] B Cl.4 |
Date should be in the format dd/mm/yyyy(for eg: 12th November 2007 should be 12/11/2007) |
[2] B Cl.9 |
| |
Code |
Single housing unit building |
1 |
Multiple housing unit building |
2 |
|
[2] B Cl.11 |
Number should not include basement but should include ground floor |
[2] B Cl.12 |
The plinth area should be given in Sq.Ft. |
[2] B Cl.13 |
The height should be in Ft. |
Instructions for filling Schedule Part II
Question No: |
Instruction/Codes |
[1] and [2] |
Can be obtained from Schedule Part I |
[4] i), ii) (f) |
|
[4]. ii) . (a),(e) |
Dates should be in the format mm/yyyy (for eg: October 2005 should be 10/2005) |
[4]. ii) . (c) |
Number should not include basement but should include ground floor |
[4]. ii) . (d) |
The plinth area should be given in Sq.Ft. |
List of Tables Table 4.1.1 Total Number of Permits Issued – Coimbatore
Table 4.1.2 Sample Number of Buildings Visited – Coimbatore
Table 4.1.3 Average Floor Space Area – Coimbatore
Table 4.1.4 Per cent Distribution of Housing Starts (SHU) – Coimbatore
Table 4.1.5 Per cent Distribution of Housing Starts (MHU) – Coimbatore
Table 4.1.6 Start Rate Matrix- Coimbatore-MHU- 2003
Table 4.1.7 Start Rate Matrix-Coimbatore - MHU- 2004
Table 4.1.8 Start Rate Matrix-Coimbatore - SHU- 2003
Table 4.1.9 Start Rate Matrix-Coimbatore - SHU- 2004
Table 4.1.10 Absolute Difference in Start Rates – Coimbatore –MHU
Table 4.1.11 Absolute Difference in Start Rates-Coimbatore– SHU
Table 4.1.12 SE in Difference of Start Rates – Coimbatore- MHU
Table 4.1.13 SE in Difference of Start Rates – Coimbatore – SHU
Table 4.1.14 Start Rate Matrix -Coimbatore- MHU
Table 4.1.15 Start Rate Matrix -Coimbatore- SHU
Table 4.2.1 Total Number of Permits Issued –Villupuram
Table 4.2.2 Per cent Distribution of Housing Starts –Villupuram
Table 4.2.3 Start Rate Matrix –Villupuram –2003
Table 4.2.4 Start Rate Matrix – Villupuram- 2004
Table 4.2.5 Absolute Difference in Start Rates - Villupuram
Table 4.2.6 SE in Difference of Start Rates – Villupuram
Table 4.2.7 Start Rate Matrix -Villupuram
Table 4.3.1 Total Number of Permits Issued -Delhi (South)
Table 4.3.2 Per cent Distribution of Housing Starts -Delhi (South)
Table 4.3.3 Start Rate Matrix –Delhi (South) – 2003
Table 4.3.4 Start Rate Matrix –Delhi (South)- 2004
Table 4.3.5 Absolute Difference in Start Rates – Delhi (South)
Table 4.3.6 SE in Difference of Start Rates – Delhi (South)
Table 4.3.7 Start Rate Matrix– Delhi (South)
Table 4.4.1 Total Number of Permits Issued –Saswad
Table 4.4.2 Per cent Distribution of Housing Starts –Saswad
Table 4.4.3 Start Rate Matrix – Saswad- 2003
Table 4.4.4 Start Rate Matrix – Saswad- 2004
Table 4.4.5 Absolute Difference in Start Rates - Saswad
Table 4.4.6 SE in Difference of Start Rates –Saswad
Table 4.4.7 Start Rate Matrix-Saswad
Table 4.5.1 Total Number of Permits Issued –Mumbai
Table 4.5.2 Per cent Distribution of Housing Starts –Mumbai
Table 4.5.3 Start Rate Matrix – Mumbai- 2003
Table 4.5.4 Start Rate Matrix – Mumbai- 2004
Table 4.5.5 Absolute Difference in Start Rates - Mumbai
Table 4.5.6 SE in Difference of Start Rates –Mumbai
Table 4.5.7 Start Rate Matrix-Mumbai |
| |
| List of Graphs |
| |
| Graph 4.1.1 Distribution of Number of Houses in MHU (year-wise) – Coimbatore |