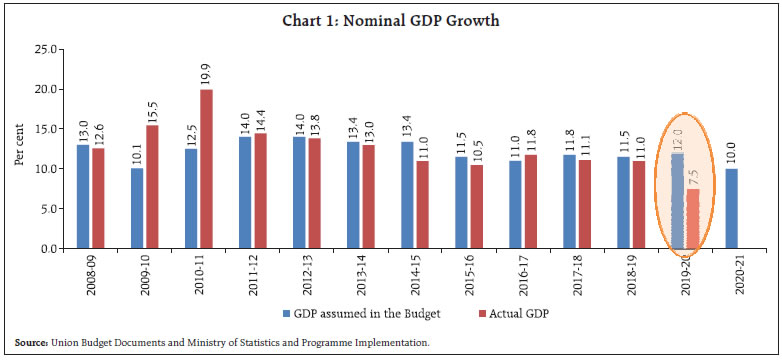
The Union Budget 2020-21 aimed at energising the Indian economy through a combination of short-term, medium-term and long-term measures. It walked a tight rope, balancing the need for providing counter-cyclical support to growth, while adhering to fiscal discipline. The Union Budget 2020-21 introduced tax reforms that aim to stimulate growth, simplify the tax structure, ease compliance and reduce litigations. The budget also avoided cutting down capital expenditure to meet the fiscal deficit target, which is laudable. Introduction The Union Budget 2020-21 walked a tight rope, balancing the dual imperatives of providing counter-cyclical support to growth and adhering to Fiscal Responsibility and Budget Management (FRBM) Act - prescribed fiscal deficit target. It adhered to fiscal prudence, given shortfalls in the tax collections, within the FRBM escape clause, while striving to maintain the quality of expenditure. The step-up in allocations to various sectors, such as agriculture, irrigation, rural development, education, skill upgradation, industry, commerce, investment, infrastructure, digital economy, environment and climate change, is sought to be financed mainly by non-tax revenue and disinvestment. Against this background, the rest of the article is divided into seven sections. Section II discusses the gross fiscal deficit and the underlying fiscal arithmetic, while Section III examines the receipt side of central government finances. Section IV deals with government spending and Section V highlights financing pattern of gross fiscal deficit. Section VI reflects upon outstanding liabilities of the government and Section VII presents an analysis of resource transfers from the Centre to states. Section VIII sets out concluding observations. Annex 1 lists the detailed sector-wise measures laid out in the Budget. II. Fiscal Deficit As against the budgeted gross fiscal deficit (GFD) of 3.3 per cent of GDP for 2019-20, the revised estimates placed the GFD at 3.75 per cent of GDP1. A similar overshoot, i.e., of 0.5 per cent of GDP, has also been budgeted for 2020-21, invoking the provisions under section 4(3) of the revised FRBM Act.2 The deterioration in the GFD in 2019-20 was primarily caused by a decline of 1.1 per cent of GDP in tax revenues even as non-tax revenues have provided some cushion. For 2020-21 the projected deviation from FRBM target is on account of maintaining expenditure trajectories, both revenue and capital, so as to stimulate domestic economic activity while pegging tax revenues to more realistic levels (Table 1). The Union Budget and Underlying Arithmetic The year 2019-20 witnessed a sharp deceleration in nominal GDP growth rate (between budgeted and revised estimates) which was sharper than even what was observed in 2008-09, the year of the global financial crisis (Chart 1).
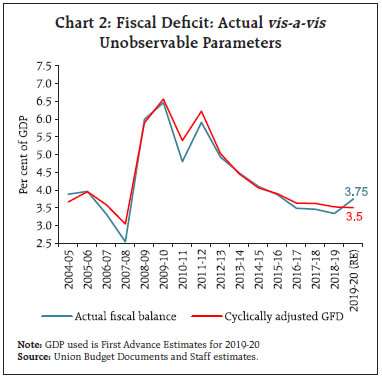
| Table 1: Key Fiscal Indicators | | (Per cent of GDP) | | | 2018-19 | 2019-20 | 2020-21 | 2021-22 | 2022-23 | | Actuals | BE | RE | BE | Projections | | 1 | 2 | 3 | 4 | 5 | 6 | 7 | | 1. Fiscal Deficit | 3.4 | 3.3 | 3.8 | 3.5 | 3.3 | 3.1 | | 2. Revenue Deficit | 2.4 | 2.3 | 2.5 | 2.7 | 2.3 | 1.9 | | 3. Primary Deficit | 0.4 | 0.2 | 0.7 | 0.4 | 0.2 | 0.0 | | 4. Tax Revenue | 11.0 | 11.7 | 10.6 | 10.8 | 10.7 | 10.7 | | 5. Non-Tax Revenue | 1.2 | 1.5 | 1.7 | 1.7 | 1.5 | 1.5 | | 6. Revenue Expenditure | 10.6 | 11.6 | 11.5 | 11.7 | - | - | | 7. Capital Expenditure | 1.6 | 1.6 | 1.7 | 1.8 | - | - | | Source: Union Budget 2020-21. | A slowdown in GDP growth can impact the GFD-GDP ratio in two ways: (i) automatic stabilisers come into play as tax revenues fall but the expenditure trajectory is maintained, thereby pushing up the numerator; and (ii) the denominator is lower than budgeted due to less than projected nominal growth in GDP. Adjusting for these two effects, the cyclically adjusted GFD works out to 3.5 per cent3, lower by 25 basis points than the revised estimate of 3.75 per cent in 2019-20, of which 12 basis points is due to the direct impact of lower GDP growth on the denominator (Chart 2). Decomposition of GFD The revenue deficit is likely to pre-empt almost 76.5 per cent of the GFD in 2020-21, reversing the improvement that was secured in 2018-19 and 2019-20. Importantly, however, capital expenditure is budgeted to post a sharp increase, likely to be funded primarily by higher disinvestments (Table 2).
| Table 2: Decomposition of GFD | | (Per cent) | | | 2017-18 | 2018-19 | 2019-20 | 2020-21 | | BE | Actual | BE | Actual | BE | RE | BE | | 1 | 2 | 3 | 4 | 5 | 6 | 7 | 8 | | 1. Revenue Deficit | 58.8 | 75.1 | 66.6 | 70.0 | 68.9 | 65.1 | 76.5 | | 2. Capital Outlay | 49.4 | 41.5 | 44.6 | 43.0 | 44.2 | 41.9 | 47.8 | | 3. Net Lending | 5.1 | 0.4 | 1.5 | 1.6 | 1.8 | 1.4 | 2.1 | | 4. Disinvestment (minus) | 13.3 | 16.9 | 12.8 | 14.6 | 14.9 | 8.5 | 26.4 | | Source: Union Budget Documents. | III. Receipts Total receipts, comprising net tax and non-tax revenues along with non-debt capital receipts, were 9.5 per cent of GDP in the Revised Estimates (RE) for 2019-20, falling short of the budgeted 9.9 per cent of GDP on account of lower realisations of tax revenue (7.4 per cent of GDP in RE as against 7.8 per cent in the Budget Estimates (BE)). Non-tax revenues held up well and even exceeded the BE modestly. Tax Revenues The gross tax revenue to GDP ratio is expected to reach 10.8 per cent in 2020-21 (10.6 per cent of GDP in 2019-20) on the back of higher budgeted buoyancies for all tax categories except personal income tax – on account of tax rate adjustments in favour of middle income brackets – and union excise duty. Notably, the envisaged buoyancies are also higher than their trend levels (proxied by 2011-18 averages) in respect of all taxes except excise duties (Table 3). Direct Taxes Direct taxes are budgeted to grow by 12.7 per cent in 2020-21 after a subdued 2.9 per cent growth recorded in 2019-20 (RE) (Table 4). Rationalisation of income tax rates across income groups and simplification in compliance is envisaged, which will result in ₹40,000 crore of revenue foregone. In addition, the removal of the dividend distribution tax will imply revenue losses of ₹25,000 crore. These losses to the exchequer need to be balanced against potential gain in tax buoyancy due to increased compliance and the enhanced attractiveness of India as an investment destination. Furthermore, tax concessions for start-ups, foreign investments, electricity generation companies, cooperatives, micro, small and medium enterprises (MSMEs) and affordable housing are likely to brighten the investment environment (details of the tax proposals in Annex I). Moreover, a simplified income tax architecture entails benefits for the middle class. The combined stimulus on account of the rationalisation of income tax and corporate tax rates (as announced earlier in 2019) amounts to around 0.7 per cent of GDP. | Table 3: Tax Buoyancy | | | Average Tax Buoyancy (2010-11
to 2017-18) | 2018-19 | 2019-20 (BE) | 2019-20 (RE) | 2020-21 (BE) | | 1 | 2 | 3 | 4 | 5 | 6 | | 1. Gross Tax Revenue | 1.15 | 0.77 | 1.63 | 0.54 | 1.16 | | 2. Direct Taxes | 1.00 | 1.23 | 1.56 | 0.39 | 1.23 | | (i) Corporation Tax | 0.84 | 1.48 | 1.38 | -1.07 | 1.12 | | (ii) Income Tax | 1.20 | 1.19 | 1.83 | 2.49 | 1.38 | | 3. Indirect taxes | 1.37 | 0.27 | 1.72 | 0.70 | 1.08 | | (i) GST | - | 2.87 | 1.25 | 0.71 | 1.24 | | (ii) Customs Duty | 0.47 | -0.79 | 2.88 | 0.82 | 1.01 | | (iii) Union Excise | 1.17 | -0.97 | 2.61 | 0.93 | 0.74 | Note: ‘-‘: Not applicable. Tax buoyancy is defined as the responsiveness of tax revenue to changes in nominal GDP.
Source: Staff calculations based on Union Budget Documents for various years. |
| Table 4: Tax Revenue of Central Government | | | ₹ thousand crore | Per cent of GDP | Growth Rate (per cent) | | 2018-19 | 2019-20 (BE) | 2019-20 (RE) | 2020-21 (BE) | 2019-20 (BE) | 2019-20 (RE) | 2020-21 (BE) | 2019-20 (BE) | 2019-20 (RE) | 2020-21 (BE) | | 1 | 2 | 3 | 4 | 5 | 6 | 7 | 8 | 9 | 10 | 11 | | 1. Direct tax | 1136.6 | 1335.0 | 1170.0 | 1319.0 | 6.3 | 5.7 | 5.9 | 17.5 | 2.9 | 12.7 | | of which: | | | | | | | | | | | | i. Income tax | 461.5 | 556.2 | 547.0 | 625.0 | 2.6 | 2.7 | 2.8 | 20.5 | 18.5 | 14.3 | | ii. Corporation tax | 663.6 | 766.0 | 610.5 | 681.0 | 3.6 | 3.0 | 3.0 | 15.4 | -8.0 | 11.5 | | 2. Indirect tax | 943.9 | 1126.2 | 993.4 | 1104.0 | 5.3 | 4.9 | 4.9 | 19.3 | 5.3 | 11.1 | | of which: | | | | | | | | | | | | i. GST | 581.6 | 663.3 | 612.3 | 690.5 | 3.1 | 3.0 | 3.1 | 14.1 | 5.3 | 12.8 | | CGST | 457.5 | 526.0 | 514.0 | 580.0 | 2.5 | 2.5 | 2.6 | 15.0 | 12.3 | 12.8 | | IGST | 28.9 | 28.0 | 0.0 | 0.0 | 0.1 | 0.0 | 0.0 | -3.3 | - | - | | Compensation Cess | 95.1 | 109.3 | 98.3 | 110.5 | 0.5 | 0.5 | 0.5 | 15.0 | 3.4 | 12.4 | | ii. Customs | 117.8 | 155.9 | 125.0 | 138.0 | 0.7 | 0.6 | 0.6 | 32.3 | 6.1 | 10.4 | | iii. Excise | 232.0 | 300.0 | 248.0 | 267.0 | 1.4 | 1.2 | 1.2 | 29.3 | 6.9 | 7.7 | | 3. Gross Tax Revenue (1+2) | 2080.5 | 2461.2 | 2163.4 | 2423.0 | 11.7 | 10.6 | 10.8 | 18.3 | 4.0 | 12.0 | | Source: Union Budget Documents. | Indirect Taxes Indirect tax collections in 2019-20 (RE) fell short by ₹1.3 lakh crore from the budget estimates due to shortfall in all its components. Indirect taxes are budgeted to grow by 11.1 per cent during 2020-21, with GST collections budgeted at ₹6.9 lakh crore - an increase of 12.8 per cent. The rationalisation of GST rates over the period is estimated to provide a stimulus of around ₹1.0 lakh crore. A step towards removal of bottlenecks associated with GST will further strengthen and streamline GST collections, going forward. On customs duty, the emphasis is on the containment of dumping of imports under various Free Trade Agreements (FTAs) that are harmful to domestic industry, especially labour-intensive MSMEs and sectors notified under Make in India. Non-Tax Revenues Receipts from non-tax revenues are budgeted to increase in 2020-21 by 11.4 per cent. Dividend and profits from public sector enterprises (including PSU banks) and surplus transfer from the RBI, which were higher than the budgeted amount by 22.2 per cent during 2019-20 (RE), are budgeted to decrease in 2020-21 (BE) (Table 5). | Table 5: Non-Tax Revenue | | | ₹ thousand crore | Growth Rate (per cent) | | 2018-19 | 2019-20 (BE) | 2019-20 (RE) | 2020-21 (BE) | 2018-19 | 2019-20 (BE) | 2019-20 (RE) | 2020-21 (BE) | | 1 | 2 | 3 | 4 | 5 | 6 | 7 | 8 | 9 | | Total Non-Tax Revenue | 235.7 | 313.2 | 345.5 | 385.0 | 22.3 | 32.9 | 46.6 | 11.4 | | Of which | | | | | | | | | | Dividend and Profits | 113.4 | 163.5 | 199.9 | 155.4 | 24.1 | 44.2 | 76.2 | -22.3 | | From PSEs | 43.1 | 57.5 | 48.3 | 65.7 | -7.4 | 33.5 | 12.1 | 36.2 | | From RBI/Banks/FIs | 70.4 | 106.0 | 151.6 | 89.6 | 56.9 | 50.7 | 115.5 | -40.9 | | Source: Union Budget Documents for various years. |
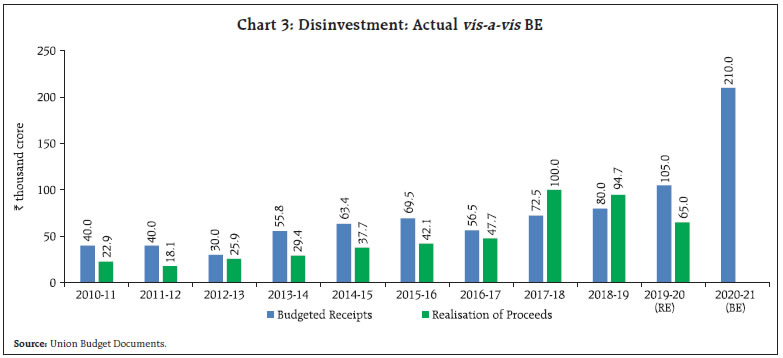
Non-debt Capital Receipts The target for disinvestment has been pegged at an all-time high of ₹2.1 lakh crore in 2020-21 (BE). In 2019-20 (RE), disinvestment proceeds fell short by 38 percent vis-a-vis the target of ₹1.05 lakh crore (Chart 3). In a historical perspective, shortfalls vis-à-vis budgeted targets in respect of disinvestment have occurred in eight out of last ten years, with 2017-18 and 2018-19 being the notable exceptions. Moreover, it is noteworthy to realise the growing importance of Exchange Traded Funds (ETFs) in disinvestment (Box I). Recoveries of loans and advances are budgeted to decline in 2020-21 (BE) by 9.9 per cent over 2019-20 (RE). Box I: Disinvestment through Exchange Traded Funds (ETFs) ETFs are bundles of securities that are traded, like individual stocks, on an exchange. Contrary to regular mutual funds, ETFs can be bought and sold throughout the trading day like any stock. ETFs usually track different asset classes, such as government bonds and corporate bonds, commodities including crude oil or gold, foreign currencies such as the Euro or Canadian dollar. For investors, ETFs are favoured investment avenues because (i) they are cost efficient (they don’t use services of star fund managers; in India, most ETFs charge annual expenses of 0.05 to 1 per cent of their Net Asset Value (NAV) whereas actively managed funds charge 2.5-3.25 per cent a year and Open-end index funds levy 0.20-2 per cent a year) (Prashanta and Raj, 2015); (ii) they enable investors to benefit from more informed security selection by the fund manager, while also offering them a diversified investment portfolio; (iii) they offer high liquidity through the exchanges; (iv) they are simple and convenient to buy/sell, given the initial investment is low. In recent years, Government of India has been pursuing the issue of ETFs as part of its broader disinvestment programme. The two ETFs launched under this initiative are: (a) CPSE ETF – which tracks shares of 11 Central Public Sector Enterprises (CPSEs) – Oil and Natural Gas Corporation (ONGC), National Thermal Power Corporation (NTPC), Coal India, Indian Oil Corporation (IOC), Rural Electrification Corporation (REC), Power Finance Corporation (PFC), Bharat Electronics, Oil India, NBCC India, NLC India and SJVN; and (b) Bharat-22 ETF – comprising National Aluminium Company (NALCO), ONGC, IOC, Bharat Petroleum, Coal India, State Bank of India (SBI), Axis Bank, Bank of Baroda, REC, PFC, Indian Bank, ITC, Larsen & Toubro, Bharat Electronics, Engineers India Limited, NBCC, Power Grid Corporation of India Ltd (PGCIL), NTPC, Gas Authority of India Limited (GAIL), National Hydro Power Corporation (NHPC), NLC, SJVN. Details of disinvestment achieved through ETFs starting from 2013-14 are as follows: | Table I.1: Share of ETFs in Disinvestment | | (₹ crore) | | Fiscal Year | ETFs | Total Disinvestment | Share of ETF in total disinvestment (per cent) | | CPSE ETF | Bharat 22 ETF | Total | | 1 | 2 | 3 | 4 | 5 | 6 | | 2013-14 | 3,000 | 0 | 3,000 | 29,368 | 10.2 | | 2014-15 | 0 | 0 | 0 | 37,737 | 0.0 | | 2015-16 | 0 | 0 | 0 | 42,132 | 0.0 | | 2016-17 | 8,500 | 0 | 8,500 | 47,743 | 17.8 | | 2017-18 | 0 | 14,500 | 14,500 | 1,00,045 | 14.5 | | 2018-19 | 26,350 | 18,730 | 45,080 | 94,727 | 47.6 | | 2019-20 | 26,500* | 4,369* | 30,869* | 65,000 | 47.5 | Note: * Data for 2019-20 is till February 24, 2020. Data in Column (5) is from Union Budget Documents.
Source: Department of Investment and Public Asset Management (DIPAM), Union Budget Documents. | Proceeds from the ETF route have formed an increasing portion of the aggregate disinvestment collections, as evident from Table I.1. In line with the disinvestment policy of the Government of India (as outlined by Department of Investment and Public Asset Management (DIPAM)) – namely, to promote public ownership of CPSEs – ETFs have emerged as the preferred vehicle for disinvestment by the government. Strategic disinvestment is an alternative mode of disinvestment. It implies the sale of substantial portion of the Government share-holding of a CPSE of up to 50 per cent, or even higher as may be determined, along with transfer of management control. During the time period since 2013-14, the government mobilised ₹10,779 crore in 2016-17, ₹42,469 crore in 2017-18 and ₹15,914 crore in 2018-19 through this route – accounting for 22.6 per cent, 42.5 per cent and 16.8 per cent of aggregate disinvestment proceeds, respectively. Reference: Prashanta, A. and Raj, K.K. (2015), “ETF vis-a-vis Index Funds: An Evaluation”, Asia Pacific Journal of Research in Business Management, Vol 20(1). | IV. Expenditure Pattern and Priorities Total expenditure is budgeted to grow by 12.7 per cent in 2020-21, lower than the rate of increase witnessed in 2019-20 (RE). Noteworthy from the point of view of reviving investment and growth is that capital expenditure is budgeted to grow by 18.1 percent, which is higher than the historical average of post-FRBM period (2004-05 to 2018-19) (Table 6). By contrast, revenue expenditure growth is projected to be moderate (relative to 2004-05 to 2018-19) which is indicative of the commitment of the government to improve the quality of expenditure as capital expenditure has higher multiplier effect than revenue expenditure (RBI, 2019)4. Subsidies and Interest Payments Expenditure on subsidies and interest payments is budgeted to come down to 37.8 per cent of revenue expenditure in 2019-20 (RE) and further to 36.9 per cent in 2020-21 (BE), which is its lowest level in the last twenty years. In 2019-20, interest payments declined from ₹6.60 lakh crore in BE to ₹6.25 lakh crore in RE, which may be reflective of the lower interest rate environment that prevailed during the year. Outgoes on account of subsidies also declined from 1.6 per cent of GDP in 2019-20 (BE) to 1.3 per cent in 2019-20 (RE) and has been budgeted even lower at 1.2 per cent in 2020-21 (BE). However, this has primarily been achieved by slashing on-budget expenditure on food subsidy from 0.9 per cent budgeted to 0.5 per cent of GDP in both 2019-20 (RE) as well as 2020-21 (BE). Despite this huge retrenchment, food subsidy continues to dominate the overall subsidy bill. | Table 6: Expenditure of Central Government | | Item | ₹ thousand crore | Growth rate (per cent) | | 2018-19 | 2019-20 (RE) | 2020-21 (BE) | 2019-20 (RE) | 2020-21 (BE) | | 1 | 2 | 3 | 4 | 5 | 6 | | 1. Total Expenditure | 2,315 | 2,699 | 3,042 | 16.6 | 12.7 | | 2. Revenue Expenditure | 2,007 | 2,350 | 2,630 | 17.0 | 11.9 | | (of which) | | | | | | | (i) Interest Payments | 583 | 625 | 708 | 7.3 | 13.3 | | (ii) Major Subsidies | 197 | 227 | 228 | 15.5 | 0.2 | | Food | 101 | 109 | 116 | 7.3 | 6.3 | | Fertiliser | 71 | 80 | 71 | 13.3 | -10.9 | | Petroleum | 25 | 39 | 41 | 55.3 | 6.1 | | (iii) MGNREGA | 62 | 71 | 62 | 14.9 | -13.4 | | (iv) PM-KISAN | 1 | 54 | 75 | - | 37.9 | | (v) Defence (Revenue) | 196 | 206 | 209 | 5.3 | 1.7 | | 3. Capital Expenditure | 308 | 349 | 412 | 13.4 | 18.1 | | Source: Union Budget Documents. |
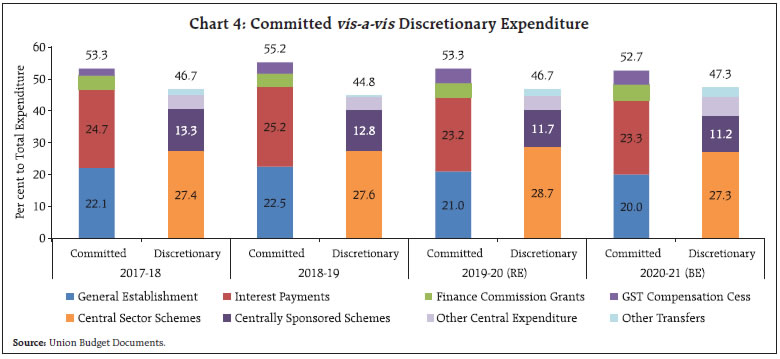
| Table 7: Expenditure on Major Government Schemes | | Item | ₹ thousand crore | Per cent of Total Expenditure | Growth Rate (per cent) | | 2018-19 | 2019-20 (BE) | 2019-20 (RE) | 2020-21 (BE) | 2019-20 (RE) | 2020-21 (BE) | 2019-20 (RE) | 2020-21 (BE) | | 1 | 2 | 3 | 4 | 5 | 6 | 7 | 8 | 9 | | A. Central Sector Schemes | | | | | | | | | | 1. PM-KISAN | 1 | 75 | 54 | 75 | 2.0 | 2.5 | - | 37.9 | | 2. Pradhan Mantri Shram Yogi Maandhan | 0 | 1 | 0 | 1 | 0.0 | 0.0 | - | - | | 3. Deen Dayal Upadhyaya Gram Jyoti Yojana | 4 | 4 | 4 | 5 | 0.2 | 0.1 | 7.0 | 10.7 | | 4. Ujjwala Yojana | 3 | 3 | 4 | 1 | 0.1 | 0.0 | 16.4 | -70.0 | | 5. Road Works | 38 | 46 | 46 | 49 | 1.7 | 1.6 | 21.4 | 6.3 | | 6. Sagarmala | 0 | 1 | 0 | 0 | 0.0 | 0.0 | 5.8 | -22.0 | | 7. National River Conservation Programme | 2 | 1 | 1 | 1 | 0.0 | 0.0 | -25.9 | -30.0 | | B. Centrally Sponsored Schemes | | | | | | | | | | 1. MGNREGA | 62 | 60 | 71 | 62 | 2.6 | 2.0 | 14.9 | -13.4 | | 2. Ayushman Bharat (PMJAY) | 2 | 7 | 3 | 6 | 0.1 | 0.2 | 49.0 | 94.0 | | 3. PM Krishi Sinchayi Yojana | 8 | 10 | 8 | 11 | 0.3 | 0.4 | -3.0 | 40.9 | | 4. PM Gram Sadak Yojana | 15 | 19 | 14 | 20 | 0.5 | 0.6 | -8.7 | 38.6 | | 5. PM Awas Yojana | 25 | 26 | 25 | 28 | 0.9 | 0.9 | -0.4 | 8.6 | | 6. Swachh Bharat Mission | 15 | 13 | 10 | 12 | 0.4 | 0.4 | -37.3 | 27.6 | | 7. National Health Mission | 32 | 34 | 34 | 34 | 1.3 | 1.1 | 8.9 | -0.5 | | 8. National Education Mission | 31 | 39 | 38 | 39 | 1.4 | 1.3 | 22.2 | 4.0 | | Source: Union Budget Documents. | In terms of allocations to major government schemes, the budgeted amount in 2020-21 remains the same for Pradhan Mantri Kisan Samman Nidhi (PMKISAN) and marginally higher for Mahatma Gandhi National Rural Employment Guarantee Act (MGNREGA) than in 2019-20 (BE) (Table 7). Both MGNREGA and PMKISAN are designed to directly increase the income of rural households and boost the rural economy. Committed vis-à-vis Discretionary Expenditure Total expenditure of the Union government can be decomposed into committed expenditure, which includes those expenses that the government must incur, viz., establishment expenditure (i.e. expenditure on salaries, wages, pensions and office expenses), interest payments, grants recommended by the Finance Commission and GST compensation to states, and discretionary expenditure which includes expenses over which the government enjoys certain discretion, viz., central sector schemes (which include all subsidies), centrally sponsored schemes and transfers to states (excluding Finance Commission grants and GST compensation). More than half of the total expenditure of the union government falls under the head of committed expenditure, consequently being difficult to contain (Chart 4). It is only the discretionary expenditure that the government may be able to rein in for the purpose of fiscal consolidation5. Capital Expenditure On top of an increase of 16.9 per cent during 2018-19, capital expenditure is budgeted to increase by 13.4 per cent in 2019-20 (RE) and further by 18.1 per cent in 2020-21. For major infrastructure, capital expenditure is estimated to grow by 22.4 per cent – led by communications sector which is budgeted to see over five-fold increase in allocation in 2020-21 (Table 8). This thrust on capital expenditure is in line with the vision outlined in the National Infrastructure Pipeline Report, which envisages an investment of ₹102 lakh crore in creating new and upgrading existing infrastructure which will hold the key to raising India’s competitiveness and achieving the target of a $5 trillion economy by 2024-25. The Union Budget 2020-21 has also made explicit provisions of ₹22,050 crore for projects coming under the National Infrastructure Pipeline. | Table 8: Capital Expenditure | | | ₹ thousand crore | Growth Rate (per cent) | | 2018-19 | 2019-20 (RE) | 2020-21 (BE) | 2018-19 | 2019-20 (RE) | 2020-21 (BE) | | 1 | 2 | 3 | 4 | 5 | 6 | 7 | | 1. Total Capital Expenditure | 308 | 349 | 412 | 16.9 | 13.4 | 18.1 | | 2. Defence | 95 | 110 | 114 | 5.3 | 15.9 | 3.0 | | 3. Capital Expenditure (excluding defence) | 212 | 239 | 298 | 23.0 | 12.3 | 25.1 | | (i) Major Infrastructure | 138 | 147 | 179 | 27.7 | 6.1 | 22.4 | | Irrigation | 0.3 | 0.3 | 0.3 | -3.4 | 0.0 | 24.0 | | Energy | 9 | 5 | 6 | 92.1 | -38.1 | 9.5 | | Indian Railways | 53 | 68 | 70 | 21.7 | 28.4 | 3.2 | | Roads & Bridges | 70 | 68 | 77 | 30.3 | -2.2 | 13.3 | | Civil Aviation | 4 | 0.03 | 0.03 | 116.5 | -99.4 | 3.8 | | Ports and Light Houses | 0.2 | 0.2 | 0.1 | 3.5 | 36.5 | -69.1 | | Communications | 3 | 5 | 26 | -43.0 | 83.1 | 450.3 | | (ii) Industry & Minerals | 5 | 7 | 7 | -4.1 | 40.6 | 5.0 | | (iii) Science, Technology and Environment | 7 | 9 | 10 | 35.8 | 27.7 | 9.5 | | (iv) Others | 62 | 76 | 101 | 15.0 | 21.9 | 34.2 | | Source: Union Budget Documents | V. GFD Financing Gross market borrowing through dated securities is budgeted at ₹7.8 lakh crore for 2020-21 as compared to ₹7.1 lakh crore in 2019-20 (RE). Despite the higher than budgeted fiscal deficit, the gross and net market borrowings for 2019-20 has been kept intact, as the entire additional borrowing requirement is being met from the National Small Savings Fund (NSSF). Recent years have witnessed a growing share of NSSF in Centre’s borrowing programme (Box II). Net market borrowings through dated securities will cover 68.4 per cent of GFD while that from NSSF will cover slightly over 30 per cent of the GFD in 2020-21 (BE) (Table 9). The Union Budget 2020-21 has budgeted for switches of securities of ₹2.7 lakh crore (gross amount) (₹1.7 lakh crore during 2019-20 (RE)) and buyback of securities of ₹30,000 crore for 2020-21. It has also provided for net short-term borrowings of ₹25,000 crore and issuance of cash management bills (CMBs) of ₹2.5 lakh crore. There is no allocation under the Market Stabilisation Scheme (MSS). The Government has also planned to raise a gross amount of ₹10,500 crore via Sovereign Gold Bonds (SGBs) in 2020-21. | Table 9: GFD Financing | | (₹ thousand crore) | | | 2018-19 | 2019-20 (BE) | 2019-20 (RE) | 2020-21 (BE) | | 1 | 2 | 3 | 4 | 5 | | Gross Fiscal Deficit | 649 | 704 | 767 | 796 | | | (100.0) | (100.0) | (100.0) | (100.0) | | Financed by | | | | | | Net Market Borrowings | 423 | 473 | 473 | 545 | | | (65.1) | (67.2) | (61.7) | (68.4) | | Net treasury bills | 7 | 25 | 25 | 25 | | | (1.1) | (3.6) | (3.3) | (3.1) | | NSSF | 125 | 130 | 240 | 240 | | | (19.2) | (18.5) | (31.3) | (30.1) | | External Assistance | 6 | -3 | 5 | 5 | | | (0.8) | -(0.4) | (0.6) | (0.6) | | State Provident Fund | 16 | 18 | 18 | 18 | | | (2.5) | (2.6) | (2.3) | (2.3) | | Reserve Fund | -18 | -1 | 0 | 3 | | | -(2.8) | -(0.1) | (0.0) | (0.4) | | Deposits and Advances | 66 | 14 | 33 | 36 | | | (10.2) | (1.9) | (4.3) | (4.5) | | Draw Down of Cash Balances | -1 | 51 | 0 | -53 | | | -(0.2) | (7.3) | (0.0) | -(6.7) | | Others | 27 | -3 | -27 | -22 | | | (4.1) | -(0.5) | -(3.6) | -(2.8) | | Memo Item | | | | | | Gross Market Borrowings | 571 | 710 | 710 | 780 | Notes: Net market borrowings include borrowings through dated securities only. Net treasury bills include borrowings through 91-day, 182-day, 364-day and all other treasury bills. Others include buyback of securities, switching off of securities, saving bonds, relief bonds, etc.
Figures in parenthesis represent percentages of GFD.
Source: Union Budget Documents. |
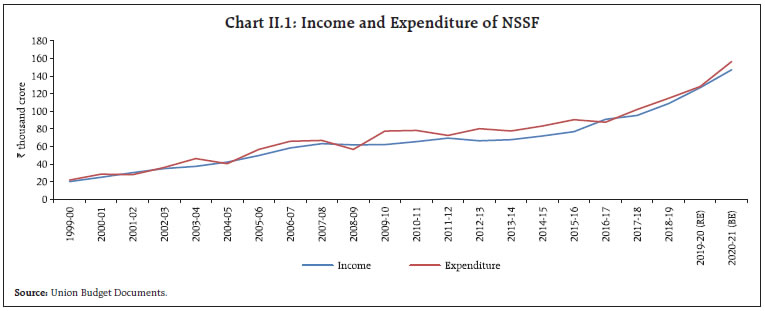
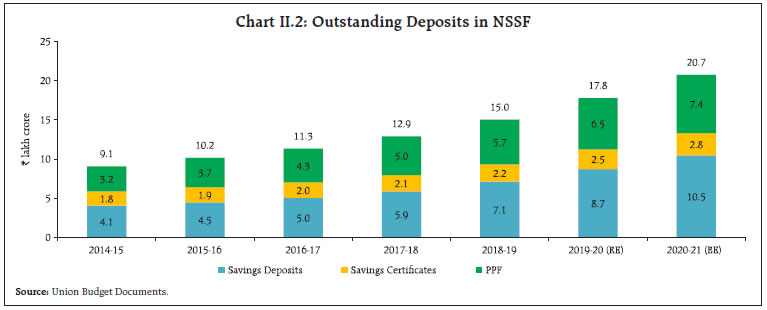
Box II: Growing Importance of National Small Savings Fund (NSSF) The NSSF is a fund created in the Public Account of India in which the proceeds of all small savings schemes, run by the government to promote financial savings, are accumulated. The receipts into NSSF come from three sources, viz., Post Office Savings Deposits, National Savings Certificates and Public Provident Fund. The funds collected in the NSSF are invested in special securities of Central and state governments. After the implementation of recommendations of the Fourteenth Finance Commission (FC - XIV), all state governments except Arunachal Pradesh, Delhi, Kerala and Madhya Pradesh have stopped borrowing from NSSF. The surplus funds, thus, available with the NSSF are being loaned out to the Public-Sector Undertakings (PSUs) like Food Corporation of India, Air India, National Highway Authority of India (NHAI) and Indian Railway Finance Corporation (IRFC), among others6. The NSSF, therefore, is essentially a financial intermediary which channelises the surplus funds of households to the public sector. In doing so, it earns income on the loans given to the government and PSUs and incurs costs on account of interest payments to depositors and management expenses, the difference being its operating profit/loss. An analysis of income and expenditure of the NSSF from 1999-00 (the year in which NSSF was first carved out in the Public Account of India) to 2018-19 (the latest year for which actual data is available) reveals that during this twenty-year period, the NSSF has achieved a surplus in only four years and the accumulated losses amount to ₹1.13 lakh crore as at end-March 2019, which is budgeted to increase to ₹1.24 lakh crore by end-March 2021 (Chart II.1). It is notable that the NSSF borrows and lends money at administered rates of interest. While the lending rates are fixed annually, deposit rates are reviewed quarterly and have been aligned to G-sec rates of similar maturities, with a certain amount of spread on certain small savings schemes.7 In 2018-19, the ratio of interest expenditure to total deposits of NSSF was 6.9, whereas the comparable figure for scheduled commercial banks was 4.8. It is due to this differential between rate of interest offered on small savings schemes and bank deposits that the total corpus of NSSF has seen a phenomenal growth since 2014-15 and is budgeted to more than double to ₹20.7 lakh crore in 2020-21 from ₹9.1 lakh crore in 2014-15 (Chart II.2, Annex II).
|
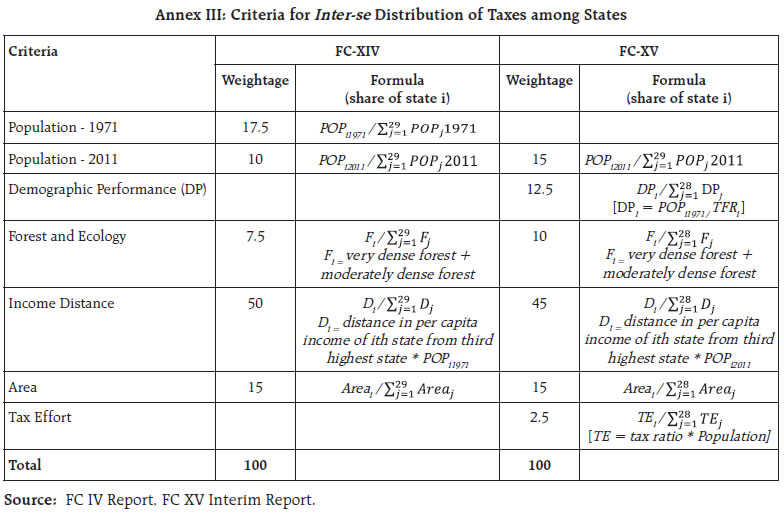
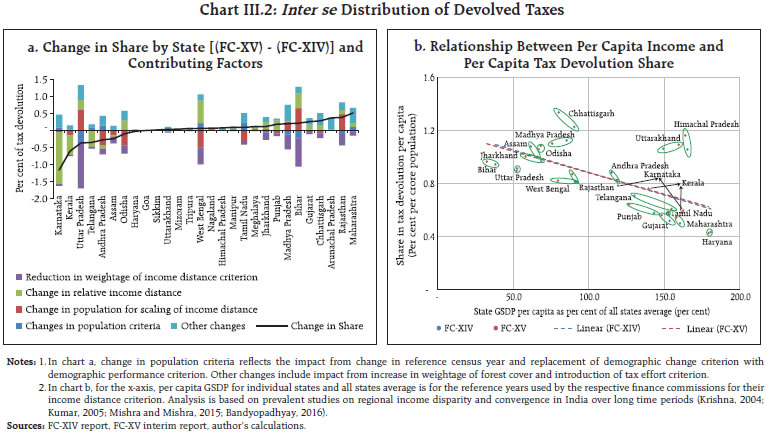
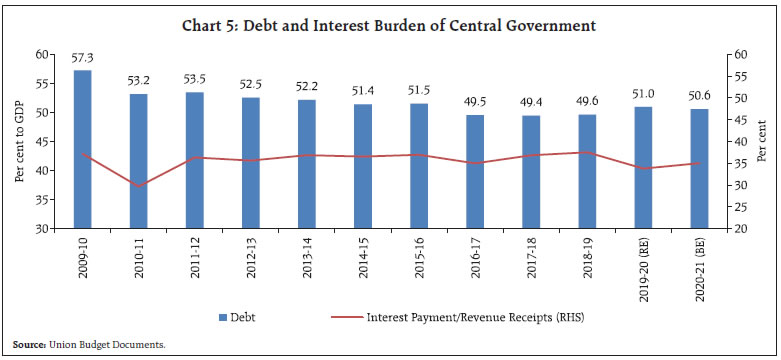 VI. Outstanding Liabilities Total outstanding liabilities of the Union government (including borrowings through extra budgetary resources) are budgeted to increase sharply to 51.0 per cent of GDP in 2019-20 (RE) and moderate slightly to 50.6 per cent in 2020-21 BE (Chart 5). The government has projected that the outstanding liabilities will contract to 45.5 per cent by 2022-23.8 It may be noted that as per the revised FRBM framework, the target is to reduce the outstanding liabilities of Union government to 40 per cent of GDP by 2024-25. VII. Resource Transfers from the Centre to States Resource transfers from the Centre to states declined in 2019-20 (RE) due to significantly lower tax devolution, which was partially offset by increase in other transfers. As per cent of GDP, gross transfers declined by 0.5 per cent during the year. Coupled with lower central tax collections, another main reason for the decline in tax devolution in the year is lower actual tax collections of Centre in the previous year viz., 2018-19 compared to revised estimates which has been adjusted in 2019-20 (RE) to the extent of about 30 basis points. In 2020-21, gross transfers are budgeted at 6.2 per cent of GDP, which represents a significant increase from 5.8 per cent in 2019-20 (RE). Tax devolution is as per the formula recommended by the Fifteenth Finance Commission in its interim report (Box III) and continues to be the mainstay of resources transferred from the Centre to states. Box III: Interim Report of the Fifteenth Finance Commission: A Reflection The Centre-state fiscal imbalance in India is sought to be corrected through a system of federal transfers from the Centre to states, which have principally been in the form of tax devolution and funding of centrally sponsored schemes since 2015-16. The Finance Commission (FC), a constitutional body under Article 280, is entrusted with determining the ratio of tax devolution and has thus come to play the pivotal role in Centre-state fiscal relations. Tax devolution as per cent of GDP has shown a significant increase in the period, attributable to the Fourteenth Finance Commission (FC-XIV), even though aggregate resource transfer has broadly remained stable (Chart III.1a). This stability has been attained by arresting the growth in tax devolution through an increase in Centre’s reliance on cesses and surcharges in tax collections that are outside the shareable pool of taxes (divisible pool) as per Article 271 of the constitution (Chart III.1b). Concurrently, tax collections as per cent of GDP for both Centre and states have stagnated since 2007-08, after registering robust increase between 2001-02 to 2007-08 (Chart III.1c). Another reality that institutions of federal fiscal polity in India are confronted with is a low intensity of tax to GDP in India vis-a-vis its peers (Chart III.1d). In this milieu, the interim report of the Fifteenth Finance Commission (FC-XV) was tabled in the Budget Session of the Parliament on February 1, 2020. Its recommendations have been largely accepted by the Central government and reflected in the Union Budget provisions of 2020-21. The tax devolution ratio is recommended at 41 per cent of the divisible pool for 2020-21, 1 per cent lower than the 42 per cent in 2015-20, the period corresponding to the FC-XIV. The reduction in the share of states is primarily because of elimination of the share which used to be allocated to the erstwhile state of Jammu and Kashmir (0.8 per cent of the divisible pool). 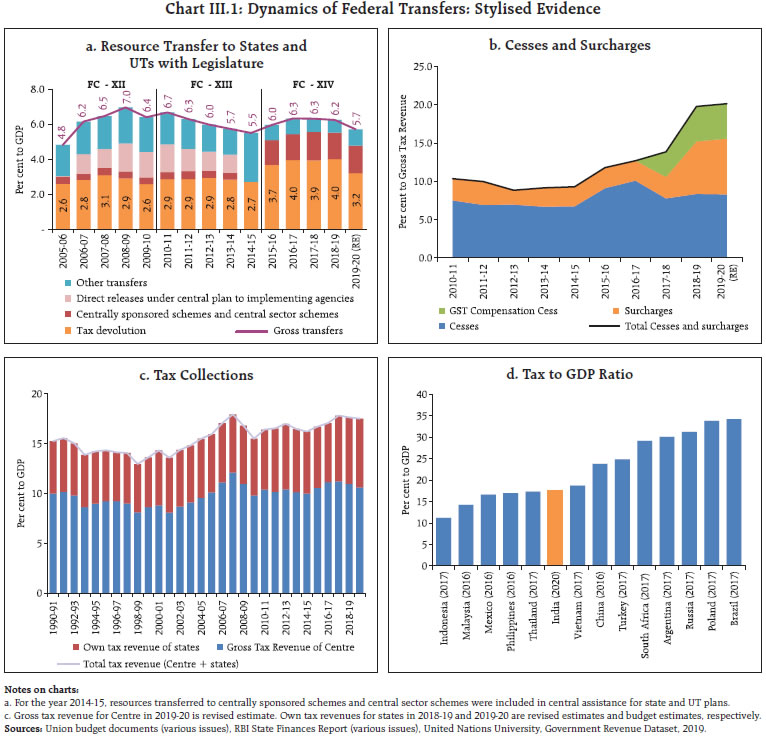 Other than tax devolution, the FC also recommends specific transfers to states in the form of grants under Article 280 of the constitution. The purpose of these grants has varied considerably over successive FCs, though the share of devolution to local bodies has increased considerably since the passage of the 73rd and 74th amendments to the constitution in 1992 that mandated federal transfers to local bodies. For 2020-21 as well, devolution to local bodies commands the major share in FC grants; the commission also recommended a significant increase in grants for bridging revenue deficit (Table III.1). The FC is also entrusted with determination of criteria and formula for inter se distribution of taxes among states, with the objective of enabling a minimum level of government services to all citizens while addressing states’ different revenue raising capacities owing to the disparity in their income levels. The FC-XV has made significant changes in the criteria and devolution share of individual states, primarily attributable to the change in population census year from 1971 to 2011. The change in population census is governed by the Terms of Reference (ToR) of the commission. Though the FC-XV tries to balance the loss in share for low population growth states due to the change in reference census by introducing a criterion for demographic performance9, population is also indirectly used as a criterion in scaling the income distance of a state and thus disadvantages those states that have achieved low growth rates in population (Chart III.2a). Other changes in criteria for inter se distribution include increase in weightage of forest cover (by 2.5 per cent), introduction of a new criterion for tax effort (2.5 per cent weightage) and reduction in weightage of income distance criteria by 5 per cent. On the whole, per capita share in tax devolution recommended by the FC-XV in its interim report are at the same level of progressivity as the FC-XIV (Chart III.2b and Annex III). | Table III.1: Finance Commission Grants | | (₹ crore) | | Name of grant | Union budget
2020-21 | FC-XV recommendation | | 2018-19 | 2019-20 (RE) | 2020-21 (BE) | 2020-21 | | Grants for local bodies - Rural | 35,064 | 58,616 | 69,925 | 60,750 | | Grants for local bodies - Urban | 14,400 | 25,843 | 30,000 | 29,250 | | Grants-in-Aid for State Disaster Relief Fund | 9,658 | 10,938 | 20,000 | 22,184 | | Post devolution revenue deficit bridging grants | 34,582 | 28,314 | 30,000 | 74,340 | | Special Grants | | | | 6,764 | | Sector-specific grants for nutrition | | | | 7,735 | | Total Finance Commission Grants | 93,704 | 1,23,710 | 1,49,925 | 2,01,023 |
 The full report of the FC-XV that will contain the recommendations on tax devolution and grants for the years 2021-22 to 2025-26 is to be submitted by October 30, 2020. In its full report, the FC-XV also envisages recommending sector-specific grants for health, pre-primary education, judiciary, rural connectivity, railways, statistics and police training and housing. Further, the commission is also evaluating the feasibility of recommending performance based grants to states in six areas: agriculture reforms; performance on Aspirational Districts Programme (ADP); power sector reforms; trade (exports); education; and tourism promotion. References: Bandopadhyay, S. (2016), “The persistence of inequality across Indian states”, CSAE Working Paper WPS/2016-26. Krishna, K.L. (2004), “Patterns and Determinants of Economic Growth in Indian States”, Working Paper No 144, Indian Council of Research on International Economic Relations. Kumar, T.R. (2005), “Tax Devolution and Regional Disparities”, Economic and Political Weekly, Vol. 40(20). Mishra, A. and Mishra, V. (2015), “Examining Income Convergence among Indian States: Time Series Evidence with Structural Breaks”, Discussion Paper 44/15, Monash Business School, Department of Economics. | The increase in Finance Commission grants in 2019-20 (RE) and 2020-21 (BE) is driven by higher grants for rural and urban local bodies. Transfers to Union Territories have increased in 2019-20 (RE) and 2020-21 (BE) due to the inclusion of transfers to the erstwhile state of Jammu and Kashmir within this head (Table 10). | Table 10: Gross and Net Transfers from Centre to States | | | ₹ thousand crore | Per cent of GDP | | 2017-18 | 2018-19 | 2019-20 (RE) | 2020-21 (BE) | 2017-18 | 2018-19 | 2019-20 (RE) | 2020-21 (BE) | | 1 | 2 | 3 | 4 | 5 | 6 | 7 | 8 | 9 | | 1. Devolution of States' Share in Taxes | 673.0 | 761.5 | 656.0 | 784.2 | 3.9 | 4.0 | 3.2 | 3.5 | | a. Tax devolution to states' as accrued during the year* | 697.6 | 678.0 | 714.9 | 784.2 | 4.1 | 3.6 | 3.5 | 3.5 | | b. States' share adjustment as per actual of previous year | 0.0 | 24.6 | -58.8 | 0.0 | 0.0 | 0.1 | -0.3 | 0.0 | | 2. Finance Commission Grants | 92.2 | 93.7 | 123.7 | 149.9 | 0.5 | 0.5 | 0.6 | 0.7 | | a. Grant for Rural Local Bodies | 34.4 | 35.1 | 58.6 | 69.9 | 0.2 | 0.2 | 0.3 | 0.3 | | b. Grants for urban local bodies | 12.6 | 14.4 | 25.8 | 30.0 | 0.1 | 0.1 | 0.1 | 0.1 | | c. Grants-in-aid for SDRF | 9.4 | 9.7 | 10.9 | 20.0 | 0.1 | 0.1 | 0.1 | 0.1 | | d. Post Devolution Revenue Deficit Grants | 35.8 | 34.6 | 28.3 | 30.0 | 0.2 | 0.2 | 0.1 | 0.1 | | 3. Scheme Related Transfers | 278.8 | 286.0 | 322.4 | 335.9 | 1.6 | 1.5 | 1.6 | 1.5 | | a. Under Centrally Sponsored Schemes | 262.0 | 271.5 | 283.1 | 295.3 | 1.5 | 1.4 | 1.4 | 1.3 | | b. Under Central Sector Schemes | 16.0 | 13.6 | 38.2 | 39.5 | 0.1 | 0.1 | 0.2 | 0.2 | | c. Other transfers | 0.8 | 0.9 | 1.2 | 1.2 | 0.0 | 0.0 | 0.0 | 0.0 | | 4. Some Important Items of Transfer | 37.2 | 46.2 | 57.3 | 73.3 | 0.2 | 0.2 | 0.3 | 0.3 | | a. Special Assistance | 7.0 | 4.7 | 4.0 | 15.0 | 0.0 | 0.0 | 0.0 | 0.1 | | b. Assistance to states from NDRF | 4.7 | 10.0 | 20.0 | 25.0 | 0.0 | 0.1 | 0.1 | 0.1 | | c. Externally aided projects-loans | 17.5 | 23.8 | 25.0 | 25.0 | 0.1 | 0.1 | 0.1 | 0.1 | | d. Other transfers | 8.1 | 7.8 | 8.3 | 8.3 | 0.0 | 0.0 | 0.0 | 0.0 | | 5. Transfers to Delhi, Puducherry and Jammu and Kashmir (since October 2019) | 3.8 | 8.0 | 28.4 | 47.4 | 0.0 | 0.0 | 0.1 | 0.2 | | 6. Gross Transfers to States and UTs (1 to 5) | 1,085.1 | 1,195.4 | 1,188.0 | 1,390.7 | 6.3 | 6.3 | 5.8 | 6.2 | | 7. Recovery of Loans and Advances | 13.1 | 14.4 | 14.2 | 12.5 | 0.1 | 0.1 | 0.1 | 0.1 | | 8. Net Resources transferred to States and UTs (6-7) | 1,072.0 | 1,181.0 | 1,173.8 | 1,378.2 | 6.3 | 6.2 | 5.7 | 6.1 | Note: * Tax devolution to states as accrued during the year = Tax devolution to states - States' share adjustment as per actual (accrued in the previous year) + Next year's states' share adjustment as per actual. For example, Tax accrued in 2018-19 = 761.5 - 24.6 + (-58.8).
Figures in columns might not add up to the total due to rounding off of numbers.
Source: Union Budget Documents | VIII. Conclusion The Union Budget 2020-21 aims at energising the Indian economy through a combination of short-term, medium-term, and long-term measures. The direct tax reforms, particularly the exemption from income tax is likely to boost purchasing power of the middle-income households. The abolition of dividend distribution tax, a long-standing demand of the industry, should work towards making India an attractive destination for investment. Overall, the budget is growth promoting and welfare enhancing within the envelope governed by fiscal prudence. The budget has also avoided cutting down capital expenditure to meet the fiscal deficit target in a year of subdued growth momentum in the economy, which is desirable. As regards the FRBM targets, the escape clause has been used for three successive years now – in 2018-19 and 2019-20 to allow the GST regime to stabilise in due course and in 2019-20 and 2020-21 to account for the revenue implications of lower corporate taxes which could make India globally more competitive and stimulate investment and growth in the medium-term. During the ensuing year, the economic developments especially against the backdrop of the COVID-19 pandemic and the evolving situation will be crucial in determining the fiscal performance of the country. Annex I: Budget Highlights: Measures Measures in the Budget 2020-21 pertaining to RBI: -
Deposit Insurance and Credit Guarantee Corporation (DICGC) permitted to increase deposit insurance coverage from ₹1 lakh to ₹5 lakh per depositor. -
Proposal to introduce governance reforms in PSBs so that they become more competitive. -
Proposal to strengthen cooperative banks through appropriate amendments to Banking Regulation Act for increasing professionalism, enabling access to capital and improving governance and oversight by RBI, apart from taking further steps to bring in transparency in Public Sector Banks (PSBs). -
Limit for NBFCs to be eligible for debt recovery under SARFAESI Act is proposed to be reduced from ₹500 crore to asset size of ₹100 crore or loan size from existing ₹1 crore to ₹50 lakh. -
Government has asked RBI to consider extension of window (which is slated to close on March 31, 2020) for restructuring of debt by MSMEs. -
A scheme will be devised to strengthen the Partial Credit Guarantee scheme for the NBFCs (that had been announced earlier). Government will guarantee securities thereby floated. -
Financial markets: o Certain specified categories of government securities would be opened fully for non-resident investors as well. o FPI Limit for corporate bonds, currently at 9 per cent of outstanding stock, to be increased to 15 per cent. Part I Theme A: Aspirational India in which all sections of the society seek better standards of living, with access to health, education and better jobs. 1. Agriculture, Irrigation and Rural Development -
PM KUSUM (Pradhan Mantri Kisan Urja Suraksha evem Utthan Mahabhiyan) to cover 20 lakh farmers for standalone solar pumps and an additional 15 lakh to be supported to solarise their grid connected pumps. -
Proposal for viability gap funding for creation of efficient, Warehouse Development and Regulatory Authority (WDRA) norms-compliant warehouses on PPP mode. -
SHG-run village storage scheme to be launched which will provide farmers a good holding capacity and reduce their logistics cost. Women, SHGs shall regain their position as “Dhaanya Lakshmi”. -
Integration of e-NWR (Negotiable Warehouse Receipts) with e-NAM (National Agricultural Market). -
“Kisan Rail” and “Krishi Udaan” to be launched by Indian Railways and Ministry of Civil Aviation respectively for a national cold supply chain for perishables. Express and freight trains shall have refrigerated coaches. -
In horticulture sector, for better marketing and export, it is proposed to support states which, adopting a cluster basis, will focus on “one product one district”. -
Integrated farming systems in rainfed areas is proposed to be expanded and national portal on organic products will be strengthened. -
Agricultural credit target of ₹15 lakh crore has been set for 2020-21. Fish production target of 200 lakh tonnes by 2022-23, in addition to promotion of growing of algae and sea weed and of cage culture. -
Proposal to involve youth in fishery through ‘Sagar Mitras’ and giving a fillip for creation of 500 fish Farmer Producer Organisations (FPOs). 2. Wellness, Water and Sanitation: -
Proposal to provide viability gap funding to set up hospitals under the PPP mode, starting with Aspirational districts that have no empanelled hospital under PMJAY (Pradhan Mantri Jan Arogya Yojana). -
Expansion of Jan Aushadhi Kendra Scheme to all districts by 2024. -
Commitment to ODF Plus to sustain ODF behaviour and to ensure comprehensive coverage across all sections of population. -
Focus on liquid and grey water management along with solid waste management. -
Thrust on million-plus cities meeting their targets under Jal Jeevan Mission (augmenting conventional and unconventional sources of water) on expedited basis. 3. Education and Skills -
New Education Policy to be announced soon. -
Steps would be taken to enable sourcing External Commercial Borrowings (ECBs) and FDI so as to able to deliver higher quality education through enhancement of physical and human capital. -
About 150 higher educational institutions will start apprenticeship-embedded courses by March 2021 to enhance employability of youth. -
Internship opportunities to fresh engineers for a period of up to one year by ULBs -
Initiation of degree level full-fledged online education programme by institutions within first 100 ranks of National Institutional Ranking Framework (NIRF). -
Ind-SAT to be conducted in Asia and Africa under Study in India programme. It shall be used for benchmarking foreign candidates who receive scholarships for studying in Indian higher education centres. -
It is proposed to attach a medical college to an existing district hospital in PPP mode. -
Special bridge courses to be designed by the Ministries of Health and Skill Development together with professional bodies to bring in equivalence with global standards, to facilitate Indian teachers, nurses, para-medical staff and care-givers in securing employment abroad. Theme B: Economic Development 1. Industry, Commerce and Investment -
National Technical Textiles Mission has been proposed for a period of 4 years from 2020-21 to 2023-24. -
NIRVIK Scheme for higher export credit disbursement to be launched which provides for higher insurance coverage, reduction in premium for small exporters and simplified procedure for claim settlements. -
Setting up of an Investment Clearance Cell, working through a portal, to provide end to end facilitation and support, including pre-investment advisory, information related to land banks and facilitate clearances at Centre and State level. -
Development of 5 new smart cities in collaboration with states on PPP basis. -
Scheme to be launched to encourage manufacture of mobile phones, electronic equipment, semi-conductor packaging, medical devices to leverage India’s cost competitiveness in electronics manufacturing. -
Emphasis to raise turnover on Government e-marketplace to ₹3 lakh crore, for maximising opportunities for MSMEs. 2.Infrastructure -
A project preparation facility is proposed to be setup for infrastructure projects. -
A National Logistics Policy will be launched soon to create a single window e-logistics market and focus on generation of employment, skills and making MSMEs competitive. -
Roads: Accelerated development of Highways will be undertaken, involving scaling up access control highways, economic corridors, strategic highways. -
Railways: Four station redevelopment projects and operation of 150 passenger trains through PPP mode. Creation of large solar power capacity in railway land alongside rail tracks. 148 km long Bengaluru Suburban transport project to be started with 20 per cent equity by Central government. -
Port: Government would consider corporatizing at least one major port and subsequently its listing on the stock exchanges. -
Air: 100 more airports to be developed under UDAN (Ude Desh ka Aam Naagrik /Regional Connectivity Scheme). -
Power: Efforts to replace conventional energy meters by prepaid smart meters. -
Gas Grid: Expand National Gas Grid from 16,200 km to 27,000 km 3. New Economy -
A policy to enable private sector to build Data Centre parks throughout the country to be rolled out soon, to enable dovetailing of data in every step of value chain. -
Fibre to the Home (FTTH) connections through Bharatnet will link 1,00,000 gram panchayats this year. -
National Mission on Quantum Technologies and applications with an outlay of ₹8,000 crore proposed. -
Knowledge Translation Clusters would be set up across different technology sectors including new and emerging areas. -
Special emphasis on early life funding to start ups, including a seed fund to support ideation and development of early stage Start-ups. Theme C: Caring Society 1. Women & Child, Social Welfare -
Consultation with and financial assistance to urban local bodies for adoption of suitable technologies identified to eliminate manual cleaning of sewer systems or septic tanks. -
A task force to be appointed to recommend regarding lowering Maternal Mortality Rate (MMR) and improving nutrition levels. -
Allocation of ₹85,000 crore, ₹53,700 crore and ₹9,500 crore respectively for benefit of SCs, STs and senior citizens and divyangjan. 2. Culture and Tourism -
Proposal to establish Indian Institute of Heritage and conservation under Ministry of Culture which shall have the status of a deemed University to start with. -
5 archaeological sites to be developed as iconic sites with on-site Museums. -
Tribal museum to be set up in Ranchi. -
Raft of measures announced to re-curate existing museums (such as Indian Museum in Kolkata) and establish new museums (such as maritime museum at Lothal) with a view to offering world class experience to tourists. 3. Environment and Climate Change -
Incentive-based scheme for encouragement to states implementing plans for cleaner air in cities with population above 1 million. -
For old and high carbon emitting power plants, it proposed that utilities running them would be advised to close them, if their emission is above the pre-set norms. The land so vacated can be put to alternative use. Two hands that will hold this bouquet consisting of three themes as mentioned above are Governance and Financial Sector. Governance -
Proposal for inclusion of tax payer charter in statute, with a view to ensuring that our citizens are free from harassment of any kind. -
For Companies Act, certain amendments are proposed to be made that will correct for criminal liability for acts that are civil in nature. -
It is proposed to set up a National Recruitment Agency (NRA) for recruitment to Non-Gazetted posts. A test-centre in every district, particularly in the Aspirational Districts would be set up. -
The proposed new National Policy on Official Statistics would use latest technology including AI to fulfil the growing need for the Indian Statistical system -
A sum of ₹100 crore is allocated to begin the preparations to host G 20 presidency in the year 2022. -
Firms in selected sectors such to be provided handholding support for technology upgradation, R&D, business strategy by a scheme worth ₹100 crore to be anchored by both SIDBI and EXIM Bank. -
Sums of ₹30,757 crore and ₹5,958 crore for supporting the all-round development of UTs of Jammu and Kashmir and Ladakh respectively. Financial Sector -
Proposal to sell balance holding of government in IDBI Bank to private, retail and institutional investors through the stock exchange. -
Proposal for separation of NPS Trust for government employees from PFRDAI. -
It is proposed to introduce a scheme to provide subordinated debt for entrepreneurs of MSMEs, which count as quasi-equity and be guaranteed by Credit Guarantee Fund Trust for Micro and Small Enterprises (CGTMSE). -
Proposal to launch new Debt-ETF consisting primarily of government securities to allow retail access to government securities. -
Proposed amendments to Factor Regulation Act 2011 to enable NBFCs to extend invoice financing to the MSMEs through Trade Receivables Discounting System (TReDS). -
With the approval of the regulator, GIFT City would set up an International Bullion exchange(s) in GIFT-IFSC as an additional option for trade by global market participants. -
The government has proposed to sell a part of its holding in LIC by way of Initial Public Offer (IPO). Part II: Tax Proposals A. Direct Tax -
Simplified and New Income tax regime. The new tax regime shall be optional for the taxpayers and bring significant relief. -
Dividend Distribution Tax (DDT) is abolished and classical system of dividend taxation adopted under which the companies would not be required to pay DDT. The dividend shall be taxed only in the hands of the recipients at their applicable rate. -
Concessional corporate tax rate of 15 per cent extended to new domestic companies engaged in the generation of electricity. -
Tax concession of 100 per cent on interest, dividend and capital gains income in respect of investment made in infrastructure and other notified sectors by sovereign wealth fund of foreign governments and other foreign investments in order to incentivise the investments in the above sectors. -
Tax benefits to start-ups by way of deduction of 100 per cent of their profits enhanced (by increasing turnover limit from ₹25 crore to ₹100 crore) and period of eligibility for claim of deduction increased from 7 years to 10 years considering starts-ups as engine of growth. Also, tax on Employee Stock Option Plan (ESOP) given to start-ups employees deferred by five years or till they leave the company or when they sell their shares, whichever is earliest. -
Concessional tax rate for cooperatives - cooperative societies to be taxed at 22 per cent plus 10 per cent surcharge and 4 per cent cess with no exemption/deductions against existing 30 per cent rate plus cess and surcharges. Cooperative societies also exempted from Alternate Minimum Tax (AMT). -
To further incentivise the affordable housing, extension of time limits pertaining to the tax benefits (additional deduction of up to ₹1,50,000 for interest paid on loans taken for purchase of an affordable house) for affordable housing for realisation of the goal of ‘Housing for All’. B. Indirect Tax -
Special attention to limit import of those items which are being produced by our MSMEs with better quality. Accordingly, customs duty is proposed to be raised on items like footwear and furniture. Customs duty rates are proposed to be revised on electric vehicles, and parts of mobiles as part of carefully conceived Phased Manufacturing Plans under Make in India initiative. C. Tax Administration -
Turnover threshold for audit (by accountant) of MSMEs increased from the existing ₹1 crore to ₹5 crore in order to reduce the compliance burden on small retailers, traders, shopkeepers. To boost less cash economy, increased limit apply only to those businesses which carry out less than 5 per cent of their transactions in cash. -
Issuance of Unique Registration Number to all charity institutions for easy tax compliance. -
Amendment of Income Tax act to enable faceless appeal in extension of faceless assessment. -
Initiation of scheme to launch a system under which PAN shall be instantly allotted online on the basis of Aadhaar without any requirement for filling up of detailed application form. -
Health cess to be imposed on imports of medical equipment. These proceeds to be used for creating infrastructure for health services in the aspirational districts. -
Mandate the CBDT to adopt a ‘Taxpayers’ Charter’ with the objective of enhancing the efficiency of the delivery system of the Income Tax Department. -
No Dispute but Trust Scheme - ‘Vivad Se Vishwas’ Scheme to reduce litigations in direct taxes. -
Simplified GST return shall be implemented from April 1, 2020. Refund process to be fully automated. Dynamic QR-code is proposed for consumer invoices. A system of cash reward is envisaged to incentivise customers to seek invoice. |
| Annex II | | Annual Flow of Funds Relating to NSSF (₹ crore) | | Year | Receipts | Disbursements | Net Accrual | Outstanding | | 1 | 2 | 3 | 4 (2-3) | 5 | | 2015-16 | 4,45,974 | 3,39,036 | 1,06,938 | 10,15,225 | | 2016-17 | 5,16,000 | 3,98,734 | 1,17,266 | 11,32,490 | | 2017-18 | 5,92,710 | 4,35,596 | 1,57,114 | 12,89,604 | | 2018-19 | 6,80,021 | 4,68,018 | 2,12,004 | 15,01,608 | | 2019-20 RE | 8,28,520 | 5,51,932 | 2,76,588 | 17,78,196 | | 2020-21 BE | 8,69,946 | 5,74,009 | 2,95,936 | 20,74,132 | | Source: Union Budget Documents. |
|
 IST,
IST,