 IST,
IST,


RBI WPS (DEPR): 08/2022: Towards Atma Nirbhar Bharat: An Exploration of Linkages and Leakages
| RBI Working Paper Series No. 08 Towards Atma Nirbhar Bharat: An Exploration of Linkages and Leakages Saurabh Sharma, Ipsita Padhi and Deba Prasad Rath@ Abstract * Countries across the globe have undertaken unprecedented fiscal actions in response to the COVID crisis. India has also announced several rounds of fiscal stimuli under the umbrella scheme of Atma Nirbhar Bharat mission. In this context, it is important that the policy interventions are aligned with the production structure of the economy so as to reap maximum benefits. This paper uses input-output analysis to identify the major sectors of the economy based on the sectoral multipliers. By taking into account the distinction between domestic and imported intermediates while computing the linkage measures, it ensures an accurate measurement of multipliers. The paper also investigates into ‘leakages’, i.e., the change in intermediate imports associated with a unit change in domestic production. The interaction between linkages and leakages is analysed, which reveals two distinct patterns – in the case of services, higher intermediate imports are associated with higher domestic linkages, while the opposite holds for the industry. The paper also identifies the sectors for export promotion and the sectors where domestic capabilities need to be developed for supply chain resilience. JEL Classification: C67, D57, F19 Keywords: Input-output analysis, sectoral multipliers, key sectors, leakages Introduction India, like many other countries across the globe, undertook unprecedented fiscal actions to support and revive the economy in the aftermath of the COVID-19 crisis. On May 12, 2020, four months into the COVID-19 pandemic, the Honourable Prime Minister of India gave a clarion call for ‘Atma Nirbhar Bharat’ or ‘Self-reliant India’. Focused on the five pillars of the economy, infrastructure, system, demography, and demand, the campaign envisioned to improve the efficiency of the sectors, enhance the quality of local products, promote ‘Make in India for the World’, and increase India’s role in the global supply chain. This vision of Atma Nirbharta/self-reliance has been the driving principle of the economic stimulus packages announced subsequently (Atma Nirbhar Bharat 1.0 – 3.0) as well as the measures announced in the Union Budget. In order to achieve the objective of Atma Nirbharta, however, it is important that the thrust of economic policy should be in sync with the economy’s production structure so as to benefit from the synergies thus created. Some of the questions that naturally arise while formulating policies for Atma Nirbharta include: (i) which are the key sectors of the economy that generate the highest multiplier effects?; (ii) exports from which sectors can generate maximum beneficial impact for the domestic economy?; (iii) what proportion of the increase in production in any sector benefits the domestic economy and what proportion gets ‘leaked’ out through imports?; (iv) which are the most crucial sectors of the economy whose disruption can have ramifications for the greatest number of sectors? Answering these questions is important to guide policy decisions and for realising the goal of attaining a US$ 5 trillion economy. In this paper, we seek to answer some of these questions through input-output (IO) analysis. The input-output tables provide a snapshot of the economic structure by capturing the flow of inputs between various sectors and are a useful tool for this kind of analysis. As a first step, we identify the key sectors of the economy, wherein any increase in final demand generates high multiplier effects on the economy. Since the government’s resources are limited, it is often not possible for fiscal interventions to be equally focused on all sectors of the economy. The identification of key sectors, therefore, becomes important as it enables policy action to be targeted to a few sectors that can generate maximum benefits for the entire economy. Taking a cue from Reis and Rua (2009), we also take into account the distinction between domestic and imported intermediates while computing the linkage measures. By doing so, we are able to overcome a major limitation of the earlier studies on this subject and ensure that the estimated multipliers do not over-estimate the domestic impact of a change in final demand. Apart from domestic linkages and multipliers, we also investigate the ‘leakages’, i.e., the change in intermediate imports associated with a unit change in domestic production (Guo and Planting, 2000). In an increasingly inter-connected world, the measurement of leakages becomes important as it enables us to study the impact of international trade on domestic inter-linkages, i.e., it permits us to investigate questions such as: does higher import dependence result in lower domestic linkages implying that imports are substituting for domestic production? Or is it that higher import intensities go hand-in-hand with higher domestic linkages suggesting that imported and domestic inputs are complements rather than substitutes? We may state at the outset that even when leakages are substituting for domestic linkages, it does not necessarily signal a problem. Such reallocation may improve the productivity of firms on account of access to new and technologically-advanced inputs that are not available domestically or may represent an integration into global value chains. The increase in leakages, however, becomes a case of concern when the imported intermediates are themselves labour-intensive (which is a comparative advantage for a labour abundant country like India) or if it is on account of supply constraints (infrastructure bottlenecks, erratic electricity supply, rigid labour laws, etc.) that makes domestic goods uncompetitive. Thus, a close examination of the relationship between linkages and leakages, and their underlying causes can ascertain the appropriate policy actions needed to make domestic goods internationally competitive. The main concepts analysed in the paper include backward and forward linkages and the spread of linkages. Further, the interaction between these measures and their relationship with export share, employment intensity, etc. are explored through graphical analysis in the paper, which adds new dimensions from a policy perspective. The paper is divided into six sections: Section II presents a brief review of the literature, Sections III and IV explain the methodology and the data used respectively, the results are presented in Section V, and Section VI concludes. Inspired by the pioneering work of Wassily Leontief on input-output analysis, and the seminal works of Chenery and Watanabe (1958) and Rasmussen (1956) on establishing linkage measures, the input-output tables have emerged as a major tool to assess structural changes in the economy based on the inter-linkages between sectors. Accordingly, a growing body of literature has developed in the area covering both theoretical and empirical aspects (Jones, 1976; Cella, 1984; Clements, 1990; Dietzenbacher, 1992). Input-output analysis has also been used to study the linkages of specific sectors. For example, the linkages of the construction sector with other sectors were analysed for a number of countries by Polenske and Sivitanides (1990). The linkages in the construction sector were also investigated specifically in the case of Sri Lanka by Rameezdeen et al. (2008). Xiaoming (1997) assessed the inter-industrial effects of labour productivity in China based on Leontief’s input-output framework. In recent years, the input-output framework has been used widely for the analysis of global value chains, facilitated by the development of global input-output tables (Ahmad, 2019). For example, Ming et al. (2015) investigated several conceptual value chains based on an inter-country input-output model, which provides an understanding of the roles played by different industries and countries in global value chains. Kidder and Dollar (2018) used global input-output data to construct an average measure of value chain length and found that the value chain length affects the skill composition of the work-force. While value chain length is found to have positive effects on high and medium skilled labour, it has an adverse effect on the low-skilled labour share. The input-output framework has also been used to compute the impact of trade on labour markets. Feenstra and Sasahara (2017) found that trade led to a rise in net labour demand in the US economy from 1995 to 2011, mostly on account of an increase in services exports. Other studies have explored the effect of Chinese import competition on US labour market outcomes (Acemoglu et al., 2016) and obtained elasticity of employment to regional and sectoral productivity changes (Caliendo et al., 2018) by taking into account input-output linkages. Input-output tables have also been used to compute the job content of exports in the case of developing countries (Hollweg, 2017). In the Indian context, several papers have used input-output analysis to investigate various aspects of the economy. The sustainability of service-led growth for the Indian economy was analysed based on the inter-sectoral linkages by Hansda (2001). Sastry et al. (2003) examined the linkages between agriculture, industry, and services using an input-output and simultaneous equation framework and found that agriculture played an important role in determining the growth rate of the economy through demand linkages with other sectors. Kaur et al. (2009) used input-output analysis together with a co-integration approach to identify growth impulses and concluded that stronger services growth vis-à-vis other sectors is not desirable and called for enhanced growth synergies among other sectors. Within the services sector, the backward and forward linkages of the information technology sector were studied by Khan (2010). Using input-output framework, Saikia (2011) observed strong inter-dependence between industry and service sectors, which improved post the 1991 reforms. Input-output analysis was also used by Bhattacharya and Rajeev (2013) for the identification of high linkage sectors. A limitation of the existing works on India till recently was that they haven’t distinguished between domestic and imported inputs, which is crucial for accurate measurement of domestic linkages and multipliers. The inadequacy stemmed from the fact that they were based on the input-output tables published by the National Statistical Office (NSO), which does not provide a separate matrix of imports. Since imported inputs are a “leakage” from the domestic economy, only the domestically supplied inputs should be used to assess the domestic inter-linkages. Ignoring this distinction leads to an over-estimation of the multiplier effects of the sectors (Dietzenbacher et al., 2005). More recently, a few studies have considered this distinction and used a proportionality assumption to separate domestic and imported inputs from the NSO IO tables/supply-use tables. These include Bhattacharya and Rajeev (2014) and Veeramani and Dhir (2019). Recognising that a highly linked sector may also be import intensive, Bhattacharya and Rajeev (2014) used an import-adjusted domestically produced input based matrix to identify the high linked sectors within the domestic economy. Veeramani and Dhir (2019) obtained and analysed the time series estimates of domestic value added content of India’s exports by using a proportionality assumption to distinguish between domestic and imported inputs. In our case, we use the IO tables from the World IO database to address this issue as it clearly distinguishes between domestically produced inputs and imported inputs. We follow Reis and Rua (2009)’s approach, which is useful for our purpose as it provides an accurate measurement of domestic linkages by recognising the distinction between imported and domestically supplied inputs and studies the interaction between domestic linkages and leakages resulting from international trade. III.1 A Non-technical Explanation of the Key Concepts Two types of economic linkages exist in the IO framework – backward linkages and forward linkages. An increase in output of sector i results in increased demand for the sectors whose products are used as inputs in sector i. This demand relationship is termed as backward linkage. At the same time, the increase in output in sector i also implies that a higher amount of product i is available for use as inputs in other sectors. This supply relationship is known as forward linkage (Miller and Blair, 2009). A sector may be linked with another sector directly (direct linkage) or indirectly through some other sectors (indirect linkage). The total linkage includes direct as well as indirect linkages (Chart 1). 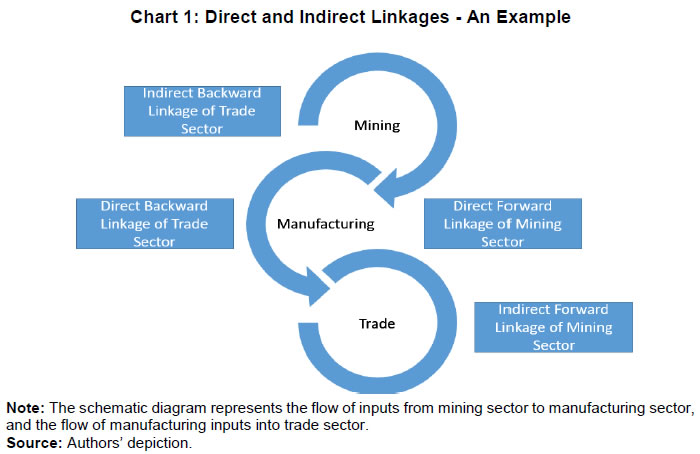 The analysis of the forward and backward linkages enables us to identify the key/crucial sectors of the economy. A sector with high backward linkages can be considered an important sector since any increase in production of this sector would generate substantial multiplier effects on the economy through increased demand for products from other sectors. A sector with high forward linkages can also be considered a crucial sector such that an increase in production in such sectors would lead to an increased supply of inputs to a number of sectors but may not naturally translate into higher production. However, any decrease in output in such a sector, would reduce the availability of inputs to a number of sectors and disrupt the production process. In addition to the total backward or forward linkages, another dimension that assumes significance is how spread out the effects of a sector are over the rest of the economy, which is measured by the coefficient of variation. A higher coefficient of variation (CV) of a sector means that the effect of a sector is limited to a few sectors only, while a lower coefficient of variation suggests that the sector’s impact is spread out over a number of sectors. A natural corollary of linkages in an open economy is to consider the “leakages”. A sector, which uses a considerable amount of imported goods (directly or indirectly), is said to have a high backward leakage. Any exogenous increase in production of such a sector would result in relatively higher import demand, resulting in a relatively lower value of domestic output multiplier1 and, therefore, represents an economic leakage to the multiplier effect. A sector with high forward leakages, on the other hand, is one where any disruption in production can adversely impact the supply of total imported intermediates to all sectors (Reis and Rua, 2009). Thus, forward leakage is a measure of the criticality of a sector in terms of the supply of imports to different sectors. The computation of these measures, as delineated by Reis and Rua (2009), is explained in the following sub-section. III.2 Computation of Linkages and Leakages III.2.1 Backward Linkages, Output Multipliers and Backward Leakages The concept of multipliers is based on the difference between the initial effect of an exogenous change and the total effect (direct and indirect) of that change. The output multiplier for a sector j is defined as the total value of production in all sectors of the economy which is required to satisfy a rupee’s worth of final demand for sector j's output. From the demand side, output of any sector is used to satisfy two kinds of demand: intermediate and final demand. As a result, for any sector i,   III.2.2 Forward Linkages, Input Multipliers, and Forward Leakages From the supply-side perspective, the production of output in a sector requires primary inputs from other sectors. As a result, for any sector j,   III.2.3 Coefficient of Backward and Forward Variation The coefficient of variation (CV) is a measure of dispersion that can be used to assess how spread the effects are across the economy associated with individual sectors (Boucher, 1976). The backward CV of a sector is calculated as follows:   The World Input Output Database (WIOD) provides annual national tables for the period: 2000 to 2014. For our analysis, we consider the years: 2000, 20072 and 2014. These IO tables allow us to dissect the economy effectively3 into 45 sectors and as stated earlier, provide matrices for both domestic and imported intermediates separately. The sectors considered are listed in Table A1. The results are explained in three sub-sections. The first sub-section gives a broad overview at the agriculture-industry-service level, without diving deeper into the individual sectors. The second sub-section explores the inter-linkages among the 45 sectors and discusses its policy implications. The last section focuses on the identification of leakages. V.1 Overview of the Economic Structure As a corollary of the ongoing structural transformation, the share of agriculture in gross output has been gradually decreasing, the share of industry has been broadly maintained, and the share of services has increased between 2000 and 2014 (Table 1). In 2014, within services, construction has the highest share in output at close to 10 per cent and within the industry, manufacture of food products has the highest share of 5 per cent in gross output (Table A2). While the service sector has a higher share in output compared to industry, it has a lower share in exports (Table 2). From 2000 to 2007, industry’s share in exports had declined while the service sector’s share had increased, leading to an almost equal share of industry and services in total exports in 2007. This trend, however, reversed post 2007, with the industry sector accounting for the largest share in exports as of 2014.
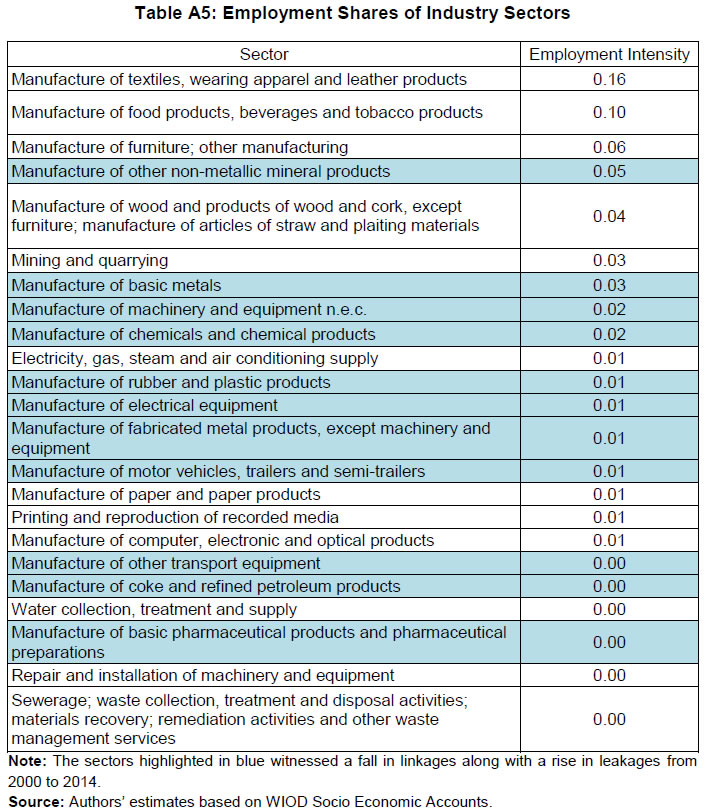
The industry sector also has the highest share in imports (both imported intermediates and final goods), which has increased over time. In contrast, services’ share in imports has been decreasing over time (Table 3). V.2 Identification of Key/Crucial Sectors In this sub-section, the key/crucial sectors of the economy are identified based on a sector’s linkages and coefficient of variation/spread. The first part (Section V.2.1) identifies the ‘key’ sectors based on the backward linkages, the second part (Section V.2.2) determines the ‘crucial’ sectors on the basis of forward linkages, and the last part (Section V.2.3) summarises the findings of the two sections and discusses its implications. V.2.1 Backward Linkages and Backward Coefficient of Variation The industry sectors show the highest backward linkages, with the manufacture of food products generating the highest output multiplier of 2.29 (Table 4). Manufacture of food products, thus, emerges as a key sector with a high share in gross output (5 per cent) and substantial multiplier effects on the domestic economy. Additionally, the labour-intensive nature of this sector implies that it has the potential to employ the work-force effectively4. In this regard, government initiatives to increase food processing capacities under Operation Greens5, the scheme for formalisation of Micro Food Enterprises6, and the production-linked incentive (PLI) scheme for food products can promote growth in food businesses and generate sizeable multiplier effects for the economy. Other sectors with high output multipliers include the manufacture of rubber and plastic products, manufacture of motor vehicles, manufacture of textiles, printing and reproduction of recorded media, manufacture of furniture, and manufacture of pharmaceutical products. Of these, automobiles, textiles, and pharmaceutical drugs have been included in the PLI scheme to enhance India’s manufacturing capabilities7. Increased production in these sectors can create substantial ripple effects in the economy. The output multipliers in the manufacture of furniture and printing and reproduction of recorded media are not only among the highest but have also recorded a maximum increase between 2000 and 2014, reflecting the dynamism in these sectors. In contrast, the output multipliers for the manufacture of coke and petroleum products, electricity and air conditioning supply, and manufacture of other transport equipment have decreased between 2000 and 2014. The service sectors with high output multipliers include accommodation and food services, construction, and land transport services (Table 4). Among the three, construction and land transport services also have a high share in gross output of 10 per cent and 7 per cent, respectively and have high employment shares (Tables A2 and A3). Government initiatives in these key sectors, therefore, have the ability to generate sizeable benefits for the economy. The government had announced an additional outlay for PM Awaas Yojana – Urban, and an extension of the Credit Linked Subsidy Scheme for Middle Income Group in the housing sector under the Atma Nirbhar Bharat Abhiyaan. The focus on the housing sector, combined with the thrust on infrastructure creation in Budgets 2021-22 and 2022-23 is expected to give a fillip to the construction sector. The capital spending envisaged in the budget would, thus, generate significant multiplier effects even in the short-term, while also crowding-in private investment in the medium term. 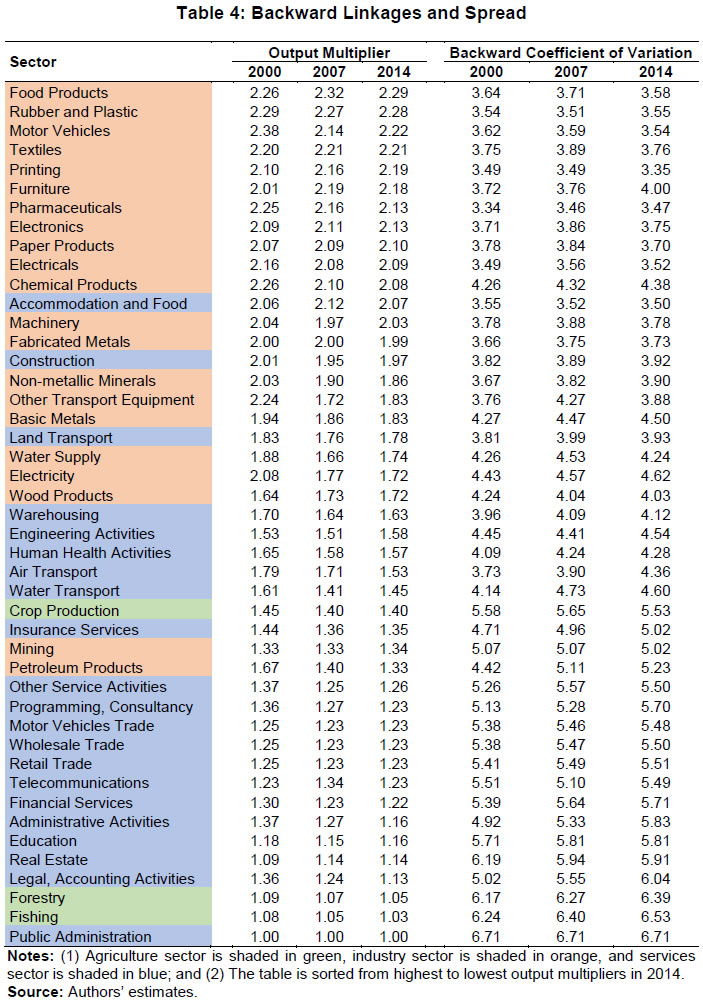 The sectors with the lowest output multipliers8 include public administration, fishing, and forestry. While the backward linkages present information on the total multiplier impact on the economy, the extent of the spread of these effects is captured by the backward CV. As discussed before, a higher CV implies that the effects are more concentrated in a few sectors and a lower CV suggests that the effects are more spread out across the sectors. Several sectors with high output multipliers also have lower CV (or higher spread). These include the manufacture of pharmaceutical products, printing and reproduction of recorded media, accommodation and food service activities, manufacture of motor vehicles, and manufacture of rubber and plastic products. This suggests that these key sectors source inputs from a wide variety of other sectors and an increase in production in these sectors would enhance production in a maximum number of sectors. In fact, a scatter plot of backward linkages and CV shows that the two share a negative relationship, i.e., the multiplier effect is higher when the linkages are more spread out across the economy (Chart 2). 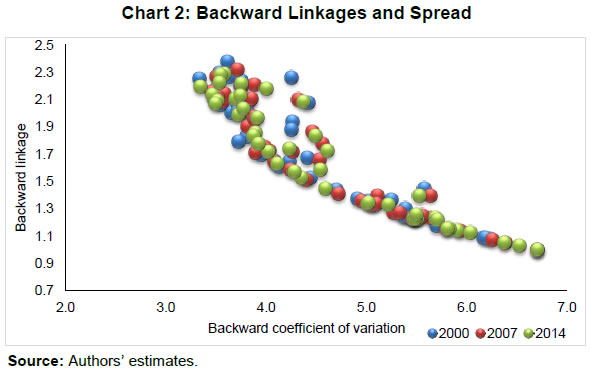 V.2.2 Forward Linkages and Forward Coefficient of Variation The input multipliers show the importance of a particular sector in the production process in the sense that they measure the extent to which a decrease in the output of a particular sector will reduce the availability of inputs for all other sectors, thereby affecting their production. Like in the case of backward linkages, industrial sectors on an average, show a higher degree of forward linkage compared to service sectors. But the divergence between industry and services is smaller in the case of forward linkages. Mining and quarrying, electricity and air conditioning supply, and manufacture of chemical products emerge as the sectors with the highest input multipliers (Table 5). Of these, mining and quarrying, and electricity and air-conditioning supply also report the lowest coefficient of variation in 2014 suggesting that these sectors not only supply the maximum inputs in value terms, but they supply these inputs to a wide variety of sectors. This shows the criticality of these sectors in the production process, as any disturbance in these sectors will have implications for a large part of the economy. 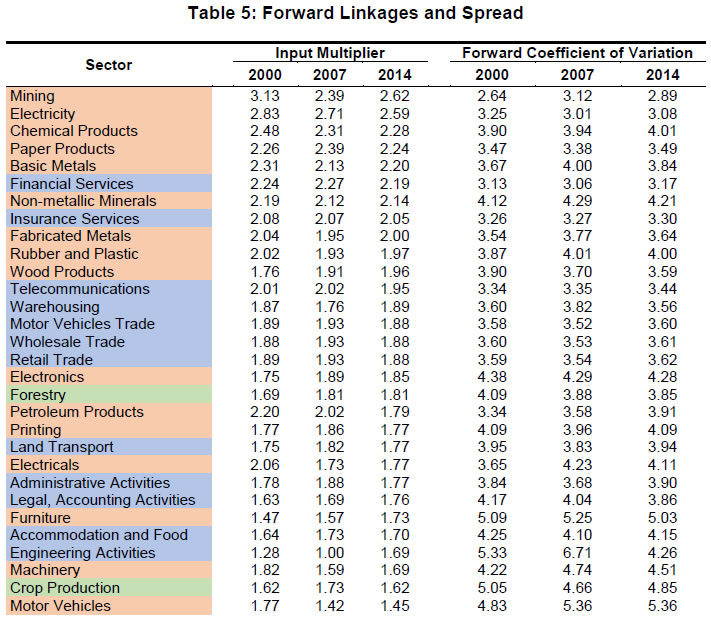 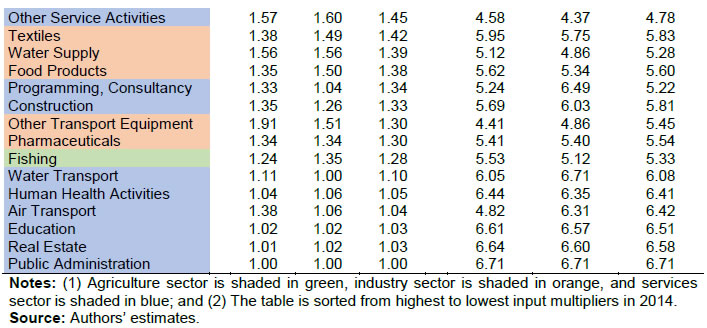 Services with high input multipliers include financial services, insurance services, and telecommunications. Again, these sectors also have a low CV or higher spread, reflecting that the inputs from these sectors are used in a wide variety of other sectors. A scatter-plot of forward linkages and CV shows a stark negative relationship suggesting that higher multipliers are generally associated with a greater spread of linkages (Chart 3). 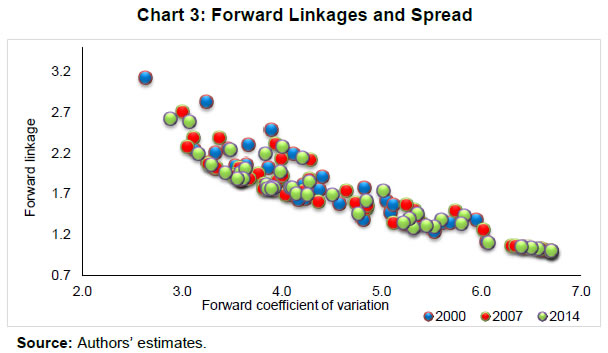 The sectors which have shown the maximum increase in input multipliers from 2000 to 2014 include architectural and engineering activities and manufacture of furniture, reflecting the rising importance of these sectors in the production process. V.2.3 Summary and Implications The afore-mentioned analysis suggests that key sectors with high backward linkages and higher spread of linkages include manufacture of food products, rubber and plastic products, motor vehicles, textiles, electrical equipment, printing and reproduction of recorded media, pharmaceutical products, accommodation and food service activities, construction, and land transport services. Government policies should focus on increasing production in these sectors, as it would generate the highest output multipliers for the economy. One way of doing so is by promoting exports in these key sectors. As per the most recent data, only some sectors like manufacture of textiles, food products, motor vehicles etc. seem to be associated with higher exports as well as high domestic multipliers (Chart 4). Promotion of exports in other sectors with high output multipliers but low export share currently (quadrant 2 of Chart 4) such as manufacture of rubber and plastic products, computer, electronic, and optical products, etc. could be beneficial for the domestic economy.  While aligning government policies with the multiplier impact of sectors could be key to transforming the domestic economy, a caveat is in order here. The estimated multipliers capture only the spending effect and do not consider the socio-economic implications of the higher spending. For example, education has a low output multiplier but investments in education have the potential to improve medium-term growth by improving labour productivity. Similarly, the estimated multipliers in the construction sector, while already among the highest, could still be an under-estimate. To the extent that construction aids the creation of infrastructure projects, it can reduce logistics costs, improve business competitiveness, and crowd in private investment leading to substantially higher multiplier effects in the medium term. Thus, the estimated multipliers are essentially short-run and do not take into account the medium-term implications of such spending. Turning to the sectors with high forward linkages and spread of linkages, mining activities, electricity supply, paper products, financial services, insurance services, and telecommunications emerge as the most crucial sectors. Since any disruption in these sectors can have substantial adverse effects on the entire economy, government actions must be focused on ensuring the smooth functioning of these sectors. The sectors with high forward as well as backward linkages are the manufacture of rubber and plastic products, chemicals, fabricated metal products, and paper and paper products (Chart 5). These sectors are doubly important as they supply inputs to a large number of sectors along with sourcing inputs from a large number of sectors. 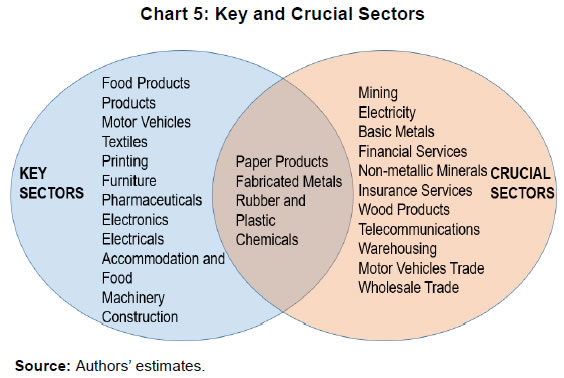 V.3 Identification of Leakages After analysing the key sectors of the economy based on linkages, we turn to the identification of the sectors with the highest backward and forward leakages in this sub-section. A sector is said to have a high backward leakage if its production is highly import-intensive. Any increase in production in such a sector would lead to a high import demand and represents leakage from the domestic multiplier in that sense. Sectors that appear to be more import-intensive include, manufacture of petroleum products, basic metals, other transport equipment, fabricated metals, chemical products etc. recording high backward leakage ratios (Table 6). Moreover, the import intensity has increased over time in the manufacture of petroleum products and the manufacture of basic metals, as reflected in the increase in backward leakages between 2000 and 2014. The services with high backward leakage ratios include land transport services, water transport, and construction. 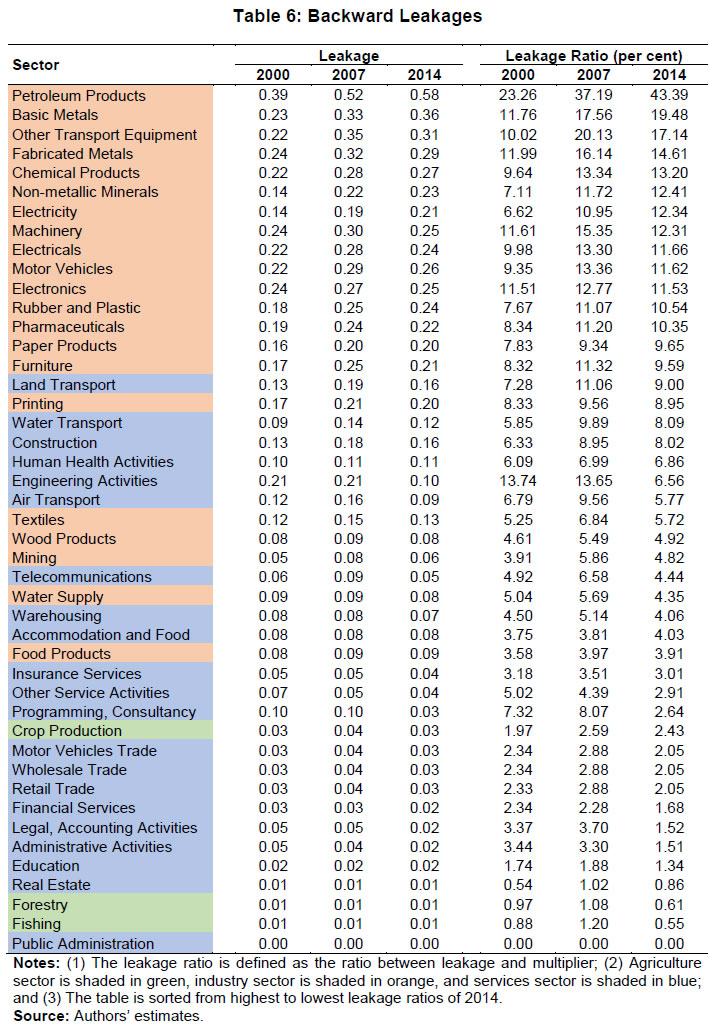 The identification of leakages is important for a number of reasons. Firstly, an analysis of the relationship of leakages with linkages enables us to infer the impact of international trade on the domestic economy. For example, a higher dependence on imported inputs may result in lower domestic linkages. Per contra, it is also possible that higher import intensities go hand-in-hand with higher domestic linkages, suggesting a healthy dependence on intermediate imports for what cannot be competitively produced domestically. To investigate this aspect, backward leakages are plotted against backward linkages for both industry and service sectors for the three years, i.e., 2000, 2007 and 2014. The scatter-plot for the industry sector reveals a gradual change in the relationship over the years (Chart 6a). In 2000, while no clear relationship is directly visible between linkages and leakages, the correlation between the two works out to 0.18 indicating a slight positive association. In 2007 and 2014, a somewhat inverse relationship between linkages and leakages is visible, with a correlation of -0.10 and -0.22, respectively. Further investigation reveals that 12 of the 21 industry sectors witnessed an increase in leakages along with a decrease in linkages between 2000 and 2014, while only 8 sectors witnessed a simultaneous increase in both linkages and leakages over the same period. This suggests that higher foreign dependence is generally associated with lower domestic synergies in the industry sector as domestic inputs are substituted for imported inputs. It may, however, be noted that this substitution does not necessarily signal a problem. Such reallocation may improve the productivity of firms on account of access to new and technologically-advanced inputs that are not available domestically. An increase in firm productivity and gains from trade through the import channel has been documented in a number of studies (Goldberg et al., 2010, Das, 2016, Rijesh, 2019). At the same time, the import penetration may also have a detrimental effect on employment creation (Nambiar et al., 1999; Sasidharan and Natarajan, 2015)9. Also, to the extent that the domestic firms are unable to compete with imported goods on account of supply constraints (infrastructure bottlenecks, erratic electricity supply, rigid labour laws, etc.) rather than lack of technical know-how, appropriate policy actions are needed to make domestic goods internationally competitive. In contrast to the observed relationship in the industry sector, a positive relationship between backward linkages and backward leakages is detected in the services sector, i.e., sectors which source more domestic inputs, are also sourcing more of imported intermediates (Chart 6b). This suggests that imported and domestic inputs are complements rather than substitutes for the services sector. Further, a comparison of the linkage-leakage relationship seen in industry and services suggests that domestic sourcing of inputs is declining for the industry relative to the services, which may reflect the effect of services-led growth, which the economy has witnessed in the last two decades. 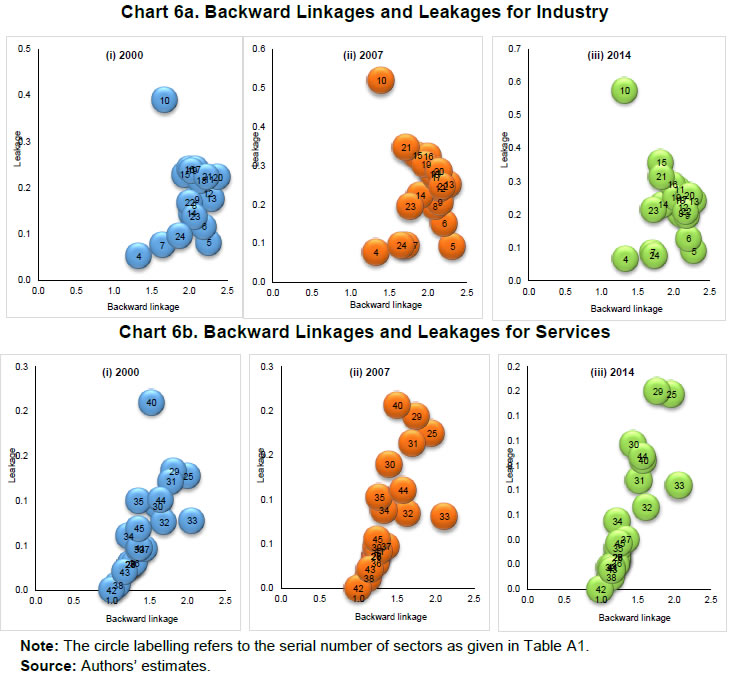 Secondly, identifying backward leakages is important as high backward leakages in a crucial sector (a sector with high forward linkages) can make the domestic economy vulnerable to external shocks. Some amount of backward leakage is not only inevitable but also desirable as a country cannot possibly produce all its products domestically – moreover, countries can gain by producing according to their comparative advantage. Backward leakages, however, could be a case of concern in the crucial sectors. If a crucial sector that supplies inputs to a number of domestic sectors is highly import-intensive, then any disruption in imported intermediates to the sector will have ramifications for the entire economy. In such cases, it may be advisable to bolster domestic capability in the inputs used in these sectors and diversify existing imports of inputs among a number of countries to reduce vulnerability to external shocks. A scatter-plot of backward leakages with forward linkages reveals that such sectors include manufacture of basic metals, fabricated metals, chemicals, non-metallic minerals etc. (Chart 7). 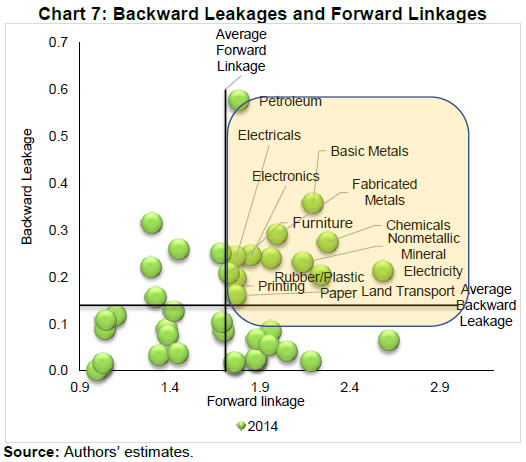 Thirdly, the identification of forward leakages is important as any disruption in these sectors can affect the supply of imported intermediates to the entire economy. The highest forward leakage ratios are observed both in industry – mining and quarrying, manufacture of other transport equipment, manufacture of chemical products, and in services – air transport, water transport, and legal and accounting services (Table 7). 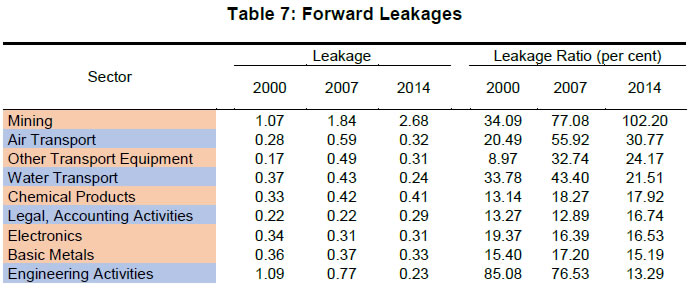 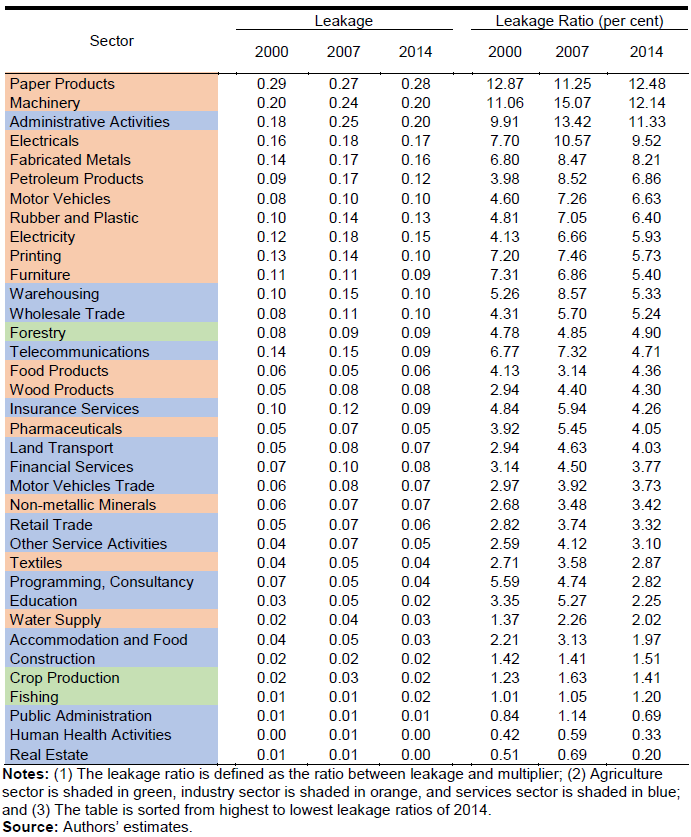 Any interruption in production in these sectors can affect the supply of imported intermediates to the entire economy and could be particularly detrimental to import-intensive sectors (sectors with high backward leakages). Further, there does not appear to be a clear relationship between forward linkages and forward leakages for either industry or services sector (Chart 8). A sector that is a key supplier of domestic inputs may or may not significantly impact the supply of imported inputs. 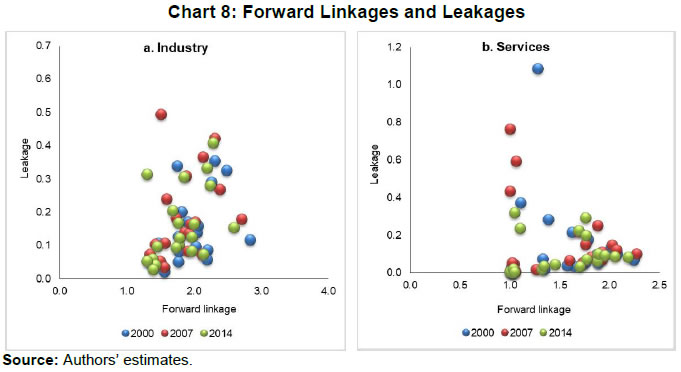 Finally, the determination of leakages is important as it gives us information about the import-intensity of exports. The scatter-plot of export-share and backward leakages reveals that exports of petroleum products, basic metals, chemical products, motor vehicles, other transport equipment etc. are import-intensive (Chart 9). This calls for rationalised import duties on the imported intermediates used in the production of goods in these sectors, as excessive import duties, could make these exports uncompetitive and adversely affect the export sector. 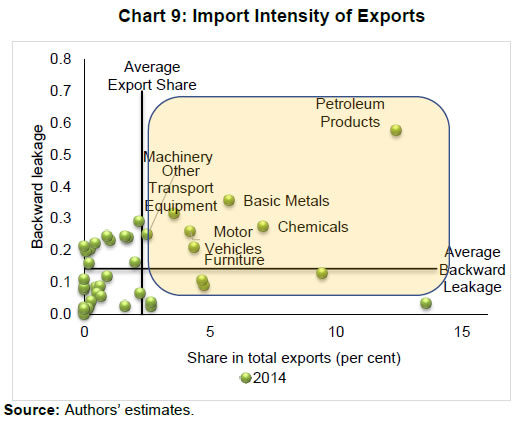 In order to realise the true potential of the economy, policy interventions need to be aligned with the production structure. Moreover, government resources are limited, which means that it is often not possible for fiscal interventions to be equally focused on all sectors. The identification of major sectors, therefore, becomes important to realise maximum ‘bang for the buck’ from policy intervention. In this context, the paper uses input-output analysis to identify the key sectors of the economy. Manufacture of food products, rubber and plastic products, motor vehicles, etc. emerge as the key sectors in terms of output multipliers while mining and quarrying, electricity, and manufacture of chemical products generate the highest input multipliers. The paper also undertakes an investigation into leakages. While imports represent leakage from the domestic multiplier, they are also an important channel of realising gains from trade (through greater participation in GVCs or access to more efficient inputs). Two distinct patterns of interaction between linkages and leakages are observed – in the case of services, higher intermediate imports are associated with higher domestic linkages as well, while the opposite holds for the industry, i.e., higher intermediate imports are associated with lower domestic linkages. This calls for a careful evaluation of the reasons for the substitution of domestic linkages with intermediate imports in the industry sectors. It is important to emphasise here that this is not necessarily a call for protectionist policies on inputs used in these sectors. Rather what is needed is an understanding of the nature of the particular sectors and why they are losing out on international competitiveness, which could enable the appropriate policy response. Based on the relationship between linkages, leakages, exports, etc., the paper makes some specific observations. First, promotion of exports in sectors with high output multipliers but low export share currently such as the manufacture of rubber and plastic products, computer, electronic, and optical products, etc. can reap maximum benefits for the entire economy. Second, the exports of petroleum products, basic metals, chemical products, motor vehicles, other transport equipment, etc. are import-intensive (high export share and high backward leakages). As excessive import duties on the imported intermediates used in the production of goods in these sectors could make exports uncompetitive, rationalisation of the import duty on imported intermediates is advantageous. Third, sectors such as manufacture of basic metals, fabricated metals, chemicals, non-metallic minerals, etc. supply inputs to a number of domestic sectors and are also highly import-intensive (high forward linkages and high backward leakages). It may be advisable to bolster domestic capability in the inputs used in these sectors and diversify existing imports of inputs among a number of countries to reduce vulnerability to external shocks. Finally, the analysis presented in this paper is subject to certain limitations. First, the output multipliers computed in the paper are likely to be an underestimate as they capture only the spending effect but do not consider the socio-economic implications of the higher spending. For example, the output multiplier of education sector at 1.16 suggests that every ₹100 spent in this sector will generate subsequent rounds of spending by its upstream sectors resulting in a total impact of ₹116. It, however, disregards the impact of higher education and skilling on worker productivity which has the potential to create higher growth in the future. Second, the forward linkages (input multipliers) and forward leakages computed in the paper are based on a fixed-input coefficient and fixed ratio of imported to domestic intermediates. In reality, the firms may be able to substitute between inputs as well as imported intermediates, which means that the computed input-multipliers and forward leakages may over-estimate the sensitivity to disruption in a particular sector. Third, the analysis of the paper is based on data from WIOD which is available only till 2014. While data pertaining to a more recent period could provide a better picture of the current realities, the composition of intermediate inputs (raw materials) is not expected to change much over time, unlike final inputs (land, labour, capital)10. Fourth, the input-output analysis conducted in the paper is a static analysis and is subject to the usual criticisms of I-O analysis, viz., assumptions of constant returns to scale, static technology, poor recognition of factor substitutions and of price adjustments that can change cost-price relations, etc. An assessment of competitive advantages and dynamic potential of various sectors could, therefore, provide a more forward-looking picture. Notwithstanding these limitations, the insights about the economic structure offered in the paper can be a useful guide for the design of public policy. @ Saurabh Sharma and Ipsita Padhi are Managers; and Deba Prasad Rath is Officer-in-Charge in the Department of Economic and Policy Research, Reserve Bank of India. * The authors would like to express their sincere gratitude to Professor C. Veeramani for his comments on the paper. The views expressed in the paper are those of the authors and do not necessarily reflect the views of the Reserve Bank of India. Email for correspondence: saurabhs@rbi.org.in. 1 Compared to the situation when all inputs are sourced domestically. 2 This enables us to analyse the impact of the high growth witnessed during 2003-04 to 2007-08 on the production structure. 3 Although national IO tables compiled by WIOD contain 56 sectors, 11 out of these have zero final output for India. Thus, we remove those sectors from our analysis, bringing down the count of sectors to 45. 4 Employment intensities are presented in Table A3. 5 The scope of Operation Green Scheme has been enlarged to include 22 perishable products in Union Budget 2021-22. 6 Announced under Atma Nirbhar Bharat Abhiyaan 1.0. 7 The output multipliers of all sectors included in the PLI scheme are presented in Table A4. 8 It may be noted that that the concept of multiplier developed in the paper is based on the linkage of a sector with the rest of the economy. Apart from the linkage-based multiplier, there can be many other ways to judge the suitability of a sector in enhancing the growth potential of the economy. For example, the concept of comparative advantage or dynamic comparative advantage are readily employed for this purpose. One of the methods by which comparative advantage of a sector can be assessed is by computing the domestic resource cost (DRC) of that sector. However, this is beyond the scope of this paper. DRC measures the efficiency with which a country's domestic resources (labour, capital, land) are converted into output measured as value added at world market prices (Pw). DRC = (Labour + Capital + Land)/Value Added in Pw. It is a cost-benefit ratio, with costs in numerator and net benefits in denominator. If DRC<1, domestic resources used are less than value added created, which suggests comparative advantage; if DRC>1, domestic resources used are greater than value added created, which indicates comparative disadvantage. 9 The employment intensity of the industry sectors that have witnessed a decrease in linkages along with an increase in leakages have been presented in Table A5. 10 For example, in bread-making, the ratio of flour to water has not changed much over time, although the process has become more capital intensive. References Acemoglu, D., Autor, D., Dorn, D., Hanson, G. H., & Price, B. (2016). Import competition and the great US employment sag of the 2000s. Journal of Labor Economics, 34(S1), S141-S198. Ahmad, N. (2019). Improving the accounting frameworks for analyses of global value chains. Global Value Chain Development Report 2019, 155. Bhattacharya, T., & Rajeev, M. (2013, July). Measuring linkages to identify key sectors of the Indian economy: An application of input-output analysis. In Workshop on Sustaining High Growth in India (pp. 25-26). Bhattacharya, T., & Rajeev, M. (2014). Input-Output Linkages across Sectors and Employment Challenge in Indian Economy. Artha Vijnana, 56(1), 61-78. Boucher, M. (1976). Some further results on the linkage hypothesis. The Quarterly Journal of Economics, 313-318. Caliendo, L., Parro, F., Rossi-Hansberg, E., & Sarte, P. D. (2018). The impact of regional and sectoral productivity changes on the US economy. The Review of Economic Studies, 85(4), 2042-2096. Cella, G. (1984). The input‐output measurement of interindustry linkages. Oxford Bulletin of Economics and Statistics, 46(1), 73-84. Chenery, H. B., & Watanabe, T. (1958). International comparisons of the structure of production. Econometrica: Journal of the Econometric Society, 487-521. Clements, B. J. (1990). On the decomposition and normalization of interindustry linkages. Economics Letters, 33(4), 337-340. Das, D. K. (2016). Trade policy and manufacturing performance: exploring the level of trade openness in India’s organized manufacturing in the period 1990-2010. Reserve Bank of India Development Research Group Study,(41). Dietzenbacher, E. (1992). The measurement of interindustry linkages: key sectors in the Netherlands. Economic Modelling, 9(4), 419-437. Dietzenbacher, E., Albino, V., & Kuhtz, S. (2005, June). The fallacy of using US-type input-output tables. International Conference On Input-output Techniques, Vol. 15. Feenstra, R. C., & Sasahara, A. (2017). The’China Shock’, Exports and US Employment. NBER Working Paper No. 24022. Goldberg, P. K., Khandelwal, A. K., Pavcnik, N., & Topalova, P. (2010). Imported intermediate inputs and domestic product growth: Evidence from India. The Quarterly journal of economics, 125(4), 1727-1767. Guo, J., & Planting, M. A. (2000). Using input-output analysis to measure US economic structural change over a 24 year period. Bureau of Economic Analysis. Hansda, S. K. (2001). Sustainability of Services-Led Growth: An Input Output Analysis of the Indian Economy. Reserve Bank of India Occasional Papers, 22(1-3), 73-118. Hollweg, C. (2017). How Do Exports Support Labor in Vietnam?. Background paper for “Vietnam’s Future Jobs: Leveraging Mega-Trends for Greater Prosperity,” World Bank, Washington, DC. Hollweg, C. H. (2019). Global value chains and employment in developing economies. Global Value Chain Development Report 2019, 63. Jones, L. P. (1976). The measurement of Hirschmanian linkages. The Quarterly Journal of Economics, 90(2), 323-333. Kaur, G., Bordoloi, S., & Rajesh, R. (2009). An empirical investigation on the inter-sectoral linkages in India. Reserve Bank of India Occasional Papers, 30 (1), 29-72. Khan, S. U. (2010). Backward & Forward Linkages in the ITES/BPO Industry. eSocialSciences Working Papers No. 2689. Leontief, W. (Ed.). (1986). Input-output economics. Oxford University Press. Miller, R. E., & Blair, P. D. (2009). Input-output analysis: foundations and extensions. Cambridge university press. Ming, Ye, Meng, B., & Wei, S. J. (2015). Measuring smile curves in global value chains. Institute of Development Economies. Nambiar, R. G., Mungekar, B. L., & Tadas, G. A. (1999). Is import liberalisation hurting domestic industry and employment?. Economic and political Weekly, 417-424. Polenske, K. R., & Sivitanides, P. (1990). Linkages in the construction sector. The Annals of Regional Science, 24(2), 147-161. Rameezdeen, R. (2005). Study of linkages between construction sector and other sectors of the Sri Lankan economy. Rasmussen, P. N. (1956). Studies in inter-sectoral relations (Vol. 15). E. Harck. Reis, H., & Rua, A. (2009). An input–output analysis: Linkages versus leakages. International Economic Journal, 23(4), 527-544. Rijesh, R. (2019). International trade and productivity growth in Indian industry: Evidence from the organized manufacturing sector. Journal of South Asian Development, 14(1), 1-39. Saikia, D. (2011). Analyzing inter-sectoral linkages in India. African Journal of Agricultural Research, 6(33), 6766-6775. Sastry, D. V. S., Singh, B., Bhattacharya, K., & Unnikrishnan, N. K. (2003). Sectoral linkages and growth prospects: Reflections on the Indian economy. Economic and Political Weekly, 2390-2397. SN, R. R., & Sasidharan, S. (2015). Impact of foreign trade on employment and wages in Indian manufacturing. South Asia Economic Journal, 16(2), 209-232. Veeramani, C., & Dhir, G. (2017). Reaping gains from global production sharing: Domestic value addition and job creation by Indian exports. Indira Gandhi Institute of Development Research Working Paper No. 2017-008. Xiaoming, P. A. N. (1997). Interindustrial Effects of Labor Productivity: an Empirical Study for China. Institute of Systems Science.
| |||||||||||||||||||||||||||

આ પેજ શેર કરો:


રિઝર્વ બેંક ઑફ ઇન્ડિયા મોબાઇલ એપ્લિકેશન ઇન્સ્ટૉલ કરો અને લેટેસ્ટ ન્યૂઝનો ઝડપી ઍક્સેસ મેળવો!
અમારી એપ ઇન્સ્ટોલ કરવા માટે QR કોડ સ્કેન કરો


પેજની છેલ્લી અપડેટની તારીખ:


