 IST,
IST,
Chapter III : Financial Institutions
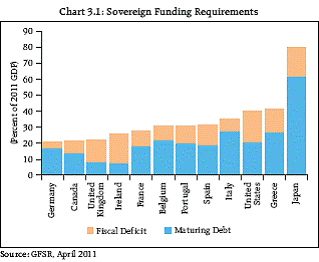
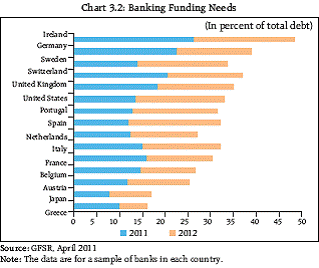
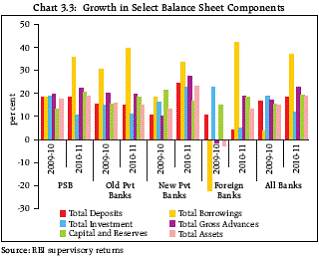
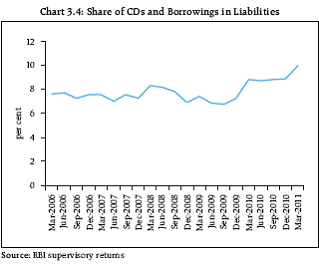
Banks in advanced economies continued to face sluggish credit growth apart from their insufficient capitalisation and weak funding positions that still seemed dependent on public support. The confidence in the banking system was also adversely impacted due to renewed sovereign risks, particularly in the Euro area. As against this, in India, banks remain well capitalised, with their asset quality and profitability showing considerable improvement over the previous year. There was robust revival in credit off take during 2010-11 compared to the subdued growth witnessed in 2009-10. Amid these developments, the upturn in credit growth called for caution as this is a phenomenon often synonymous with less stringent credit risk assessments and potential to contribute to asset impairments during the downturn of credit cycle. The fears of impending slowdown in the economy also raised the concern of sustainability of the credit growth even as monetary tightening and macroprudential measures to prevent overheating were underway. The liquidity position of the banks was adversely affected on account of growing mismatches in the growth rates of deposit and credit, apart from the other structural factors like gaps in the maturity profile of their assets and liabilities becoming bigger due to growing exposure to long term infrastructure projects. The Banking Stability Map, introduced in the previous FSR to indicate relative movements of select risk parameters of the banking system during a given period, indicated marginal increase in the risks pertaining to liquidity compared to the previous year. However, the Banking Stability Indicator, also introduced in the previous FSR, showed overall improved stability. In the co-operative sector, while the measures to consolidate and strengthen the urban co-operative banks continued, the number of unlicensed rural cooperatives entities came down as a result of steps initiated in this regard. The financial soundness indicators of rural cooperative credit institutions, however, remained a matter of concern. The non-banking finance companies showed improvement in their performance as a result of which their soundness indicators also improved. The regulatory architecture of these companies continued to be tightened with a view to plug regulatory gaps and prevent possible opportunities of regulatory arbitrage. Insurance sector has been covered for the first time in the FSR. Although, the insurance sector does not contribute to the systemic risk in the manner the banking sector does, it is a critical component of the financial system, being one of the key players in the financial markets. In India, the insurance sector has grown deep and wide over the years, particularly after opening up of the sector to the private players, and remains robust and well regulated. Post-crisis Global Scene Sovereign and bank funding risks remain key sources of financial instability even as global system witnessed ‘two speed recovery’ 3.1 The world economy is expected to grow at about 4.5 per cent during 2011 and 2012. As against this, the growth of advanced economies is expected to be only 2.5 per cent compared to the 6.5 per cent growth expected in case of emerging and developing economies (World Economic Outlook, IMF, April 2011). This ‘two speed recovery’ has thrown unique policy challenges for countries. 3.2 Sovereign balance sheets remained a key source of financial instability, especially because of their interconnectedness with banks. On the one hand, the concerns over the sustainability of public debt have been affecting the banks’ balance sheet creating adverse feedback loops through real economy. On the other hand, the volatility in the Euro area markets emanating essentially from sovereign debt risks, has resulted in erosion of investors’ demand making the task of sovereign funding quite uncertain apart from driving up sovereign yields and CDS spreads. Going forward, the most pressing challenge for the advanced economies is the funding of banks and sovereigns, particularly in some vulnerable Euro area countries (Charts 3.1 and 3.2). 3.3 Segments of the global banking system remain vulnerable to further shocks. Despite improvements to balance sheets and significant policy initiatives, some banks remain insufficiently capitalised and vulnerable to rising funding costs, which was evident in the rising and elevated bank CDS spreads. Credit growth remained very subdued in the advanced economies despite the lending conditions having eased in the major advanced economies. As against this, credit growth reached high levels in many emerging market economies (EMEs), particularly in Asia and Latin America. Domestic Developments - Scheduled Commercial Banks (SCBs) Balance Sheet Amid strong growth, some concerns owing to growing reliance on market funds to fund robust credit growth were discernible 3.4 The balance sheet structure1 of the SCBs remained robust. Deposits continued to dominate the liability side of the balance sheet while the profile of bank assets, essentially held as part of the banking book, also remained largely unchanged. However, certain concerns were discernible in the balance sheet structure, viz., increased reliance on market borrowings to fund assets, increasing imbalances in the maturity profile of assets and liabilities and potential addition to asset impairments which could follow the rebound in credit off take. 3.5 As at end March 2011, the balance sheet size of SCBs increased by about 19 per cent primarily on account of improved credit off take. The outstanding credit had grown by 22.6 per cent during the year (17 per cent in the previous year) (Chart 3.3). As against this, deposits lagged behind with growth of 18 per cent. The gap was funded by increase in funds accessed from market (CD issuances and borrowings) which increased by 34.5 per cent over its position as at end March 2010. The share of borrowings and CDs in banks’ liabilities rose to about 10 per cent in 2011 from about 7.5 per cent in 2006 (Chart 3.4).
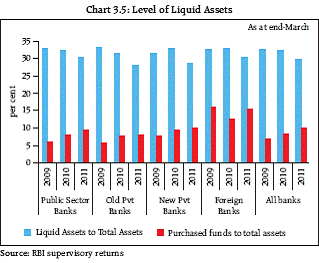
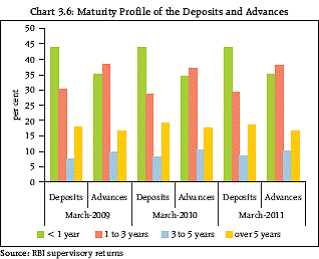
3.6 The increased reliance of banks on borrowed funds raised concerns about their liquidity position, especially if such reliance were to increase further. These concerns were further accentuated by a reduction in the share of liquid assets in the total assets of the banks (Chart 3.5). In particular, the period from October 2010 to February 2011, during which the systemic liquidity conditions were strained, witnessed increased CD issuances with interest rates rising to 9-10 per cent. Increase in borrowings from market was particularly evident in the case of public sector banks (PSBs) and new private sector banks. 3.7 Concerns about increasing reliance on borrowed funds were further exacerbated by growing mismatches in the maturity profile of deposits and advances. While more deposits than advances were getting re-priced in the near term (less than a year) bucket, more advances than deposits were maturing in 1-3 year and 3-5 years buckets (Chart 3.6). These mismatches entailed considerable rollover risks for banks. 3.8 At the current juncture, however, the reliance on market borrowings was not very significant in absolute terms. Also, concerns were alleviated by the accessibility of banks to stable low cost deposits (current account and savings account - CASA deposits) which stood at about 35 per cent of total deposits (Chart 3.7).
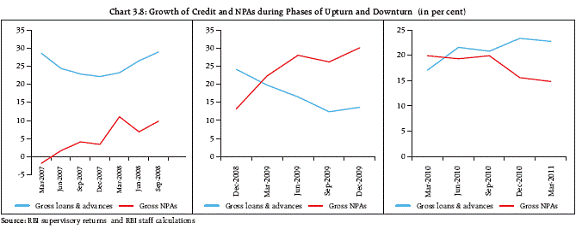
Credit Growth Credit growth revived; nonetheless caution was called for to ensure quality of assets 3.9 Credit growth rebounded in 2010-11 with 22.6 per cent growth in outstanding credit after a subdued performance in the previous year. The robust growth in credit was a necessity in a developing economy like India for sustaining high GDP growth and improving the level of financialisation of the country (credit to GDP ratio stood at about 73 per cent as at end December 2010). Simultaneously, however underwriting standards would need to be tightened in order to ensure that the quality of credit does not deteriorate, going forward. 3.10 To assess the impact of credit growth in India on banks’ asset quality, an empirical study was conducted to analyse the related trends in the periods identifiable with pre-global financial crisis, its aftermath and the post crisis phase. The study revealed that strong credit growth was synonymous with lowering of the risk perceptions leading to perceptible improvement in asset quality, whereas slow down in credit growth was followed by increase in impaired assets (Chart 3.8). During March 2007 - September 2008, while the outstanding credit growth remained relatively high at about 24 per cent, NPAs had either decelerated or grew by less than 10 per cent (left pane), as against which during the slow down phase (middle pane) when the credit off-take started declining and fell to 12-13 per cent in December 2009, the growth in NPAs rose from about 13 per cent in December 2008 to 30 per cent in December 2009. The credit growth during 2010-11, seemed comparable to the growth witnessed in pre-crisis period. It was also being seen that there was substantial deceleration in growth of NPAs (right pane). Apart from reflecting cyclicality, the pattern was also indicative of impairment in assets being actually initiated during phases of rapid credit growth. Increased caution in credit selection and stringent monitoring standards would thus be necessary to ensure that the credit growth remained immune to potential impairments, should a slow down were to take place.
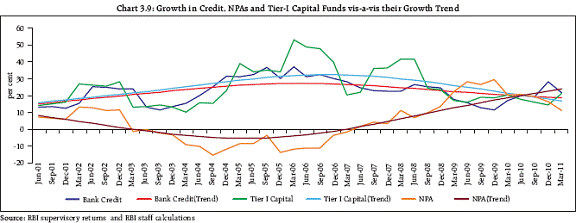
3.11 An analysis of growth in outstanding credit, gross NPAs and Tier-I capital funds over the past one decade also revealed similar trends. The analysis additionally revealed that growth in capital funds was above (below) its long term trend when credit growth exceeded (fell short of) its long term trend. Thus, the phases of robust credit off take warranted close monitoring as these could be precursors to future asset impairments and reductions in capital levels during the downturn of the credit cycle (Chart 3.9).
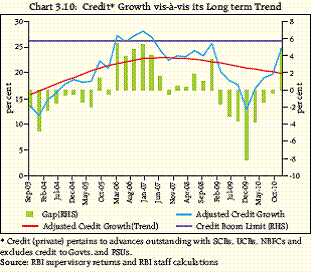
3.12 The periods of high credit growth have the potential to give rise to credit boom like scenarios (Box 3.1), which have often been identified to be precursors to credit busts and financial crises. However, devising methods to get a reliable estimate of overheating in the system due to high credit growth is difficult as different economies, based on their stages of development, pose critical limitations to usefulness of these methods. As discussed in Chapter IV, one such method which attempts using the trend of credit to GDP ratio to determine overheating, could not give any reliable estimate. Box 3.1: Are We Witnessing a Credit Boom? It is widely believed that phases of credit booms preceded majority of financial or banking crises. In an analysis of the financial crises in the past, and episodes of credit booms as defined by Mendoza and Terrones, it was observed in a BIS paper (BIS Quarterly review, September 2010) that there were 17 episodes of financial crises which were preceded by credit booms in a sample of 27 such crises. Such phases of excessive credit booms have been defined to be happening when the cyclical component of credit exceeds the average historical cyclical component by 1.75 times the standard deviations of the credit variable. Based on this definition, lower limit for credit boom has been estimated and presented in the Chart 3.10. It may be observed from the chart that in India, during the period under analysis, cyclical component of credit growth has never crossed the lower limit, nonetheless, during the period between March 2006 and March 2007, it may have come quite close to the limit. Hence, based on this definition, it appeared that the country might have witnessed a near credit boom during the stated period. This period indeed preceded the period of slower growth in credit and higher growth of NPAs in the banking system. The chart also showed that such a credit growth may have taken place during 2010-11 as the cyclical component reached close to the aforesaid limit. The above study is of considerably greater relevance for developed economies. For developing economies like India, however, it has limitations where robust credit growth is a necessity for financing higher economic growth. Nevertheless,measuring credit booms in developing economies like India, may be helpful in identifying such periods which witnessed strong credit growth and, as discussed in para 3.10 and 3.11 of this Chapter, were followed by greater growth in impaired assets. It may also signal the need for cautious credit selection, strategic limit to concentration risks in the specific sectors driving the growth, more strict monitoring of accounts to ensure that credit quality did not suffer in the wake of improved credit growth, apart from holding adequate capital and providing more towards potential accretions to NPAs.
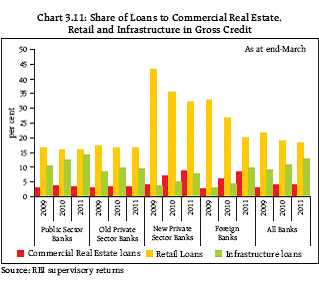
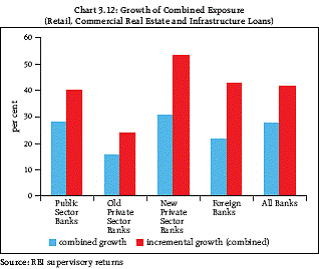
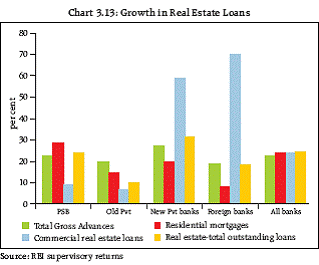
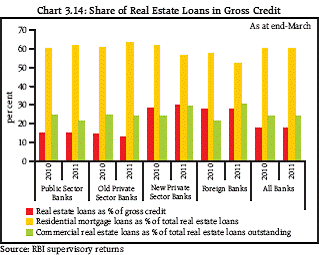
Exposure to specific sectors have driven the credit growth 3.13 The credit portfolio of SCBs was well diversified across industries, geography and sectors. However, during the last few years, incremental credit growth was observed to be mainly propelled by credit growth in a few sectors viz., retail, commercial real estate and infrastructure. In March 2011, these sectors accounted for 19 per cent, 4 per cent and 13 per cent respectively of the gross advances of the SCBs (Chart 3.11). The combined contribution of the three sectors to the incremental gross outstanding credit was to the extent of 40 per cent. Their combined exposure registered an increase of 27.5 per cent during 2010-2011 as against 20.4 per cent in 2009-2010 (Chart.3.12). The PSBs and new private sector banks showed the maximum increase (27.9 per cent and 30.6 per cent respectively). 3.14 Each of these sectors were characterised by unique asset quality features and, given their large share in credit portfolio of banks, required careful monitoring. Sectoral Credit and their Asset Quality Real Estate Incremental share in both credit and impaired assets remained large 3.15 Real estate loans constituted 17.7 per cent of gross advances in March 2011, the share being nearly 30 per cent in case of new private sector and foreign banks. The credit to the sector registered a growth of 24.6 per cent in 2010-11, i.e. at a rate higher than the overall credit growth of 22.6 per cent. In the preceding two years, the rate of growth of loans to this sector was 17 per cent and 11 per cent respectively (Charts 3.13 and 3.14). 3.16 Residential mortgages and the commercial real estate - the two major segments of the real estate sector - both registered a growth rate of about 24 per cent. The new private sector and foreign banks increased their commercial real estate exposure by 59 and 69 per cent respectively, a rate much higher than the single digit growth rate witnessed by the other two bank groups. The rate of growth of NPAs in this segment at 19.8 per cent was also higher than the overall NPA growth rate of 14.8 per cent. In particular, the NPAs in the commercial real estate segment grew at 70.3 per cent as at end March 2011, most of the impairment taking place in PSBs.
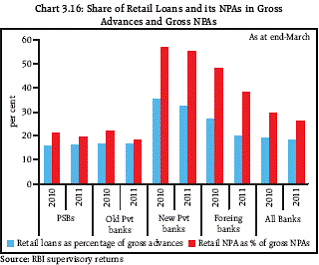
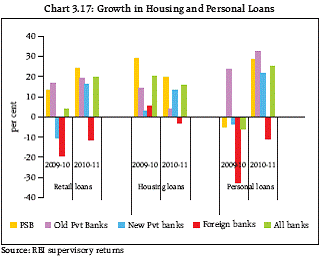
3.17 The share of real estate NPAs in the gross NPAs of the banking sector stood at 15 per cent - lower than the share of sector’s credit in total credit at 17.7 per cent. The gross NPA ratio at 1.8 per cent was also lower than the overall NPA ratio of 2.3 per cent for SCBs. The NPA ratio improved for residential mortgage loans (2.5 to 2.2 per cent), though it deteriorated in the case of commercial real estate loans (1.6 to 2.3 per cent) (Chart 3.15). 3.18 Despite the positive developments mentioned above, the real estate sector posed some concerns given the large and growing share of these loans in the credit portfolio of banks, its NPAs witnessing higher than system level NPAs growth, and potential of greater slippages into NPAs. 3.19 Going forward, the asset quality in this segment may come under further pressure given the increasing interest rate environment2. There is also some anecdotal evidence of increasing inventory levels in the sector even as prices continued to remain elevated. In view of these developments, the Reserve Bank announced a series of macroprudential measures, inter alia, to curb excessive leveraging in the sector and strengthen resilience of the banking system3. Retail credit staged a comeback having declined in the previous year 3.20 Credit to the retail sector accounted for 18.5 per cent of the gross loans and advances of SCBs as at end March 2011, marginally lower than 19 per cent in March 2010 (Chart 3.16). Retail loans grew by 19 per cent during 2010-11, rebounding strongly after a 3 per cent growth in 2009-10. The bulk of the increase was attributable to the personal loan segment which primarily comprisedriskier, unsecured loans (Chart 3.17). As on March 2011, 31 per cent retail loans were unsecured, with this segment registering an increase of 24.9 per cent during the year.
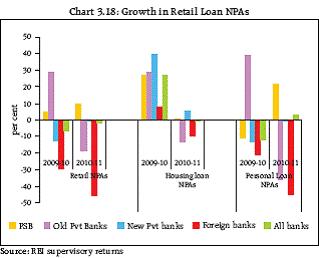
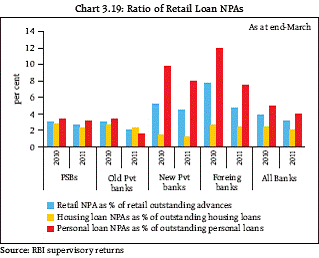
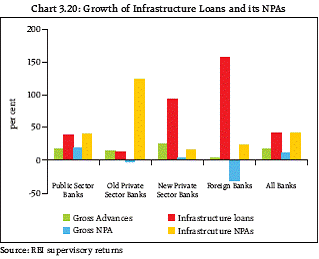
3.21 The gross NPA ratio of retail loans at 3.2 per cent remained higher than the overall NPA ratio of 2.3 per cent for SCBs. However, the quantum of retail NPAs showed decline of 2.2 per cent during 2010-11 as against decline of about 7 per cent in 2009-10 (Charts 3.18 and 3.19). The quantum of housing loan NPAs also declined though there was a marginal increase in case of personal loan NPAs. 3.22 The robust rebound in retail loans witnessed during recent quarters warrants close monitoring as the asset quality of such loans could come under pressure given the increasing interest rate environment. The performance of these loans are closely linked to the individual income and wealth levels, which could be affected if the risks to economic growth, as discussed in Chapter I of this Report, were to materialise. Infrastructure credit grew robustly, so did the sector’s impaired assets; gross NPA ratio in the sector, however, remained low 3.23 Advances to infrastructure continued to exhibit strong growth of above 40 per cent in 2010-11 (Chart 3.20). The share of infrastructure lending in total advances consequently increased to 12.9 per cent in March 2011 as against 11 per cent in March 2010. Among the bank groups, the exposure was concentrated in PSBswhich accounted for 84.8 per cent of the total banking sector’s exposure to the segment.
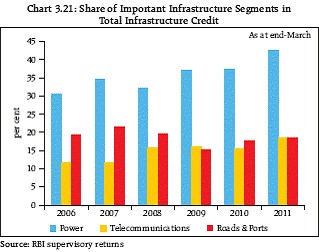
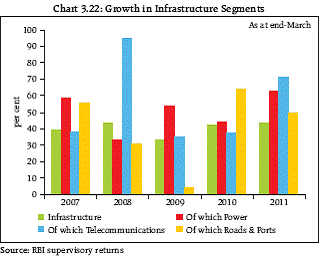
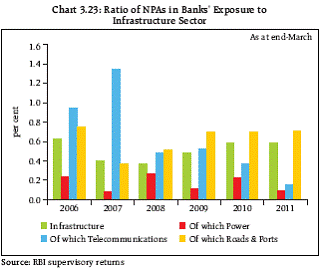
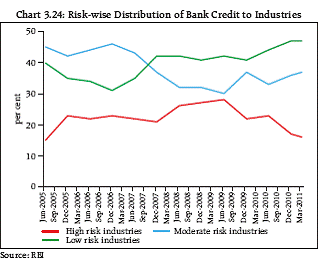
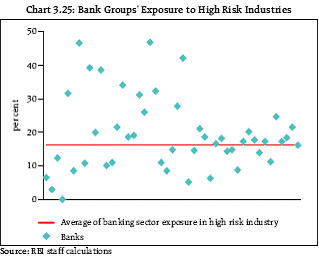
3.24 There was an increase of 42.5 per cent in impaired infrastructure loans during 2010-11. Nevertheless, the gross NPA ratio for such loans continued to be low at around 0.5 per cent. 3.25 Banks’ exposure to power, telecommunications and roads and ports formed the important segments of infrastructure credit. Credit to the power sector accounted for about 42 per cent of aggregate infrastructure credit while the other two segments accounted for 18 per cent each (Chart 3.21). During the last five years, SCBs’ exposure to the power sector grew at an average of 50 per cent whereas large fluctuations were witnessed in the growth rate of credit to other two sectors (Chart 3.22). Gross NPA ratios in the different segments of infrastructure credit fluctuated over the years but remained well below the overall NPA ratio for the SCBs (Chart 3.23). 3.26 The previous FSR stated that increased exposure to the infrastructure segment could heighten asset liability management (ALM) risks for banks. These risks have been accentuated with the increased share of infrastructure credit in the total advances of SCBs. The asset liability management issues associated with infrastructure lending could also potentially get exacerbated given the not insignificant probability of projects getting delayed, as pointed out in the previous FSR. All of this underscores the urgent need for evolving a long term funding market for infrastructure projects. Concentration in high risk industries was low 3.27 A study of deployment of bank credit in thirty eight major industries was done to assess the concentration in high risk industries and the underlying trends4. Over the period spanning the last six years, the share of credit to high risk industries has remained low though there was some increase noticed in the aftermath of the crisis. As on March 2011, the share of such credit stood at around 16 per cent. There were, however, some outlier banks whose share in high risk industries exceeded the industry average (Charts 3.24 to 3.25).
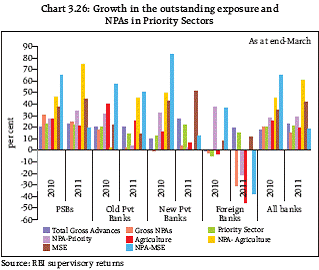
Exposure to Priority Sector5 Exposure to the priority sectors increased but high level of NPAs were a cause for concern 3.28 Priority sector credit grew by 21 per cent during 2010-11 as against which its impaired assets increased by 28 per cent. Thus, asset quality of exposures to the priority sector, especially agriculture, continued to compare unfavourably with the overall NPA ratio of the banking sector. Consequently, the gross NPA ratio for the sector deteriorated from 3.3 per cent to 3.5 per cent (Chart 3.26). 3.29 The gross NPA ratio in respect of credit to the agriculture segment rose to 3.3 per cent in March 2011 as against 2.4 per cent in March 2010. The deterioration in the ratio was attributable to a rise of 60 per cent in agriculture NPAs as against a growth of 19 per cent in agriculture credit. The gross NPA ratio of the micro and small enterprises (MSE) was also high at 3.5 per cent with gross NPAs increasing by 18.4 per cent over high accretions of the previous year. In order to address entire gamut of issues involved with lending to the priority sector, a Committee is being constituted by the Reserve Bank to relook at the definition of the priority sector, especially in cases where bank finance was being routed through other institutions. Off-balance Sheet (OBS) Exposure Significant increase was noticed in foreign banks’ OBS exposure 3.30 Aggregate notional amount of OBS exposures of the SCBs as a percentage of their total balance sheet size increased from 178 per cent as at end March 2010 to 198 per cent as at end March 2011. In the case of foreign banks, OBS exposure as proportion of their onbalance sheet exposure increased from 1554 per cent to 1860 per cent during the year.
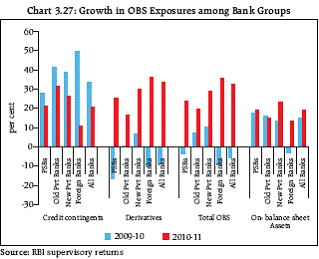
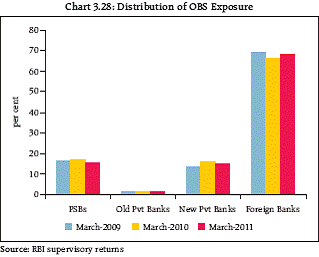
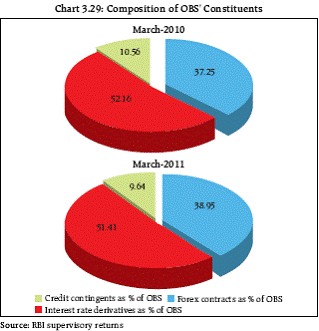
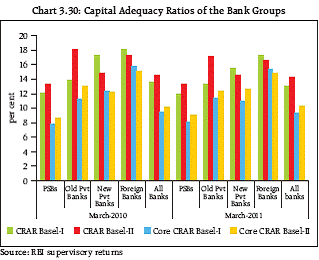
3.31 The notional principal of these exposures increased by 32.3 per cent during the year as against decline of 5.8 per cent in the previous year (Chart 3.27). The distribution of the aggregate notional amount of OBS exposures among the bank groups showed concentration of about 68 per cent in foreign banks and just about 15 per cent each in case of PSBs and new private sector banks (Chart 3.28). 3.32 Credit equivalent of the derivative exposures, as a ratio of balance sheet size remained low and, in fact, exhibited a declining trend (from 8.8 per cent in March 2009 to 5.3 per cent in March 2010 and further to 4.5 per cent as at end March 2011). The ratio in case of foreign banks was higher at 51 per cent in March 2010 but declined to 47 per cent as at end March 2011. The aggregate mark-to-market (MTM) positions of the SCBs remained positive. 3.33 Among the OBS constituents, credit contingent deals as proportion of OBS exposure declined as at end March 2011 while the share of derivative deals, especially the foreign exchange contracts increased, warranting increased vigilance on this front (Chart 3.29). 3.34 OBS exposures in India generally comprise simple products/deals. Forward contracts form the bulk of foreign exchange contracts and are generally hedged back-to-back by the banks. There are, however, associated credit risks in forward contracts and in OTC interest rate deals which warrant vigilant risk management. Financial Soundness Indicators Capital to risk weighted assets ratio (CRAR) Banks remain well capitalised, though improved credit off take resulted in marginal decline in the capital adequacy ratio 3.35 SCBs remained well capitalised as at end March 2011.The system level CRAR under Basel-II norms stood at 14.3 per cent which was well above the regulatory minimum of 9 per cent. There was, however, a minor decline compared to the CRAR of 14.5 per cent as atend March 2010, largely due to robust credit off take during 2010-11. All the bank groups had CRAR above 12 per cent as at end March 2011 under Basel-II norms. Under Basel-I norms, however, the CRAR for PSBs at 11.9 per cent was marginally lower than 12 per cent (Chart 3.30).
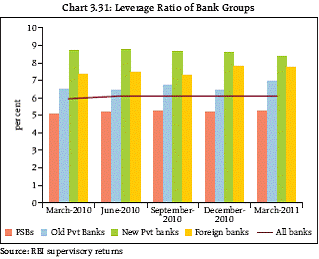
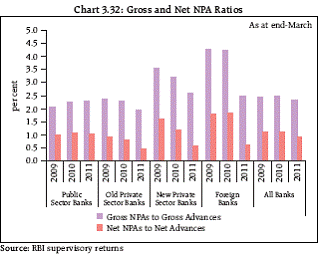
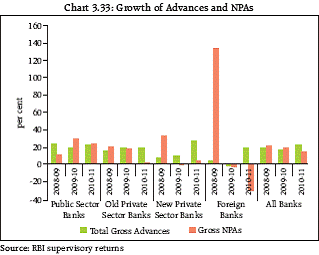
3.36 The regulatory tightening of the capital requirements in India, especially with regard to core capital, preceded the Basel-III stipulations as the banks were required to maintain Tier I capital ratio of 6 per cent on a continuous basis with effect from April 01, 2010. Resultantly, as at end March 2011, core CRAR was comfortably above 6 per cent, for the banking system, each bank group as well as for individual banks (Table 3.1). Going forward, as the Basel III norms are introduced, some banks may need to raise additional capital especially if credit off take remains robust, as discussed in Chapter IV of this Report. Leverage Ratio Leverage ratio of banks in India remained comfortable 3.37 In an attempt to increase the systemic resilience by strengthening capital standards at individual bank level, Basel III regulatory capital framework has introduced a non-risk-based leverage ratio as a backstop to the risk-based capital requirement. It is proposed to test a minimum Tier I leverage ratio of 3 per cent beginning 2013 capturing both on and off balance sheet exposures. Leverage ratio of SCBs in India remained comfortable at about 6 per cent as at end March 2011 (Chart 3.31). Most banks individually operated with Tier I leverage ratio of greater than 4 per cent (only one bank had leverage ratio not greater than 3 per cent). Overall Asset Quality Asset quality impairments decelerated, though risks of further slippages remain 3.38 Gross NPAs for SCBs increased by 14.8 per cent in 2010-11 as against 19.9 per cent in 2009-10. Given the higher growth rate of advances at 22.6 per cent, the gross NPA ratio improved from 2.5 per cent to 2.3 per cent. Net NPAs for SCBs improved to 0.9 per cent from 1.1 per cent (Chart 3.32). The increase in gross NPAs was higher in the case of PSBs (at 23 per cent) against an increase of less than 5 per cent for the private sector banks and a decline of 30 per cent in case of foreign banks (Chart 3.33). Going forward, however, banks may possibly face some further deterioration in asset quality if credit growth slows down, as discussed in paragraph 3.10 of this Chapter.
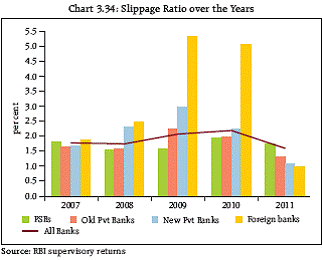
3.39 The reduction in the growth rate of NPAs was, to some extent, due to write-offs of NPAs in addition to recoveries, though both had declined marginally as at end March 2011. The amount involved in the writeoffs stood at 87 per cent of recoveries (97 per cent in 2009-10) and 20 per cent of outstanding credit (28 per cent in 2010). Clearly, in the absence of such write-offs, the position of gross NPAs would be much higher than is reported currently. Additions to restructured accounts have fallen 3.40 The previous FSR discussed the one-time special dispensation in restructuring norms permitted by the Reserve Bank in 2008-09 for entities temporarily affected by the financial crisis. Standard assets to the extent of about 3 per cent of outstanding amount were restructured under the special dispensation during 2008-09 and 2009-10. The increase in the amount of restructured assets was 192 per cent and 60.2 per cent respectively during the two years. After the expiry of the currency of the special dispensation, instances of such restructuring declined sharply and an increase of only 10.7 per cent in restructured accounts was observed. While slippages improved, in case of PSBs it remained above the system average 3.41 The slippage ratio, which is a measure of fresh accretion to the stock of NPAs as a percentage of standard advances at the beginning of the year, improved from 2.2 per cent as at end March 2010 to 1.6 per cent as at end March 2011 as the rate of growth of NPAs decelerated to 14.8 per cent (Chart 3.34). The ratio in case of PSBs, at 1.7 per cent, was marginally higher than the industry average.
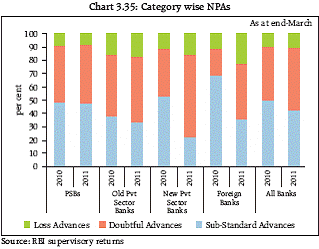
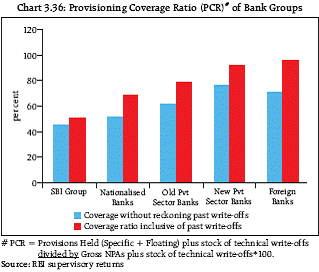
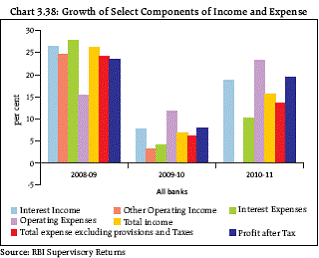
Increase in stickier NPAs was observed 3.42 The change in category-wise distribution of NPAs during the year revealed an increase in doubtful assets vis-à-vis sub-standard assets, indicating that NPAs were becoming increasingly stickier. The trend was even more pronounced in case of new private sector banks which warranted monitoring (Chart 3.35). Provisioning Coverage Ratio Macro-prudential measure to act as cushion against slippages 3.43 In December 2009, banks were advised to achieve a provisioning coverage ratio (PCR) of 70 per cent of their non-performing advances by end September 2010. As on March 31, 2011, the private sector and foreign banks had maintained the required ratio though the PCR was just below 70 per cent in case of the nationalised banks. In case of the SBI group, the gap6 was relatively higher (Chart 3.36). 3.44 Keeping in view the sharp uptrend of credit growth in 2010-11, the Reserve Bank announced further macro-prudential measures in April and May 2011. Banks were advised to segregate the surplus of provisions under the PCR vis-à-vis the provisions required as per prudential norms as on September 30, 2010, into an account styled as ‘counter-cyclical buffer’. The buffer would be available to banks for making specific provisions during economic downturns. Accordingly, banks were no longer required to maintain 70 per cent PCR on the incremental advances after September 2010. Simultaneously, the provisioning requirements on impaired assets were also enhanced on certain categories of non-performing and restructured advances7. Profitability Robust growth in profitability was sign of improved performance. Little growth in non-interest income and rise in staff expenses, however, posed some challenge 3.45 The SCBs’ profitability showed robust improvement during 2010-11 compared to 2009-10 (Chart 3.37). Interest income increased by 18.6 per cent over 7.5 per cent last year and interest expense increased by 10.1 per cent as against 4.0 per cent last year. Resultantly, there was improvement of 34.9 per cent in the Net Interest Income (NII) of the banks during 2010- 11. The effect of increase in NII was seen in the 19.5 per cent growth in net profits despite little change in non-interest income, increase of 49 per cent in risk provisions and 24 per cent increase in operating expenses (Chart 3.38).
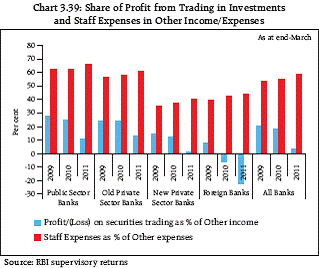
3.46 The growth in interest income by 18.6 per cent was, however, not in tandem with the growth in loans and advances which grew by 22.6 per cent during 2010- 11. There did not also seem to be any decisive impact of the prescription of base rate as minimum lending rate on the interest income. Interest expense increased by only a little over 10 per cent despite increased quantum and cost of deposits, increased borrowings at higher interest rates and the requirement to compute interest on savings account balances on a daily basis. 3.47 The non-interest income of SCBs remained unchanged from the previous year due to increase in fee income and profits from forex operations getting nearly off-set by a 77 per cent decline in profits from trading in investment portfolio. The decline was possibly due to increasing interest rates and systemic liquidity strains in the second half of the year. The foreign banks continued to suffer major losses in their securities trading activities. There was also continuous decline in the share of the securities’ trading profits in the banks’ non-interest income after 2008-09 (Chart 3.39). 3.48 The non-interest expense of the banks showed a substantial rise of 24 per cent over the previous year mainly on account of staff expenses. Staff expenses increased by 30.6 per cent due to wage revisions effected by the PSBs. Share of staff expenses in non-interest expense stood at 58 per cent at system level (65 per cent in case of PSBs and 60 per cent in case of old private banks). 3.49 The wage revisions in case of PSBs and old private sector banks , amongst other things, included the impact of enhanced gratuity limits and opening of pension option for those who had not opted for it earlier. As stipulated by the Reserve Bank, banks were required to provide for the pension liabilities and enhanced gratuity limits of serving employees (amortisable in five years) and retired employees (without amortisation). While pension and gratuity related provisions formed a major portion of the staff expenses in 2011 particularly on account of bullet provisioning in case of retired employees, the impact of amortisation of pension liabilities for serving employees will be affecting the profitability in coming years as well. Going forward, it will be necessary for banks to build adequate provisions on consistent basis for such liabilities so that special regulatory dispensation is not sought (Box 3.2).
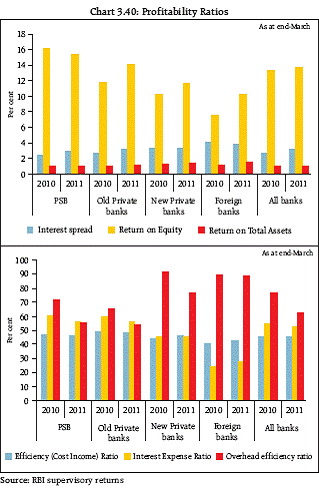
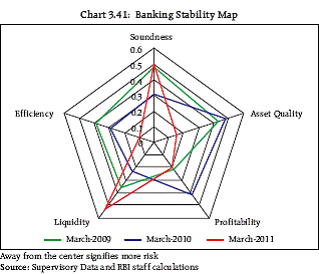
3.50 Aggregate risk provisions increased by 49 per cent during the year, the rise being mainly on account of the increased requirements for NPA provisions (regulatory stipulation of 70 per cent provisioning coverage ratio for NPAs as at end September 2010). Profitability ratios had improved at system level, however marginal deterioration was noticed in case of PSBs 3.51 The profitability ratios of the SCBs indicated improvement over the previous year in as much as the return on assets (RoA) and the return on equity (RoE)of the banks increased from 1.0 per cent and 13.3 per cent in 2009-10 to 1.1 per cent and 13.7 per cent in 2010-11 (Chart 3.40). However, in case of PSBs, these ratios deteriorated (from 1.0 per cent and 16.2 per cent to 0.9 and 15.4 per cent respectively). Interest spread improved from 2.7 to 3.1 per cent. Box.3.2: Provision for Pension and Gratuity Liabilities arising out of Wage Revision in Public Sector Banks and Old Private Sector Banks: Systemic Concerns Banks are required to provide prudently, on an ongoing basis for various types of Employee Benefits including Defined Benefit Plans such as Pension, Gratuity etc., in accordance with the extant accounting standard AS 15 which is based on the International Accounting Standard IAS 19. This aspect becomes more critical subsequent to any wage revision. The last wage revision of the PSBs and 10 old private sector banks which came under the 9th bipartite settlement under the aegis of Indian Banks’ Association (IBA) was signed in April 2010. This wage revision introduced certain new elements, viz. (a) wage hike at a higher level of 17.5%; (b) offer of second option for pension to existing and retired employees; and (c) enhancement in gratuity limits from ` 3.5 lakh to ` 10 lakh, following the amendment to Payment of Gratuity Act, 1972. The expected additional liability of ` 30,366 crore, comprising second pension option (` 22,488 crore) and gratuity enhancement (` 7,878 crore) furnished by IBA, relating to 25 Public Sector Banks, was significant and constituted 81.9 per cent of their net profit for the year 2009-10. As per the accounting standards, these liabilities were required to be absorbed in the Profit & Loss Account. Since the banks could not absorb the impact of the additional burden on account of above, the IBA approached the Reserve Bank, on behalf of its member banks, seeking approval to amortise the additional liability. IBA contended that both these events were unanticipated and not recurring. In view of the above as well as the significant impact of these liabilities, it was decided to consider regulatory dispensation of amortisation to PSBs for a period of five years subject to certain conditions in consultation with the Institute of Chartered Accountants of India (ICAI). This dispensation was not available to liabilities in respect of retired/separated employees. The above dispensation was extended mutatis mutandis, to the ten old private sector banks who were signatories to the bipartite settlement. In terms of the above dispensation, PSBs have absorbed an amount of ` 4971 crore towards pension and ` 1677 crore towards gratuity in the profit and loss account for the year ended March 31, 2011 while carrying the unamortized expenditure of ` 16,897 crore for pension and ` 2903 crore for gratuity in the balance sheet as on March 31, 2011. SBI employees enjoy pension as a third benefit unlike other PSBs. Consequent to the revision of the wages in accordance with the 9th Bipartite Settlement the pension fund liability of the bank for FY 2011 was determined at ` 11,707 crore. SBI had requested that the additional costs of pension liability arising on account of revision of pension consequent upon the 9th bipartite settlement should be evenly spread over the future working lifetime of the employees which was not agreed to by the Reserve Bank since the increase in the liability was linked to the wage revision and could have been reasonably anticipated. However from a purely systemic stability point of view, the impact on SBI's profitability being very significant, regulatory dispensation allowing adjustment against reserves to meet the additional pension liability, net of current year's liability was allowed. In the event, the bank provided ` 2473 crore to the Profit and Loss Account and the balance of ` 7927 crore was charged to the reserves. Going forward it is necessary that banks build adequate provisions for such liabilities in a phased manner in order that regulatory dispensation is not sought and the burden is not concentrated in the year that the settlement is signed. This also has systemic stability issues arising from under-provisioning and non compliance with Accounting Standards in vogue, especially since the Indian Accounting Standards are on the verge of convergence with the International Financial Reporting Standards (IFRS).The matter has been taken up with the IBA. Banks are also being advised to make a proper assessment of their superannuation liabilities and provide for the same from the year in which the periodical wage settlements fall due and not from the year in which such settlements are signed. 3.52 Going forward, increasing interest rates, hike in the savings account interest rate and potentially enhanced provisioning requirements for NPAs as well as provisions for pension liabilities may impact the profitability of banks. Banking Stability Map Liquidity indicators exhibited increased risk 3.53 The Banking Stability Map and Indicator were introduced in the previous FSR to present an overall assessment of changes in underlying conditions and risk factors having bearing on stability of the banking sector. The assessment was based on five dimensions during a given period. The methodology has been further enhanced by including certain other indicators for each of the five dimensions8 (Table 3.2). 3.54 The Banking Stability Map indicates that relatively, risks to soundness and liquidity increased in March 2011 as compared to March 2009 and March 2010, whereas risks due to efficiency, asset quality and profitability declined (Chart 3.41). The dimensional increase in liquidity risk of the banking sector was, at least partially, attributable to the decline in the level of liquid assets. Though the soundness indicators showed a relative deterioration vis-à-vis the position in previous year, the ratios continue to remain well above the regulatory requirements.
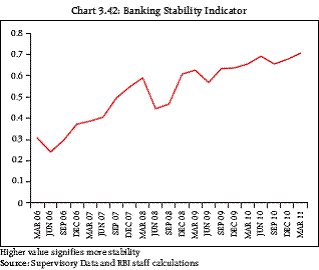
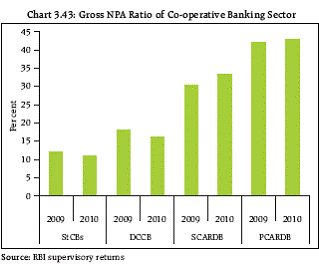
Banking Stability Indicator Banking Stability Indicator has, barring few fluctuations, strengthened over the years 3.55 Based on the individual composite indices for each dimension, the Banking Stability Indicator is constructed as a simple average of the five composite sub-indices mentioned in Table 3.2. A quarterly series of the Indicator shows an overall improved stability in the banking sector, barring a slight dip in September 2010 (Chart 3.42). Regional Rural Banks (RRBs) Performance of RRBs in Category II and III needs to be monitored 3.56 RRBs have a large branch network in the rural area (11861), accounting for nearly 37 per cent of the total rural branch network of all commercial banks including RRBs. RRBs are categorised into three categories - Sustainable viable (Category I - 55 RRBs), Current viable (Category II - 24 RRBs) and Loss making (Category III - 3 RRBs) - based on select parameters like profit and profit earning capacity, etc. An analysis of the performance of the three loss making RRBs and 24 other RRBs in Category II revealed some concerns. In order to align the RRBs with the operational efficiency gained by other banks through IT enabled products, a Road Map for adoption of CBS in RRBs has been finalised and is targeted to be completed by September 2011. Cooperative Banking Sector Rural Co-operative Credit Financial soundness remained an area of concern 3.57 At the aggregate level, the gross NPA ratios as at end March 20109 improved for the short termco-operative credit institutions (StCB & DCCB). For the long term institutions (SCARDB & PCARDB), the ratios deteriorated further (Chart 3.43). 52 per cent of StCBs and 40 per cent of DCCBs had achieved a CRAR of 9 per cent and above. Regulatory measures, such as, requiring a minimum CRAR of 4 per cent as a pre-requisite for licensing have been introduced. Though norms in respect of minimum capital adequacy ratios have not yet been prescribed for the rural co-operative credit institutions, its disclosure has however been put in place since March 2008.
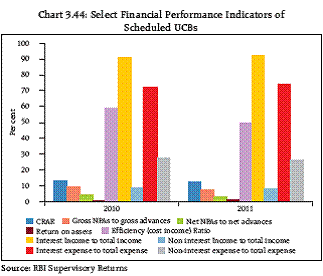
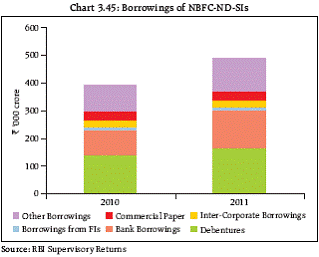
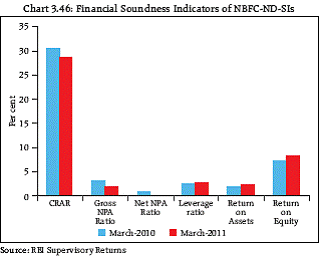
3.58 During 2009-10, there was marginal improvement in the profitability of StCBs and DCCBs (8 per cent and 2 per cent respectively) though the profits came from banks in few regions. There was a significant increase in the number of loss making branches of long term cooperative credit institutions. 3.59 The number of StCBs that remained to be licensed remained unchanged at 7 since the publication of the previous FSR. Some improvement was, however, discernible in case of DCCBs as the number of unlicensed institutions came down from 164 to 150. Urban Co-operative Banks (UCBs) Consolidation exercise continued amid improving financials 3.60 Consolidation of UCBs continued with the issuance of 11 NOCs (in addition to 103 NOCs as at September 2010) for mergers and notification of 18 mergers (in addition to 71 notifications as at end September 2010). These consolidation measures have led to a reduction in the number of weak and unlicensed banks in the sector. Consequently, the financial soundness indicators of scheduled UCBs have improved (Chart 3.44). Non-banking Financial Companies (NBFCs) Increase in the business was concomitant with improvement in the financial soundness indicators Non Deposit taking Systemically Important NBFCs (NBFC-ND-SIs) 3.61 The balance sheet size of NBFC-ND-SIs increased by 21.1 per cent in 2010-11, mainly on account of borrowings which increased by 25.3 per cent.Borrowings from banks/FIs formed a major proportion (30.3 per cent) of their total borrowings. On the asset side, loans and advances increased by 27.6 per cent. Asset quality and profitability improved over the previous year, though capital adequacy ratios showed marginal decline, nonetheless remaining well above the regulatory minimum stipulated (Charts 3.45 and 3.46).
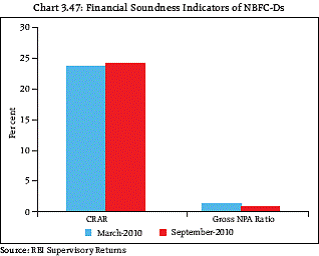
NBFCs Deposit taking (NBFC-Ds) 3.62 In case of NBFC-Ds, loans and advances increased by three per cent as at end September 201010 over previous half year. Asset quality and capital adequacy ratios showed improvement (Chart 3.47). Regulatory architecture - revisions in light of systemic interconnectedness 3.63 Keeping in view the economic role and heterogeneity of the NBFC sector and its systemic interconnectedness, the regulation of this sector has been progressively tightened. As a part of the important regulatory initiatives taken recently in this regard, the CRAR of both NBFC-ND-SIs and NBFC-Ds have been aligned to 15 per cent from the earlier stipulation of 12 per cent (stipulation in case of NBFC-Ds becoming effective as at end-March 2012). Provisioning of 0.25 per cent for standard assets and a prudential cap on banks’ exposures to debt oriented mutual funds have also been stipulated. There were concerns arising due to concentration risk in NBFCs engaged primarily in making loans against gold jewellery, high interest rate charged by these companies, difficulties in ensuring end use of funds, collateral risks in such exposures., etc. As a measure to address these issues, the Reserve Bank directed that the bank loans to NBFCs for on-lending against gold jewellery, would be no more eligible for classification under agriculture sector. Further in a separate move, it was announced that bank loans to NBFCs, other than to such MFIs which fulfilled certain recently introduced eligibility conditions (as mentioned in next paragraph), would not be eligible to be classified as priority sector loans. As discussed in Chapter IV, a Working Group has been formed to address the entire gamut of issues relating to the regulation of NBFCs.
Addressing issues in the MFI sector 3.64 Pursuant to the Malegam Committee recommendations on microfinance sector, bank loans to all Micro-finance Institutions (MFIs), including NBFCs working as MFIs, will be eligible for classification as priority sector loans only if the prescribed percentage of their total assets are in the nature of ‘qualifying assets’ and they adhere to the ‘pricing of interest’ guidelines to be issued in this regard. Bank loans to other NBFCs would not be reckoned as priority sector loans with effect from April 1, 2011. Further, following the sharp drop in collections by MFIs in Andhra Pradesh and some incipient signs of contagion spreading to other States, a special regulatory asset classification benefit was extended to the restructured MFI accounts, which were standard at the time of restructuring, even if they were not fully secured. Insurance Sector - Critical Component of Financial Sector 3.65 Insurance companies are a critical component of the financial sector and their smooth functioning is a necessary pre-condition to maintain financial stability, both domestically and globally. The sector faces several risks - risks related to solvency, investment returns, economic downturns, issues related to persistency11, etc. - though they are generally considered to be contributing less to systemic risk than the banks (Box 3.3). Box 3.3 Systemic Risks posed by the Insurance Sector Insurance sector does not contribute to systemic risk in the manner banking sector does. In contrast to banking activity, which is about maturity transformation, insurance sector collects its premia in advance rather than in arrears to fund its obligations. Such upfront funding reduces liquidity risks and reliance on leverage if the premia are priced correctly. Another differentiating feature of insurance sector is that policies are not like checking accounts, i.e. balances are not withdrawable on demand. Policy-holders are not allowed to withdraw money from their policy balances at will and such requests entail heavy penal charges. Therefore, the equivalent of a ‘bank run’ is uncommon in the insurance sector. Unlike banking, where a fall in value of assets significantly below that of liabilities causes failures immediately through bank runs, insolvency in insurance sector plays out in 'slow motion' over several years. This is due to the longer term claims and the much more dispersed payout dates on insurance products. Insurers typically have moreflexibility and time to deal with a crisis than do banks which have to meet deposit withdrawals in the short term. However, in case of insurance companies being a part of financial conglomerate, their bankruptcy can trigger systemic risk by casting doubt on the creditworthiness of the conglomerate's commercial bank, particularly if the bank is of sufficiently large size. Nonetheless, prohibition of multiple use of capital within a financial conglomerate effectively reduces this source of systemic risk. Inter-linkages of insurance activities with other financial institutions also could be a source of disruption in the financial system (the banking sector in particular). For instance, insurers are typically the major investors in many financial markets - equities and government securities and considerably affect stock market movements. In case of nonlife insurance business, where the premium ceded to foreign re-insurers is significant, the domestic exchange rate movements may be significant. Opening of the sector to private sector has led to higher growth and penetration of insurance in the country 3.66 With the opening up of the insurance sector in India in the year 2000, the industry has been witness to the entry of 22 players in the life segment and 15 in the non-life segment in addition to three insurers with license to operate on a standalone basis in the health insurance sector. The foreign participation in the industry is permitted through joint venture with an Indian promoter with FDI cap fixed at 26 per cent. The total number of insurers registered with the Insurance Regulatory and Development Authority (IRDA), the insurance sector’s regulator, as on March 31, 2011 stood at 48 viz., 23 life insurers, 19 general insurers, 3 standalone health insurance companies and 2 specialised companies - one dealing with credit insurance and crop insurance and the other being a reinsurer. Partially, as a result of these measures, the insurance penetration (as measured by the ratio of premium underwritten in a given year to the Gross Domestic Product (GDP) of the year) has increased from 2.3 in 2000 to 5.4 in 2009. 3.67 The linked12 and non linked business of the Life Insurance Industry accounted for 42.1 and 57.9 per cent of the first year premium underwritten in 2010-11 as against 8.5 and 91.5 per cent respectively in the year 2003-0413. 3.68 In the Indian context, insurance companies are required to adhere to a range of prudential norms viz. minimum capital, solvency ratio, exposure norms, investment exposure patterns, etc. for life and general insurers. Also, the insurance companies are not permitted to take positions in commodity market, to avail loans from banks and to invest policy holders’ funds abroad. As a first step towards ‘Risk Based Capital’ and hence ‘Risk Based Supervision’ system, life insurance companies are now required to submit ‘Economic Capital’ report to the IRDA as part of their annual actuarial and other reports. The ‘Economic Capital’ computation involves quantification of specific risks and assesses the insurer’s capital requirements with reference to various risks faced by the insurer. This regulatory framework facilitates management of systemic risks of the insurance sector. Nevertheless, in order to ensure that core insurance activities do not cause a systemic shock or trigger a systemic event, interlinkages of the sector with the rest of the financial system needs to be carefully monitored. Concluding Remarks 3.69 In India, increase in credit off take during 2010- 11 was above its long term trend. Credit growth appeared to be concentrated in certain sectors, which called for vigilance on this front to contain build up of risks/excesses. Recovery in credit growth has led to the expansion of the balance sheets of SCBs by about 19 per cent. However, slack growth in deposits have also resulted in continued dependence on borrowing and other short term means to fund the expansion. The rising structural mismatch in the maturity profile of the deposits and advances further contributed to the liquidity concerns. 3.70 Credit growth, despite being well diversified in many sectors, appeared to be weighed more by growth in retail, commercial real estate and infrastructure credit. A study of deployment of bank credit in thirty eight major industries showed a declining trend in exposure towards high risk industries. Off balance sheet exposures of banks continued to rise, with the foreign banks showing the largest increase with their notional exposure being more than 18 times their on-balance sheet exposures. 3.71 Capital adequacy of the SCBs continued to be strong, though there was a minor decline due to robust credit off take. Leverage ratio of banks in India remained comfortably above 3 per cent, as required under the Basel III norms. 3.72 Asset quality improved on the back of rebound in credit off take as credit growth outpaced the growth in NPAs. Going forward, the rapid credit growth also raised the possibility of large scale slippages, requiring continued vigilance. In this regard, the Reserve Bank’s countercyclical measures stipulating minimum NPA provisioning coverage ratio of 70 per cent on the level of NPAs as on September 30, 2010 may act as a cushion against possible rise in the NPAs. 3.73 The SCBs’ profitability showed improvement during 2010-11. However, on account of increase in provisioning towards pension liabilities, the staff expenses of PSBs increased sharply. Going forward, increasing interest rates, hike in the savings account interest rate amortisation of pension and gratuity liabilities and potentially enhanced provisioning requirements for NPAs may impact the profitability of banks. 3.74 The Banking Stability Map indicated that risks to liquidity had increased as at end March 2011 over March2010. The Banking Stability Indicator however showed strengthening of the banking sector on the stability front. 3.75 The financial soundness of the co-operative sector remained a matter of concern though consolidation measures continued to progress. The regulation of non banking finance companies has been progressively tightened in order to plug regulatory gaps and dissuade regulatory arbitrage. 3.76 The penetration of the insurance sector has increased after it was opened up to private players and FDI through joint ventures was permitted. The regulatory framework for insurance in India has ensured a robust and well regulated sector. While the essential structure of the insurance business entails relatively lower systemic risk, the interconnectedness of the sector with the banking and the rest of the financial system could be a source of disruption which may need careful monitoring. 1 Deposits comprise about 79 per cent of total liabilities and the credit portfolio (advances and investments) constituted about 87 per cent of the assets, the investments being about 30 per cent of the total assets. 2 Monetary tightening to address inflationary conditions has resulted in raising reference rates nine times, from 4.75 to 7.25 per cent (repo rate) between March 2010 – May 2011. Increase in the base rates of select banks was in the range of 1.25 to 2.0 per cent during the same period. 3 Reserve Bank announced a series of measures in the Second Quarter Review of Monetary Policy in November 2010 which included, inter alia, restriction on Loan to Value ratio of housing loans to 80 per cent (90 per cent for loans up to ` 20.00 lakh) to prevent excessive leveraging and increase in the risk weights on large housing loans (` 75 lakh and above) to 125 per cent, increase in standard asset provisioning on the outstanding amount of loans with ‘teaser’ interest rates from 0.40 per cent to 2.00 per cent etc. 4 Risk categorization of various industries is based on CRISIL industry risk scores for the periods while data for banking sector as on March 2011 has been used from Reserve Bank sources. 5 Priority sector credit is an arrangement of directed bank credit to such needy sectors which are worse off in absence of mandated channelisation of bank credit. Besides ensuring the growth of the financial sector, banks have been assigned a special role in the economic development of the country, with certain proportion of credit being directed to priority sectors like agriculture, MSE, education, housing, micro credit, weaker sections of population, etc. 6 Some of the banks that had been granted extension of time beyond the stipulated date i.e. September 30, 2010 for achieving the PCR of 70 percent on their request, have been advised to calculate the required provisions for 70 percent PCR as on September 30, 2010 and compute the shortfall there from. These banks have also been advised to build up the shortfall at the earliest. 7 /en/web/rbi/-/notifications/enhancement-of-rates-of-provisioning-for-non-performing-assets-and-restructured-advances-6415 8 The five composite indices represent the five dimensions of Soundness, Asset quality, Profitability, Liquidity and Efficiency. Each index, representing a dimension of bank functioning, takes a value between zero (minimum) and 1 (maximum). Each index is a relative measure during the sample period used for its construction, where a high value means the risk in that dimension is high. Therefore, an increase in the value of the index in any particular dimension indicates an increase in risk in that dimension for that period as compared to other periods. For each ratio a weighted average for the banking sector is derived, where the weights are the ratio of individual bank’s asset to total banking system assets. Each index is normalised for the sample period as ‘ratio-on-a-given-date minus minimum-value-in-sample-period divided by maximum-value-in-sample-period minus minimum-value-in-sampleperiod. A composite measure of each dimension is calculated as a weighted average of normalised ratios used for that dimension, where the weights are based on the marks assigned for supervisory assessment of CAMELS rating of the banks. 9 Latest data available. Data for 2010 is provisional. Data in case of certain States pertains to 2007-08 and 2008-09. 10 Latest off-site data available 11 Percentage of life insurance or other insurance policies remaining in force; percentage of policies that have not lapsed. The higher the percentage, the greater the persistency. Since it is an important measure of a company ’s retention of its life insurance business, most companies extend every effort to increase persistency. 12 These products (Unit Linked Insurance Plans-ULIPs) provide insurance cover to the policyholder and higher returns over the long-term, due to diversified investments in equity and debt instruments, ULIPs are different from traditional products in that the risks and rewards underlying the investment component of the premium underwritten by the insurance company are borne entirely by the policyholder. The policyholder determines the investment pattern from out of the various options, as to the proportion of debt, equity and money market instruments indicated by the insurer, based on his risk aptitude. |
||||||||||||||||||||||||||||||||||||||||||||||||||||||||||||||||||||||||||||||||||||||
પેજની છેલ્લી અપડેટની તારીખ:


