 IST,
IST,
Services and Infrastructure Outlook Survey for Q1:2021-22
Today, the Reserve Bank released the results of 29th round of its quarterly services and infrastructure outlook survey (SIOS). This forward-looking survey, being conducted since Q1:2014-15, captures qualitative assessment and expectations of Indian companies in the services and infrastructure sectors on a set of business parameters relating to demand conditions, price situation and other business conditions. 836 companies provided their assessment for Q1:2021-22 and expectations for Q2:2021-22 in the latest round of the survey, which was conducted during April-June 2021.1 Owing to uncertainty driven by the COVID-19 pandemic, an additional block was included in this round of the survey for assessing the outlook on key parameters for two quarters ahead as well as three quarters ahead. Highlights: A. Services Sector Assessment for Q1:2021-22
Expectations for Q2:2021-22
Expectations for Q3:2021-22 and Q4:2021-22
 B. Infrastructure Sector Assessment for Q1:2021-22
Expectations for Q2:2021-22
Expectations for Q3:2021-22 and Q4:2021-22

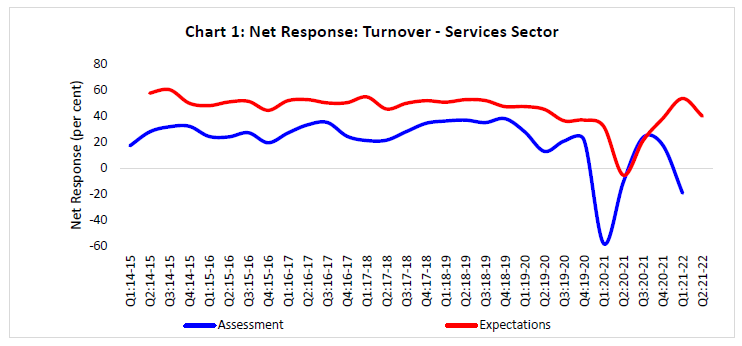
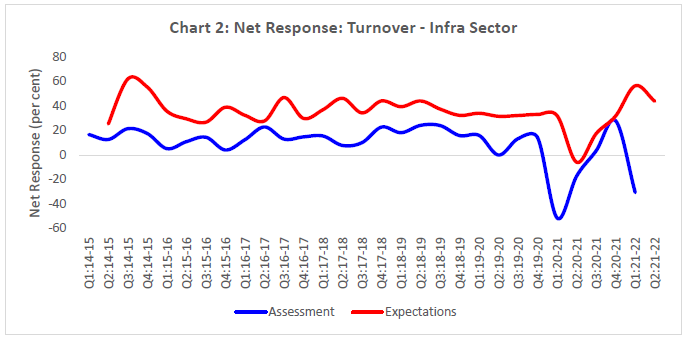
Note: Please see the excel file for time series data. Services Sector
Infrastructure Sector
1 The survey results reflect the respondents’ views, which are not necessarily shared by the Reserve Bank. Results of the previous survey round were released on the Bank’s website on April 07, 2021. This round of the survey was launched on April 22, 2021 and results were compiled with data received till June 30, 2021. 2 Net Response (NR) is the difference between the percentage of respondents reporting optimism and those reporting pessimism. It ranges between -100 to 100. Positive value indicates expansion/optimism and negative value indicates contraction/pessimism. In other words, NR = (I – D); where, I is the percentage response of ‘Increase/optimism’, D is the percentage response of ‘Decrease/pessimism’ and E is the percentage response as ‘no change/ equal’ (i.e., I+D+E=100). For example, increase in turnover is optimism whereas decrease in cost of inputs is optimism. | |||||||||||||||||||||||||||||||||||||||||||||||||||||||||||||||||||||||||||||||||||||||||||||||||||||||||||||||||||||||||||||||||||||||||||||||||||||||||||||||||||||||||||||||||||||||||||||||||||||||||||||||||||||||||||||||||||||||||||||||||||||||||||||||||||||||||||||||||||||||||||||||||||||||||||||||||||||||||||||||||||||||||||||||||||||||||||||||||||||||||||||||||||||||||||||||||||||||||||||||||||||||||||||||||||||||||||||||||||||||||||||||||||||||||||||||||||||||||||||||||||||||||||||||||||||||||||||||||||||||||||||||||||||||||||||||||||||||||||||||||||||||||||||||||||||||||||||||||||||||||||||||||||||||||||||||||||||||||||||||||||||||||||||||||||||||||||||||||||||||||||||||||||||||||||||||||||||||||||||||||||||||||||||||||||||||||||||||||||||||||||||||||||||||||||||||||||||||||||||||||||||||||||||||||||||||||||||||||||||||||||||||||||||||||||||||||||||||||||||||||||||||||||||||||||||||||||||||||||||||||||||||||||||||||||||||||||||||||||||||||||||||||||||||||||||||||||||||||||||||
પેજની છેલ્લી અપડેટની તારીખ:


