 IST,
IST,


Services and Infrastructure Outlook Survey for Q2:2022-23
Today, the Reserve Bank released the results of 34th round of its quarterly services and infrastructure outlook survey (SIOS) conducted during Q2:2022-23. This forward-looking survey captures qualitative assessment and expectations of Indian companies in the services and infrastructure sectors on a set of business parameters relating to demand conditions, price situation and other business conditions. In the latest round of the survey1, 593 companies provided their assessment for Q2:2022-23 and expectations for Q3:2022-23. Owing to uncertainties, an additional block was included in this round of the survey also for assessing the outlook on key parameters for two more additional quarters. Highlights: A. Services Sector Assessment for Q2:2022-23
Expectations for Q3:2022-23
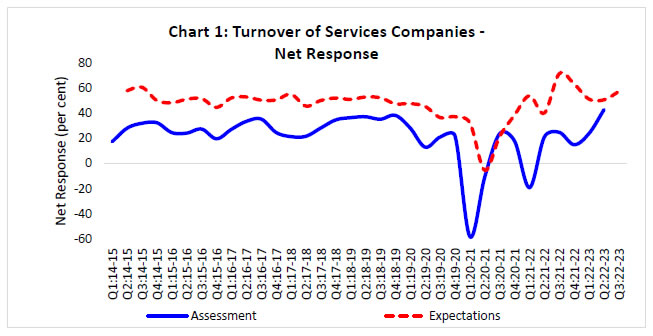 Expectations for Q4:2022-23 and Q1:2023-24
B. Infrastructure Sector Assessment for Q2:2022-23
Expectations for Q3:2022-23
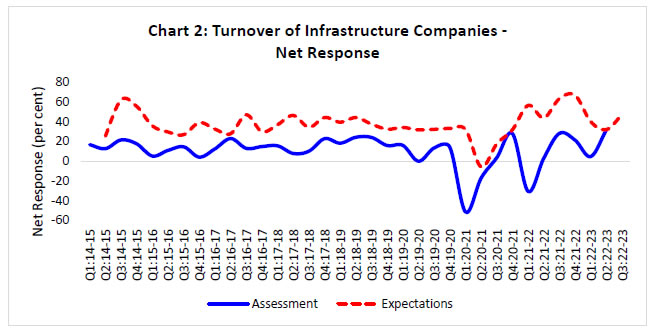 Expectations for Q4:2022-23 and Q1:2023-24
Note: Please see the excel file for time series data. Services Sector
Infrastructure Sector
1 The survey results reflect the respondents’ views, which are not necessarily shared by the Reserve Bank. Results of the previous survey round were released on the Bank’s website on August 05, 2022. 2 Net Response (NR) is the difference between the percentage of respondents reporting optimism and those reporting pessimism. It ranges between -100 to 100. Positive value indicates expansion/optimism and negative value indicates contraction/pessimism. In other words, NR = (I – D); where, I is the percentage response of ‘Increase/optimism’, D is the percentage response of ‘Decrease/pessimism’ and E is the percentage response as ‘no change/ equal’ (i.e., I+D+E=100). For example, increase in turnover is optimism whereas decrease in cost of inputs is optimism. | |||||||||||||||||||||||||||||||||||||||||||||||||||||||||||||||||||||||||||||||||||||||||||||||||||||||||||||||||||||||||||||||||||||||||||||||||||||||||||||||||||||||||||||||||||||||||||||||||||||||||||||||||||||||||||||||||||||||||||||||||||||||||||||||||||||||||||||||||||||||||||||||||||||||||||||||||||||||||||||||||||||||||||||||||||||||||||||||||||||||||||||||||||||||||||||||||||||||||||||||||||||||||||||||||||||||||||||||||||||||||||||||||||||||||||||||||||||||||||||||||||||||||||||||||||||||||||||||||||||||||||||||||||||||||||||||||||||||||||||||||||||||||||||||||||||||||||||||||||||||||||||||||||||||||||||||||||||||||||||||||||||||||||||||||||||||||||||||||||||||||||||||||||||||||||||||||||||||||||||||||||||||||||||||||||||||||||||||||||||||||||||||||||||||||||||||||||||||||||||||||||||||||||||||||||||||||||||||||||||||||||||||||||||||||||||||||||||||||||||||||||||||||||||||||||||||||||||||||||||||||||||||||||||||||||||||||||||||||||||||||||||||||||||||||||||||||||||||||||||||

આ પેજ શેર કરો:


રિઝર્વ બેંક ઑફ ઇન્ડિયા મોબાઇલ એપ્લિકેશન ઇન્સ્ટૉલ કરો અને લેટેસ્ટ ન્યૂઝનો ઝડપી ઍક્સેસ મેળવો!
અમારી એપ ઇન્સ્ટોલ કરવા માટે QR કોડ સ્કેન કરો


પેજની છેલ્લી અપડેટની તારીખ:


