 IST,
IST,


Trends in Total Factor Productivity of Manufacturing Sector in West Bengal : A Sectoral and Temporal Analysis
This paper seeks to examine the overall industrial scenario of West Bengal for the past three decades. The paper studies the productivity of capital and labour for the two-digit industry groups and the total factor productivity (TFP) of the manufacturing sector of West Bengal as a whole vis-à-vis all-India and also for some selected groups of industries for West Bengal. West Bengal has lost its earlier status of one of the highly industrialised States of the country. Its share to all-India net value added, share of employment and factories has come down drastically. Profitability of total manufacturing sector has gone down. Productivity of capital of the manufacturing sector has declined, while labour productivity has increased. However, the latter has increased mainly due to a few industry groups, which are highly capital intensive and have contributed around 85 per cent of the profit of the total manufacturing sector. TFP of the West Bengal manufacturing sector as a whole has been declining, while it has been increasing in case of India. TFP of six industry groups which played a dominant role during the early 1960s has gone down except Jute industry, which itself is a dying industry. That means no new industry groups have come up to take up the position of these industries, which have been performing badly. Therefore, while the State of West Bengal has shown an impressive improvement in case of rural sector, industrial slowdown has not been arrested as yet in the State.
JEL Classification : D24, O33
Keywords : Production Function, Labour Productivity, Capital productivity, Total Factor Productivity Growth (TFPG)
Introduction
West Bengal in general and Calcutta in particular was the ‘commercial and industrial hub’ of the whole of Eastern India before 1947 (Bagchi 1998). The State was a leader in respect of concentration of industrial capital. The State’s share in all-India stock of capital in the CMI (Census of Manufacturing Industries) sector was 24.6 per
* Research Officer in the Department of Economic Analysis and Policy, Reserve Bank of India. The views expressed in the paper are personal views of the author and need not represent the views of the institution he is working with.
cent in 1950 (Banerjee 1998). Coal, jute, tea, engineering and iron and steel were the major industries of the State on the eve of Independence. In 1946 West Bengal had a larger number of factories and factory employees than any other province in India. However the situation had started changing from the partition of Bengal. Two major industries, viz., jute and tea had been adversely affected by the partition. Infrastructure sector, particularly loss of Chittagong port, had also got adversely affected due to this cause. Migration from erstwhile East Pakistan also created large pressure. In the process, the State lost its industrial base. It not only fell far behind some States like Gujarat, Maharashtra, Karnataka and Andhra Pradesh, but the State had to suffer a process of deindustrialisation as well1 . Now the State has come a long way since the pre-Independence period. But the situation does not seem to have changed; rather it appears to have become worse as discussed in the following sections.
The objective of the paper is to analyse the present condition of the industrial sector of the State. The study tries to examine the factor productivity growth, especially of capital and labour across industry groups in West Bengal. The most important aspect of the paper will be estimates of total factor productivity (TFP) growth for West Bengal, supposed to be the first comprehensive attempt in this area.
The remainder of the paper is structured as follows. Section I discusses the theoretical background and the methodology of the study. Section II discusses the structure, composition and growth of industrial sector in West Bengal. Section III deals with capital intensity, and capital and labour productivity. TFP is discussed in Section IV. Concluding observations are presented in the final Section.
Section I
Measuring Productivity
Although technological progress did not get importance in the work of classical economists like Malthus, Ricardo and Mills, it is considered to be a major determinant of economic growth today. Subsequently, in the works of Marx and Scumpeter it got some importance with varied degrees. Later on, the concept came to the fore after the works of Tinbergen (1942), Schmookler (1952), Kendrick (1956), Fabricant (1954), Abramovitz (1956) and Solow (1957).
Any growth in output that is not explained by some index of input growth is attributed to changes in technology or more broadly productivity. Thus, TFP growth is a catch-all measure that captures changes in efficiency in addition to pure technical change in the sense of shifts in the production function. As has been aptly pointed out by Goldar (1986) that since there are constraints to resource expansion in developing countries, a high rate of industrial growth to be achieved and sustained over a long period requires substantial improvement in total factor productivity.
TFP may be defined as the ratio of output to a weighted combination of inputs. "Productivity growth is generally understood to represent the exogenous shift of a frontier (best practice) production function. The distance from the frontier technology is X-inefficiency" (Srivastava 1996). Therefore, a precise decomposition of growth of output into the contribution of change in inputs and that of total productivity is based on the economic theory of production function.
There are two main approaches in estimating the productivity, viz., Production Function Approach (PFA) and Growth Accounting Approach (GAA)2 . However, as discussed in Trivedi et al. (2000), there are various problems associated with the production function approach like multicollinearity, autocorrelation and degree of freedom. In order to avoid those problems we have restricted our analysis of TFP to GAA only.
The key feature of the GAA is separation of change in production on account of changes in the quantities of factors of production from residual influences, which include technological progress, learning by doing, etc. Multi Factor Productivity (MFP) actually surrogates these residual influences. The genesis of this approach can be traced back to Tinbergen (1942) and Solow (1957). Basically there are three main indices used in the GAA. These are (i) Kendrick Index (KI) (ii) Solow Index (SI) and (iii) Translog Index (TLI). However, KI and SI suffer from some limitations3 . In contrary, TI is superior to both KI and SI because TI numbers are symmetric in data of different time periods and also satisfy the factor reversal test approximately4 . It is based on Translog Production Function characterised by constant returns to scale. It allows for variable elasticity of substitution and does not require the assumption of Hicks-neutrality.
The translog production function of output (Y) emerging from use of labour (L), capital (K) and time (T) is written as

It has been shown by Diewert (1976) that indexes formed in such a fashion are exact for a translog aggregator function and that they are exact only for a translog aggregator function.
Estimating Translog Production Function
The discrete approximation of the Translog Production Function in the form of Translog Index has been used in most of the recent studies on the measurement of productivity in the Indian industries5. The Translog Index can be defined as the following:
Where, V is real value added, w denotes the share of labour in nominal value added, L and K indicate labour and capital, respectively.
The equation is based on the general neo-classical production function for which the elasticity of substitution need not be infinite, equal to unity or even constant. The above equation actually measures the difference between the rate of growth of real value added and the rate of growth of factor inputs.
Data, Variables and Coverage
This study is based on the Annual Survey Industries (ASI) data. Net value added at constant prices is taken as the measure of output. Number of employees (including workers and persons other than workers) is taken as the measure of labour input. However, there is no unique measure of capital. Hence several methods are applied in estimating capital stock. In this study the perpetual inventory accumulation method (PIAM) has been used for generating the series on capital stock, which has been used in various studies. The PIAM requires the estimates of capital stock for a benchmark year and investment in the subsequent years. The time series on capital stock at current prices has been generated by using the following equations:

I is the gross capital formation/investment, B is the book value of fixed capital, D is depreciation, K is the stock of capital at current prices. Subscript 't' has been used to denote time. Data on all the variables mentioned above are available in ASI.
The study covers the period from 1967-68 to 1999-2000. Data prior to this period is not available in the format required for calculating the index. Initially the TFPG is calculated for the whole manufacturing sector in West Bengal vis-à-vis all-India manufacturing as a whole to assess the position of the manufacturing sector in West Bengal as against the all-India average. Subsequently the TFPG is calculated for six selected industries. Selection has been done on the basis of contribution to total net value added. These six industry groups have played a pivotal role in the industrial arena of the State. The intention here is to observe their relative position vis-à-vis other industries in order to investigate whether these industries are slipping from their strong position. If it is really so, then it is also worth investigating whether any new industry group is taking up their position.
Section II
Structure and Growth of Industry in West Bengal
The sectoral composition of State Domestic Product in West Bengal shows some structural transformation in the State during the past four decades (viz., 1960-61 to 1999-2000). While the share of primary sector in NSDP has gone down marginally from 39.2 per cent in 1960-61 to 38.7 per cent in 1999-2000, the share has gone down substantially (by around 10 percentage points) in case of the secondary sector. The decline of share in NSDP is more pronounced in case of the manufacturing sector. It has gone down from over 25.2 per cent in 1960-61 to mere 10.0 per cent in 1999-2000. However, the tertiary sector has gained the share at the cost of both manufacturing and agriculture over this period. At the all-India level also, there has been a change in the structure of the economy. However, in this case the scenario is a bit different from West Bengal. Unlike West Bengal, the share of secondary sector has gone up from 19.4 per cent to 21.6 per cent during the same period, notwithstanding the fact that the share of manufacturing sector has slipped downward marginally. However, like the case of West Bengal, at the all-India level, the shares of the primary sector in general and agriculture in particular have gone down to a larger extent from 48.2 per cent and 44.4 per cent, respectively, during 1960-61 to 30.5 per cent and 26.3 per cent, respectively, during 1999-2000. Tertiary sector, on the other hand, has increased its share in case of all-India as is the case with West Bengal from 32.4 per cent in 1960-61 to 48.0 per cent in 1999-2000 (Table 1). Furthermore, the state’s share in all-India NDP has gone down, albeit marginally, from 7.7 per cent in 1960-61 to 7.6 per cent in 1999-2000.
The decline in West Bengal’s stronghold position in respect of industrial status can be gauged from the declining share of secondary sector, in general, and manufacturing sector, in particular, in all-India NDP. It implies that the other States have come forward gradually in respect of industrial development and surpassed the leading position of West Bengal. It can be observed from Table 2 that the relative share of secondary sector has gone down from 10.9 per cent in 1960-61 to 6.4 per cent in 1999-2000. Furthermore, the share of the State’s total manufacturing sector in all-India NDP has also gone down from 13.1 per cent in 1960-61 to a mere 6.6 per cent in 1999-2000 entirely due to the registered manufacturing sector.
Structural change can also be noticed from the contribution of different industries in net value added. The contribution of major industries of the manufacturing sector at the 2-digit level (2-3) was more than 90 per cent of the total manufacturing sector during 1979-80.
Table 1: Composition of NSDP of West Bengal vis-à-vis All-India NDP
|
(Per cent) |
||||||||||
|
1960-61 |
1970-71 |
1980-81 |
1990-91 |
1999-2000 |
||||||
|
West |
All |
West |
All |
West |
All |
West |
All |
West |
All |
|
|
Bengal |
India |
Bengal |
India |
Bengal |
India |
Bengal |
India |
Bengal |
India |
|
|
1 |
2 |
3 |
4 |
5 |
6 |
7 |
8 |
9 |
10 |
11 |
|
1. Primary |
39.2 |
48.2 |
45.1 |
48.0 |
38.7 |
41.3 |
33.6 |
34.7 |
38.7 |
30.5 |
|
of which: |
||||||||||
|
Agriculture |
34.7 |
44.4 |
41.5 |
44.2 |
34.6 |
36.3 |
28.6 |
29.9 |
33.7 |
26.3 |
|
2. Secondary |
27.6 |
19.4 |
22.7 |
19.9 |
24.7 |
23.0 |
26.2 |
25.5 |
18.1 |
21.6 |
|
of which: |
||||||||||
|
Manufacturing |
19.8 |
7.3 |
12.9 |
7.6 |
14.0 |
9.1 |
9.7 |
11.0 |
4.5 |
8.5 |
|
(Registered) |
||||||||||
|
Manufacturing |
5.4 |
7.5 |
4.7 |
6.6 |
4.7 |
7.8 |
7.8 |
7.1 |
5.5 |
5.2 |
|
(Unregistered) |
||||||||||
|
Manufacturing |
25.2 |
14.8 |
17.5 |
14.2 |
18.7 |
16.9 |
17.5 |
18.1 |
10.0 |
13.6 |
|
(Total) |
||||||||||
|
3. Tertiary |
33.3 |
32.4 |
32.2 |
32.2 |
36.6 |
35.7 |
40.2 |
39.8 |
43.2 |
48.0 |
|
Total |
100.0 |
100.0 |
100.0 |
100.0 |
100.0 |
100.0 |
100.0 |
100.0 |
100.0 |
100.0 |
Almost two decades later, the contribution had come down to 59 per cent. That means more than 40 per cent of net value added is contributed by those industries, which are outside the domain of the manufacturing sector. However, within the manufacturing sector there has not been any significant change in the contribution to net value added with a few exceptions. The significant change has occurred only in case of the jute industry and manufacture of transport equipment and parts whose contributions have come down to 10.8 per cent and 1.0 per cent, respectively, in 1997-98 from 23.3 per cent and 10.5 per cent, respectively, in 1979-80. On the other hand, the share went up marginally in case of leather and leather products and rubber, plastic, petroleum and coal products.
In brief, although there has been a structural change in the State, the industry, as a whole, could not gain much during the last 26 years. This is evident from both the share of the State in all-India NSDP
Table 2: Share of Manufacturing Sector of West Bengal in All-India NDP
|
(Per cent) |
|||||
|
1960-61 |
1970-71 |
1980-81 |
1990-91 |
1999-2000 |
|
|
1 |
2 |
3 |
4 |
5 |
6 |
|
1. Manufacturing - Registered |
21.0 |
14.7 |
12.4 |
6.5 |
4.4 |
|
2. Manufacturing - Unregistered |
5.5 |
6.1 |
4.8 |
8.2 |
10.4 |
|
3. Manufacturing - Total |
13.1 |
10.7 |
8.2 |
7.2 |
6.6 |
|
4. Secondary |
10.9 |
9.9 |
10.4 |
7.7 |
6.4 |
|
Source: National Accounts Statistics, Government of India, various issues. |
|||||
Table 3: Index of Industrial Production -Compound Growth Rate for West Bengal vis-à-vis All-India
|
(Per cent) |
||||
|
Period |
Mining & |
Manufacturing |
Electricity |
General |
|
Quarrying |
||||
|
1 |
2 |
3 |
4 |
5 |
|
1970-71 to 1980-81 (at 1970=100) |
||||
|
West Bengal |
0.01 |
1.82 |
1.43 |
1.62 |
|
All-India |
4.26 |
4.05 |
7.33 |
4.42 |
|
1980-81 to 1992-93 (at1980-81=100) |
||||
|
West Bengal |
0.10 |
1.84 |
8.80 |
2.23 |
|
All-India |
6.94 |
6.41 |
8.63 |
6.75 |
|
1993-94 to 2000-01 (at 1993-94=100) |
||||
|
West Bengal |
0.78 |
3.37 |
6.59 |
3.62 |
|
All-India |
3.98 |
7.63 |
6.40 |
7.20 |
|
Sources : 1.
Economic Review, Government of West Bengal, various issues. |
||||
and share in all-India net value added in total manufacturing sector. A similar picture emerges from an analysis of the trends in the IIP of the State (Table 3).
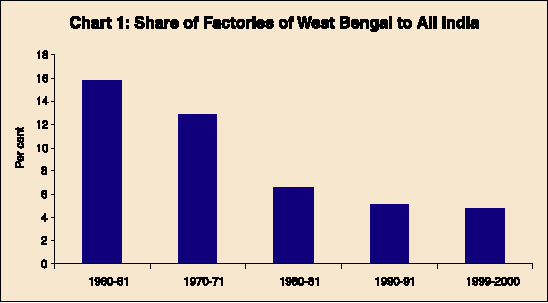
Concomitantly, the share of the State in the country’s total number of factories, employment and value added has witnessed a gradual decline. The share of factories has gone down from 15.8 per cent in 1960-61 to 4.8 per cent in 1999-2000 (Chart 1). Similarly, the share

in net value added has gone down from 23.2 per cent over the decade of 1960s to 5.4 per cent during the decade of 1990s, while that of employment has gone down from 23.1 per cent to 8.4 per cent over the same period (Charts 2 and 3 and Table 4).
During the period 1973-74 to 1999-2000, the net value added (NVA) of the total manufacturing sector grew at an annual compound rate of 1.8 per cent, while employment had grown at an annual compound rate of (-)1.3 per cent. However, fixed capital had grown at a relatively high annual compound rate of 5.2 per cent. Industry-wise performance is presented in Table 5.

Table 4: Percentage Share of West Bengal in All-India
|
Period |
NVA |
Employment |
|
1 |
2 |
3 |
|
1959-60 |
23.2 |
23.1 |
|
1960-61 to 1969-70 |
20.1 |
21.3 |
|
1970-71 to 1979-80 |
12.8 |
14.9 |
|
1980-81 to 1989-90 |
8.5 |
10.8 |
|
1990-91 to 1999-2000 |
5.4 |
8.4 |
Industrial Deceleration
The industries which played a vital role in West Bengal during the period of 1960s were food products (20-21), textiles (23-25), rubber plastic and petroleum products (30), basic chemical and chemical products (31), basic metal and alloy (33), and manufacture of machinery and equipment (including electrical machinery) (35-36). All these industries contributed significantly to all India net value added in respective industries during 1960. However, over the next four decades, the share of these industries in net value added to all-India level fell sharply. The share of textiles went down to 12.3 per
Table 5: Industry-wise Performance of Major Indicator (1973-74 to 1999-2000)
|
Negative |
Below |
Between |
Above 4 per cent |
Above |
|||
|
2 |
per cent |
2 and 4 |
and below |
7 |
per cent |
||
|
per cent |
7 per cent |
||||||
|
1 |
2 |
3 |
4 |
5 |
6 |
||
|
NVA |
31,37 |
23-25,34,35- |
28,29,33 |
20-21, 26, 30, |
22 |
||
|
36,38 |
27, 32 |
||||||
|
VO |
37 |
23-25 |
28,35-36 |
20-21, 29, 30, |
22, 26, 27 |
||
|
31, 32, 33, 34, 38 |
|||||||
|
EMO |
28, 31, 35-36, |
23-25, 29, 34, |
20-21, 22, 26, |
||||
|
37 |
38 |
27, 30, 32, 33 |
|||||
|
TE |
23-25, 28, 29, |
20-21, 26, 30 |
27, |
22 |
|||
|
31, 32, 33, 34, |
|||||||
|
35-36,37,38 |
|||||||
|
FC |
37 |
31 |
23-25, 30, 32, 33, |
20-21, 22, 26, |
|||
|
34, 35-36,38 |
27, 28, 29 |
||||||
|
Note :1.
NVA : Net Value Added; VO: Value of Output; EMO: Emoluments; |
|||||||
cent in 1999 from 16.2 per cent in 1960 while that of chemical products went down to merely 0.7 per cent from 16.4 per cent over the same period of time (Table 6). Further, the share of food products fell to 2.8 per cent in 1999 from 13.5 per cent in 1960. While machinery and equipment including electricity contributed 33.9 per cent during 1960, the joint contribution of these two industry groups to value added came down to only 3.8 per cent in 1999. Rubber, plastic and petroleum products showed an even more dismal picture as their contribution came down from 43.2 per cent in 1960 to a mere 1.7 per cent in 1999. On the other hand, the contribution to all-India net value added increased for some industries such as food products; rubber, plastic, petroleum; and basic metal and alloys.
It is also interesting to note that the share of manufacturing sector in total net value added has gone down from 90.0 per cent in 1970 to 59.2 per cent in 1997-98, while in case of India, the fall has been relatively moderate (from 88 per cent to 81.2 per cent during the same period). The industries which have taken up the share from core manufacturing sector are electricity, gas, water supply, non-conventional energy, storage & warehousing services, sanitation, etc. As we have seen in Table 3, the IIP growth in electricity has gradually
Table 6: Share of Net Value Added of Select Industries in West Bengal to All-India
|
Year |
Food |
Textiles |
Rubber |
Basic |
Basic |
Manufacture of |
All |
|
Products |
(23+24+25) |
Plastic, |
Chemical and |
Metal |
machinery |
||
|
(20-21) |
Petroleum |
Chemical |
and Alloy |
including elec- |
|||
|
etc. |
Products |
(33) |
trical machinery |
||||
|
(30) |
(31) |
(35-36) |
|||||
|
(1) |
(2) |
(3) |
(4) |
(5) |
(6) |
(7) |
(9) |
|
1960 |
13.5 |
16.2 |
43.2 |
16.4 |
10.6 |
33.9 |
22.3 |
|
1965 |
10.8 |
19.7 |
48.1 |
12.5 |
8.5 |
29.3 |
21.6 |
|
1970 |
8.5 |
16.5 |
30.2 |
8.6 |
6.7 |
16.1 |
14.0 |
|
1974* |
8.6 |
15.2 |
15.1 |
7.6 |
16.6 |
14.8 |
12.9 |
|
1980 |
3.9 |
16.7 |
7.2 |
5.7 |
16.5 |
10.7 |
11.3 |
|
1985 |
6.5 |
11.2 |
5.2 |
3.9 |
17.0 |
6.3 |
8.6 |
|
1990 |
4.6 |
9.4 |
4.5 |
6.5 |
8.5 |
6.4 |
6.2 |
|
1995 |
2.4 |
9.8 |
2.3 |
4.0 |
8.3 |
6.1 |
4.7 |
|
1999 |
2.8 |
12.3 |
1.7 |
0.7 |
6.2 |
3.8 |
3.7 |
|
* Data for 1975 is not available. |
|||||||
increased from 1970-71 to 1999-2000. That means contribution of electricity in overall industrial sector has been high in West Bengal. But it is also true that the growth of electricity is not high enough to generate high industrial growth. This is evident from the low industrial growth depicted in Table 3.
Section III
Capital Intensity, Productivity of Labour and Capital
Capital Intensity
Factor intensity can be discussed with the help of fixed capital per employee and value added per employee. However, there is no unique measurement of capital intensity or labour intensity. Industries can be grouped into labour-intensive or capital-intensive on the basis of average capital-labour ratio (K/L). If the capital-labour ratio of a particular industry is above the average then the industry may be considered as a capital-intensive one. However, this methodology is admittedly arbitrary in nature since there is no specific capital-labour ratio for the industries.
The average capital per employee for the entire manufacturing sector was Rs.190.1 in 1973-74, Rs.184.4 in 1980-81, Rs.251 in 1990-91 and Rs.1070.2 in 1999-2000 at constant prices (1981-82 = 100). As per the norms discussed above, the industries with capital per employee above these respective averages may be regarded as capital-intensive and those with capital per employee below them as labour-intensive. The industries coming under each of these categories in 1973-74 and 1999-2000 are listed below:
|
Industry Category |
||
|
i) |
Capital-intensive industries |
|
|
1973-74 |
28, 30, 31, 33, 35-36, 37 |
|
|
1999-2000 |
28, 30, 31, 33, 35-36 |
|
|
ii) |
Labour-intensive industries |
|
|
1973-74 |
20-21, 22, 23-24-25, 26, 27, 29, 32, 34, 38 |
|
|
1999-2000 |
20-21, 22, 23-24-25, 26, 27, 29, 32, 34, 37, 38 |
It may be observed from the above list that there has not been any significant change in the structure of industries by factor intensity over the period. However, there is only one exception. Manufacture of transport equipment and parts (37), which was in the capital-intensive category during 1973-74 shifted to the labour-intensive category in 1999-2000.
The share of capital-intensive industries in the manufacturing sector also declined over the three-decade period. During the year 1973-74, the capital intensive industries contributed 58.1 per cent to both total value added and output and 45.5 per cent to employment. In 1999-2000 the share of value added had gone down to 41.9 per cent, output to 53.7 per cent and employment to 35.9 per cent. That means labour-intensive industries provided employment to more than 64 per cent of total employment in the manufacturing sector by using lesser quantity (around 30 per cent) of the capital asset. However, it is interesting to note that the share of profit of the capital intensive industries increased from 61.8 per cent in 1973-74 to 85.5 per cent in 1999-2000. The share of profit of the labour intensive industries concomitantly fell from 38.2 per cent to 14.5 per cent. It is worth mentioning that out of 17 two-digit industry groups only five were capital intensive in 1999-2000. Therefore, only five industry groups are contributing over 85 per cent of total profit in the manufacturing sector in West Bengal, whereas the rest 12 industry groups are contributing below 15 per cent.
Productivity of Labour
Labour productivity is considered to be one of the oldest and widely used measures of productivity (Trivedi, et al. 2000). "The wide usage of labour productivity is due to the fact that it can be used as proxy for the amount of goods available for consumption per labourer. Hence increase in labour productivity is very often regarded as an end in itself and in such a situation the role of capital gets reduced merely to that of enabling labour productivity to rise." Moreover, in comparison to per capita real GDP, labour productivity is viewed as a superior indicator since the former ignores importance of working hours per person/employment rates in the growth process (Maddison, 1987). In many industrialised countries labour productivity is calculated as the real value added per man-hour. However, most of the studies in India are based on data on number of employees or workers for estimation of labour productivity. Following this convention, we have also used the data on number of employees in calculating labour productivity.
The growth rate of labour productivity in the manufacturing sector as a whole increased from 1.6 per cent in 1970s to 2.6 per cent in the 1980s and further to 5.7 per cent in 1990s. During 1970-71 to 1999-2000, it increased at an annual compound growth rate of 2.5 per cent. Out of 15 two-digit industry groups only 4 groups (viz., manufacture of beverages, tobacco and related products; manufacture of wood and wood products; manufacture of basic chemical and chemical products; and manufacture of transport equipment and parts) recorded negative annual compound growth in labour productivity (Table 7).
Productivity of Capital
Generally there is an inverse relationship between capital intensity and output to capital ratio (Srivastava, 1996). However, it is found that all the industries, both labour and capital intensive, have shown declining capital productivity. The fastest decline in the output to capital ratio is in manufacture of chemical and chemical products (except products of petroleum and coal) (31), manufacture of leather, leather and fur products (29) and manufacture of paper and paper
Table 7: Growth Rate of Labour Productivity of the Manufacturing Sector (Industry-wise) in West Bengal
|
Period/Industry Groups |
20-21 |
22 |
23-25 |
26 |
27 |
28 |
|
1970-71 to 1999-2000 |
2.3 |
-0.3 |
2.1 |
3.9 |
-3.2 |
3.8 |
|
Period/Industry Groups |
29 |
30 |
31 |
32 |
33 |
34 |
|
1970-71 to 1999-2000 |
2.5 |
5.5 |
-0.2 |
3.2 |
4.7 |
1.8 |
|
Period/Industry Groups |
35-36 |
37 |
38 |
Manufacturing |
||
|
Sector |
(Total) |
|||||
|
1970-71 to 1999-2000 |
3.2 |
-0.2 |
2.5 |
2.5 |
||
|
Note: Descriptions of industrial codes given in Annex 2. |
||||||
products, printing and publishing and allied products (28). The slowest decline is observed in manufacture of beverages, tobacco and tobacco products (22), manufacture of textile products (26) and manufacture of rubber, plastic, petroleum and coal products (30).
Profitability of Industrial Sector
The industrial sector has suffered low profitability since 1979-80 and in fact, negative profitability during 1983-84 to 1990-91 (excepting 1987-88), whereas at the all-India level the scenario is entirely opposite (Table 8). It has been hypothesized by Ray (1996) that loss-making units in the public sector (assuming that private sector firms cannot continue to exist as loss making ones in the long run) perhaps dominated profit making firms in West Bengal leading to this perverse phenomenon of persistent negative profitability of the overall industrial sector. However, this hypothesis appears to be only partly true. This is because, as has been observed in the early part of discussion, there has been a gradual decline in number of factories in West Bengal. As a result, the share of factories in total has gone down drastically. That means, the industrial units incurred
Table 8: Profitability: Profits/Output in terms of ASI Aggregate Data
|
(Per cent) |
|||||
|
Year |
West Bengal |
India |
Year |
West Bengal |
India |
|
1 |
2 |
3 |
4 |
5 |
6 |
|
1973-74 |
6.6 |
11.5 |
1987-88 |
2.1 |
2.1 |
|
1974-75 |
5.9 |
8.3 |
1988-89 |
-4.0 |
4.0 |
|
1975-76 |
4.0 |
17.2 |
1989-90 |
-3.9 |
3.9 |
|
1976-77 |
3.7 |
17.2 |
1990-91 |
-0.8 |
4.2 |
|
1977-78 |
3.3 |
16.5 |
1991-92 |
-1.3 |
3.2 |
|
1978-79 |
3.5 |
6.7 |
1992-93 |
-1.5 |
4.0 |
|
1979-80 |
3.5 |
5.9 |
1993-94 |
2.1 |
6.7 |
|
1980-81 |
1.1 |
3.4 |
1994-95 |
0.6 |
7.2 |
|
1981-82 |
-0.2 |
4.6 |
1995-96 |
-0.4 |
6.6 |
|
1982-83 |
0.4 |
4.1 |
1996-97 |
2.2 |
7.7 |
|
1983-84 |
-1.5 |
4.9 |
1997-98 |
5.7 |
5.1 |
|
1984-85 |
-1.6 |
3.1 |
1998-99 |
0.2 |
6.7 |
|
1985-86 |
-0.4 |
2.9 |
1999-2000 |
-6.7 |
5.3 |
|
1986-87 |
-1.8 |
3.1 |
|||
|
Source : Estimated from time series data on ASI (Various Issues). |
|||||
losses over time and as a process became sick and finally had to close down the unit. Hence the obvious economic consequence has been exit of all inefficient industrial units. Since the exit process occurred in a phased manner it perhaps led to a gradual and systematic decline of aggregate industrial output and employment - a process termed de-industrialisation.
Section IV Total Factor Productivity
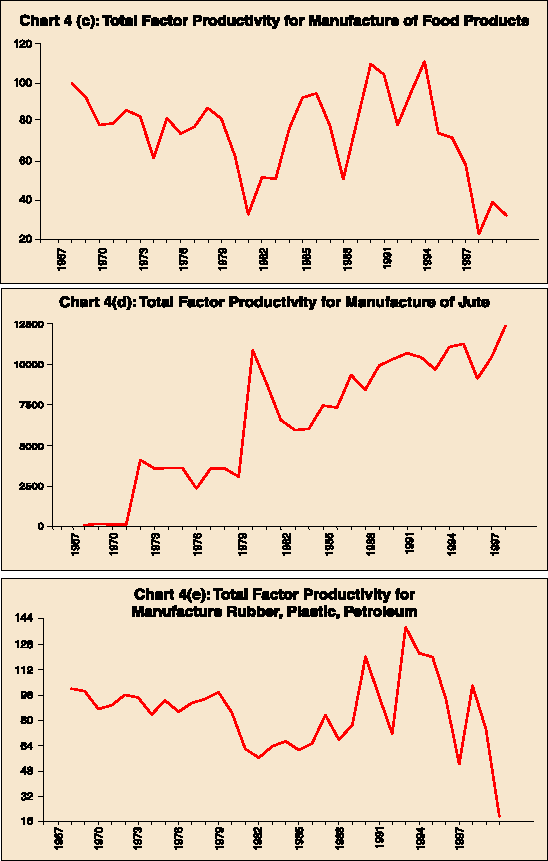
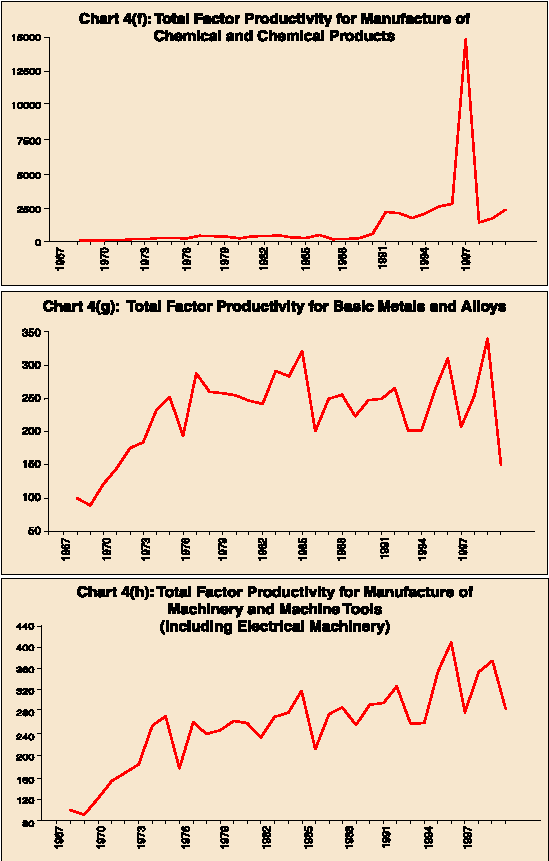
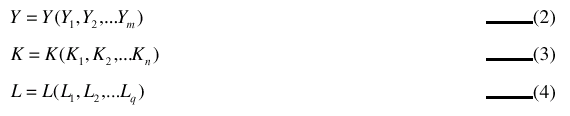
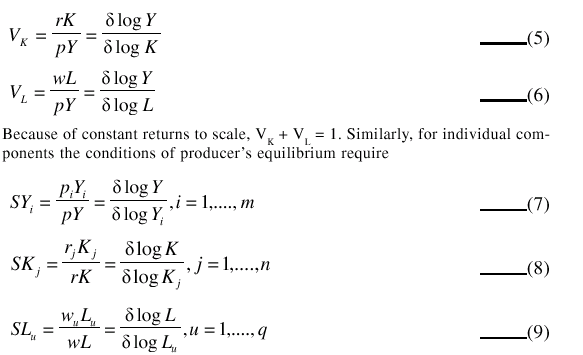
The total factor productivity of West Bengal decreased gradually during the period 1966 to 1999 in contrast to the rising trend for India as a whole. As stated earlier, we have tried to examine the total factor productivity of six industry groups, which played dominant role during the early 1960s. It can be seen that except jute all the remaining five industry groups have shown declining TFP growth. Machinery and machine tools initially showed rising trend, but after 1970s it remained stagnant (Charts 4a-4f). The TFP growth contribution to output is negative for two out of six industry groups (Table 9). For the remaining four groups, however, the TFP growth
Table 9: Trend Growth Rates of Productivity of Various industries 1966-1999 (Per cent per annum)
|
Industry Group |
Trend Growth |
Trend Rates of |
TFP contribution |
|
Rate of Real |
Growth of |
to Output |
|
|
Value Added |
TFP |
growth |
|
|
1 |
2 |
3 |
4 |
|
Manufacture of Food products |
2.0 |
-1.4 |
-70.0 |
|
Manufacture of jute, hemp etc. |
13.1 |
12.0 |
91.6 |
|
Manufacture of Rubber, Plastic, |
0.4 |
-0.8 |
-200.0 |
|
Petroleum etc. |
|||
|
Manufacture of Chemical and |
7.9 |
10.6 |
134.2 |
|
Chemical Products |
|||
|
Basic Metal and Alloys |
3.3 |
1.6 |
48.5 |
|
Manufacture of Machinery, Machine |
3.2 |
2.9 |
90.6 |
|
Tools (including electrical machinery) |
|||
|
Manufacturing Sector |
2.1 |
-1.2 |
-57.1 |
|
(West Bengal) |
|||
|
Manufacturing Sector (All India) |
6.3 |
4.6 |
73.0 |
|
Source : Estimated from time series data on ASI (Various Issues). |
|||
contribution to output growth is substantial. Manufacture of chemical and chemical products recorded more than 100 per cent contribution from TFP growth. For the period 1966-1999, TFP contribution to output growth is negative for the whole manufacturing sector, whereas at the all-India level TFP contribution to manufacturing sector output is positive and significant.
Section V Conclusion
The study shows that West Bengal has gradually lost its stronghold position once enjoyed during the early 1960s. The State's shares in net value added, employment and number of factories have gone down drastically over the years. Looking at the 2-digit level industry group, it is observed that only one industry (viz., manufacture of beverages, tobacco and related products) has registered annual compound growth rate of above 7 per cent in net value added, while 5 industry groups have recorded annual compound growth rate of between 4 and 7 per cent. So far as employment is concerned, majority of the industry groups has witnessed negative growth rate. It is interesting to note that only 5 industry groups, which are highly capital intensive, contributed over 85 per cent of total profit in the manufacturing sector. It has also been found that growth of labour productivity in the manufacturing sector as a whole increased from 1.6 per cent in 1970s to 2.6 per cent in the 1980s and further to 5.7 per cent in 1990s. The share of net value added of six important industry groups in West Bengal to all India NVA has declined over the past 30 years. Because of deceleration in growth rate of these industries, the overall industrial scenario of the State was adversely affected. Moreover, the total factor productivity of the manufacturing sector of the State declined during the period, whereas it has gone up at the all-India level. The six most important industries which were the main contributor to industrial growth of the State have lost their position and their TFP growth rates have gone down drastically except Jute which itself is a dying industry. The TFP growth contribution to output is found to be negative for two out of the six industry groups. However, as a whole, the industrial sector does not seem to have come out from decelerating condition. Technological obsolescence of these six important industry groups may be one of the major reasons of industrial deceleration in the State. Furthermore, although some industries have lost their base, no new industry has come up to take over that position. It cannot be denied that the rural Bengal has changed a lot. In the rural sector the State has set an example for other States in regard to implementation of land reform, and institution of panchayati raj well in advance of the 73rd and 74th constitutional amendment which could enable the State to regain its pre-eminent position, by taking advantage of a boost from domestic farm sector. In contrast, as the analysis in this paper suggests, the situation is entirely different in the arena of industrial development of the State.
Notes
1 See Bagchi (1998)
2 For details see Trivedi et al (2000).
3 Properties of these indices and their limitations have been discussed by Goldar (1986) and Trivedi et al (2000).
4 Divisia Index or Translog Index is discussed in Annex 3.
5 See Trivedi et al (2000), Balakrishnan and Pushpangadan (1994), Ahluwalia (1991), Goldar (1985) etc.
References
Abramovitz. M. (1956): 'Resources and Output Trends in the United States since 1870', American Economic Association Papers, May 1956.
Ahluwalia, I.J.(1985): 'Industrial Growthin India - Stagnation Since the Mid-Sixties', Oxford University Press, Delhi.
Awasthi, Dinesh N., (2000): 'Recent Changes in Gujarat Industry - Issues and Evidence', Economic and Political Weekly, August 26 - September 2, pp. 383-392.
Bagchi, Amiya Kumar (1998): 'Studies on the Economy of West Bengal since Independence', Economic and Political Weekly, November 2, pp. 2973-78.
Banerjee, Debdas (1998): 'Indian Industrial Growth and Corporate Sector Behaviour in West Bengal, 1947-97' Economic and Political Weekly, November 2, pp 3067-3074.
Bandyopadhyay, D. (2001): 'West Bengal - Recipe for Industrial Revival',
Economic and Political Weekly, December 29, pp. 4788-9.
Banerjee, L.G., (1999): 'Industrial Growth and Structure - Manufacturing Sector in Maharashtra', Economic and Political Weekly, February 27, pp. M-39 - M-48.
Banerjee, Debdas (1996): 'Industrialization Programme in West Bengal: Policy and the Problems - Some Lessons from Newly industrializing Countries in Asia' in Raychaudhuri, Ajitava and Debjani Sarkar (ed.), Economy of West Bengal Problems and Prospects, Allied Publishers, Calcutta.
Bhattacharya, Basabi (2001):'Human Development Poverty, Migration and Urban Internal Sector in West Bengal' A Systems Approach, Allied Publishers, Kolkata.
Christensen, L.R. and Jorgenson, D.W.(1969): 'The Measurement of U.S. Real Capital Input, 1929-1967', Review of Income and Wealth, December 1969.
Christensen, L.R. and Jorgenson, D.W.(1970): 'U.S. Real Product and Real Factor Input, 1929-1967', Review of Income and Wealth , March 1970.
Dasgupta, Sreemanta, (1998): 'West Bengal and Industry : A Regional Perspective', Economic and Political Weekly, November 2, pp 3049-3060.
Diewert, W.E. (1976): 'Exact and Superlative Index Number', Journal of Econometrics, vol. 4.
Fabricant, S. (1954): 'Economic Progress and Economic Change', 34th Annual Report of the National Bureau of Economic Research, New York, 1954.
Gangopadhyay, Suparna (1996): 'Prospective Industrial Sectors of West Bengal and the Recent Industrial Drive - An Empirical Assessment' in Raychaudhuri, Ajitava and Debjani Sarkar (ed.).
Gokak, A.V., (1998): 'Industrial Sickness', B.R. Publishing Corporation, Delhi.
Goldar, B.N.(1986): 'Productivity growth in Indian Industry', Allied Publishers Pvt. Ltd.
Gollop, F.M and Jorgenson, D.W.(1980): 'U.S. Productivity Growth by Industry, 1947-73', in Development in Productivity Measurement and Analysis, edited by Kendrick and Vaccara, NBER.
Jorgenson, D.W and Griliches, Z.(1967): 'The Explanation of Productivity Change', Review of Economic Studies, July 1967.
Jorgenson, D.W and Griliches, Z.(1972): 'Issues in Growth Accounting: A Reply to Edward F. Denison', Survey of Current Business, May 1972.
Kendrick, J.W.(1956): 'Productivity Trends: Capital and Labour', Review of Economics and Statistics, August 1956.
Maddison, A.(1987): 'Growth and Slowdown in Advanced Capitalist Economies: Techniques of Quantitative Assessment', Journal of Economic Literature, vol. xxv,pp. 649-98.
Misra, B.M. and S.K.Chattopadhyay (2002): 'Industrial Revival in West Bengal', Artha Beekshan, vol., No., June 2002.
Nayyar, Deepak (1994): Introduction in idem (ed.): 'Industrial Growth and Stagnation', Oxford University Press, Bombay.
Panda, R. K. and Raj Kishore Meher (1992): 'Industrial Sickness - A Study of Small Scale Industries', Ashis Publishing House, New Delhi.
Raj, K.N. (1994): 'Growth and Stagnation in Indian Industrial Development' in Nayyar, Deepak.
Ray, Amit Shovan (1996): 'A Statistical Profile of Industrial Development in West Bengal' in Raychaudhuri, Ajitava and Debjani Sarkar (ed.)
Raychaudhuri, Ajitava and Biswajit Chatterjee (1998): 'Pattern of Industrial Growth in West Bengal during Last Two Decades - Some Policy Suggestions', November 2, pp 306-3065.
Schmookler, J (1952): 'The Changing Efficiency of the American Economy 1969-1938', Review of Economics and Statistics, August 1952.
Solow, R.M.(1957):'Technical change and the Aggregate Production Function', Review of Economics and Statistics, August, 1957.
Srivastava, V.(1996): 'Liberalization, Productivity and Competition - A Panel Study of Indian Manufacturing', Oxford University Press, Delhi.
Tinbergen,J.(1942): 'ZurTheorie der langfirstigen Wirtschaftsentwicklung',
Weltwirschaftliches Archive, May 1942.
Trivedi, P., Prakash, A. and Sinate D.(2000): 'Productivity in Major Manufacturing industries in India: 1973-74 to 1997-98', Development Research Group Study No.20, RBI, Mumbai, August 2000.
Annex - 1
The Concordance Table
|
NIC 1987 code |
NIC 1998 code |
|
20-21 |
151+152+153+154 |
|
22 |
155+16 |
|
23+24+25 |
171 |
|
26 |
172+173+181 |
|
27 |
20+361 |
|
28 |
21+22 |
|
29 |
182+19 |
|
30 |
24 |
|
31 |
23+25 |
|
32 |
26 |
|
33 |
27+371 |
|
34 |
2811+2812+289 |
|
35-36 |
2813+29+30+31+32 |
|
37 |
34+35 |
|
38 |
33+369 |
|
39 |
725 |
|
Source :National
Industrial Classification, Central Statistical |
|
Annex - 2
The Concordance Table
|
NIC Code |
Description of Industry |
|
220-21 |
Manufacture of Food Products |
|
22 |
Manufacture of Beverages, Tobacco and Related Products |
|
23 |
Manufacture of Cotton Textiles |
|
24 |
Manufacture of Wool, Silk and Man-made Fibre Textiles |
|
25 |
Manufacture of Jute and Other Vegetable Fibre textiles (Excl. |
|
Cotton) |
|
|
26 |
Manufacture of Textile Products (Including Wearing Apparel) |
|
27 |
Manufacture of Wood and Wood Products, Furniture and |
|
Fixtures |
|
|
28 |
Manufacture of Paper and Paper Products and Printing, |
|
Publishing & Allied Industries |
|
|
29 |
Manufacture of Leather & Leather Products, Fur & Leather |
|
Substitutes |
|
|
30 |
Manufacture of Basic Chemicals and Chemical Products |
|
(Except Products of Petroleum and Coal) |
|
|
31 |
Manufacture of Rubber, Plastic, Petroleum and Coal Products; |
|
Processing of Nuclear Fuels. |
|
|
32 |
Manufacture of Non-metallic Mineral Products |
|
33 |
Basic Metal and Alloys Industries |
|
34 |
Manufacture of Metal Products and Parts, except Machinery |
|
and Equipment |
|
|
35 |
Manufacture of Machinery and Equipment, Electrical (other |
|
than Transport equipment (and excl. Manufacture of Scientific |
|
|
Equipment, Photographic/Cinematic Equ. and Watches & |
|
|
Clocks) |
|
|
36 |
Manufacture of Machinery and Equipment, Non-electrical |
|
(other than Transport, Scientific, Photographic/Cinematic |
|
|
Equ. Watches & Clocks) |
|
|
37 |
Manufacture of Transport Equipment and Parts |
|
38 |
Other Manufacturing Industries (Including Manufacture of |
|
Scientific, Photographic/Cinematic Equipment, Watches & |
|
|
Clocks) |
|
|
39 |
Repairs of Capital Goods |
Annex - 3
Divisia Index – Translog Index
The need for Divisia index has been noted by Solow (1957) and Jorgenson and Griliches (1967). Subsequently Christensen and Jorgenson (1969,1970), Jorgenson and Griliches 1972), Gallop and Jorgenson (1980) have used approximations to the Divisia index known as translog index in their studies.
The properties of the Divisia index, which make its application highly desirable, have been discussed in the seminal paper of Christensen and Jorgenson (1970). It has been pointed out that the rates of growth of the Divisia indexes of prices and quantities add up to the rate of growth of the value (factor reversal test) and that such indexes are symmetric in different directions of time (time reversal test). Divisia indexes also have the reproductive property that "a Divisia index of Divisia indexes is a Divisia index of the components." For application to data at discrete points of time an approximation to the continuous Divisia index is required. The translog index is a discrete version (developed by Tornquist) of the continuous Divisia index. Translog index numbers are symmetric in data of different time periods and also satisfy the factor reversal test approximately. But they do not have the reproductive property. The translog index of technological change is based on a translog production function, characterised by constant returns to scale. It allows for variable elasticity of substitution and as pointed out above it does not require the assumption of Hicks-neutrality.
To describe the Divisia index we may consider a somewhat general model. Let’s consider an aggregate production function with two factors of production:
Y = F(K, L,T) (1)
Where Y denotes aggregate output, K aggregate capital, L aggregate labour and T time. It is assumed that F is continuous, twice differentiable and characterized by constant returns to scale. These aggregates are taken as functions of their components
Similar assumptions about continuity, differentiability and homogeneity are made for these functions. Corresponding to them there are m output prices, n capital prices and q labour prices, denoted respectively by
![]()
Correspondingly, aggregate prices are denoted by p, r and w. Under the assumption of perfect competition and profit maximization, the conditions of producer's equilibrium require that the shares of the factor prices be equal to their elasticities, so that
SYi is the share of the i'th output component in aggregate output. Similarly SKj and SLu are the shares of the j'th capital input and the u'th labour input in aggregate capital and aggregate labour respectively. Linear homogeneity requires

Differentiating equation (1) totally with respect to time and rearranging terms, we obtain
Thus, a weighted average of growth rates of individual components gives the growth rate for the aggregate. These are respectively called the Divisia quantity Indexes of output, capital and labour.
On the price side, it is seen that the assumptions of constant returns to scale, perfect competition and profit maximization require that the prices of output, capital and labour be consistent with the following equation
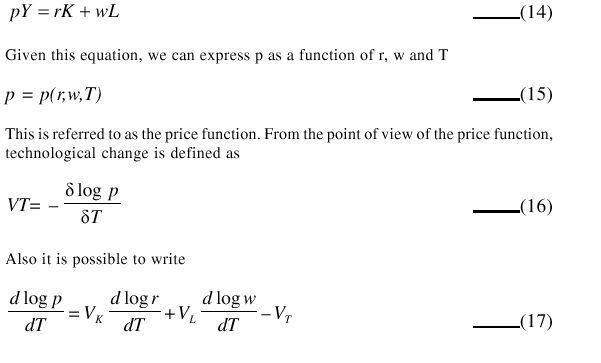
This form gives us the Divisia price index of technological change.
For application to data at discrete points of time, an approximation to the continuous Divisia index, known as translog index, may be used. This assumes that translog function describes the relationships between Y, K, L and T (production function) and also the relationships between the aggregates and components. Constant returns to scale is assumed for all these functions.

આ પેજ શેર કરો:


રિઝર્વ બેંક ઑફ ઇન્ડિયા મોબાઇલ એપ્લિકેશન ઇન્સ્ટૉલ કરો અને લેટેસ્ટ ન્યૂઝનો ઝડપી ઍક્સેસ મેળવો!
અમારી એપ ઇન્સ્ટોલ કરવા માટે QR કોડ સ્કેન કરો


પેજની છેલ્લી અપડેટની તારીખ:


