 IST,
IST,


V. Financial Markets
International Financial Markets Global financial markets witnessed generally uncertain conditions during April-July 20081. The financial market turbulence that had erupted in the US sub-prime mortgage market in mid-2007 and gradually deepened towards early 2008, witnessed a cautious return of investor risk tolerance in the credit markets between mid-March 2008 and end-May 2008. As a result, spreads narrowed down in credit markets and investor interest revived temporarily in equity markets. In sharp contrast to these favourable developments, inter-bank money markets, however, failed to recover as liquidity demand remained elevated. Central banks continued to work together and also individually to improve liquidity conditions in financial markets. Financial markets, however, came under stress again in June 2008 and early-July 2008 as concerns mounted about the losses and longer-term profitability of two US mortgage companies, viz., Fannie Mae and Freddie Mac. Inter-bank money markets continued to show signs of stress during March-May 2008 as spreads between LIBOR rates and overnight index swap rates increased in all the three major markets, viz., the US, the UK and the Euro area. Central banks continued to work together on liquidity conditions in financial markets. In view of the persistent liquidity pressures in some term funding markets, the European Central Bank (ECB), the US Federal Reserve, and the Swiss National Bank (SNB) announced an expansion of their liquidity measures in May 2008. On May 2, 2008, the US Federal Reserve announced an increase in the amounts auctioned to eligible depository institutions under its bi-weekly Term Auction Facility (TAF) from US$ 50 billion to US$ 75 billion, beginning with the auction on May 5, 2008. In conjunction with the increase in the size of the TAF, the Federal Open Market Committee (FOMC) authorised further increases in its existing temporary reciprocal currency arrangements with the ECB and the SNB. These arrangements provided US dollars up to US$ 50 billion and US$ 12 billion to the ECB and the SNB, respectively, representing increases of US$ 20 billion and US$ 6 billion since December 12, 2007. In addition, the FOMC authorised an expansion of the collateral that could be pledged in the Federal Reserve’s Schedule 2 Term Securities Lending Facility (TSLF) auctions. Primary dealers were allowed to pledge AAA/Aaa-rated asset-backed securities, in addition to already eligible residential and commercial-mortgage-backed securities and agency collateralised mortgage obligations, beginning with the Schedule 2 TSLF auction announced on May 7, 2008, and settled on May 9, 2008. Treasury securities, agency securities, and agency mortgage-backed securities continued to be eligible as collateral in Schedule 1 TSLF auctions. The Governing Council of the ECB decided, in conjunction with the US Federal Reserve and in the context of the TAF, to increase the amount of US dollar liquidity provided to the counterparties of the Eurosystem to US$ 25 billion in each biweekly auction. The ECB intended to continue the provision of US dollar liquidity for as long as the Governing Council considered it was needed in view of the prevailing market conditions. The SNB decided to increase the frequency and amount of US dollar repo auctions. Accordingly, the SNB decided to hold its US dollar auctions on a 14-day basis. The total amount of liquidity made available was increased from US$ 6 billion to a maximum of US$ 12 billion. The SNB also planned to make US dollar liquidity available for as long as it considered this to be necessary. The wider pool of collateral promoted improved financing conditions in a broader range of financial markets. Credit markets witnessed a cautious return of risk tolerance between mid-March 2008 and end-May 2008, with spreads recovering from the very wide levels witnessed in the first quarter of 2008. Market liquidity improved, allowing for better price differentiation across instruments. The stabilisation of financial markets and the emergence of a somewhat less pessimistic economic outlook also contributed to a turnaround in the equity markets till end-May 2008. Government bond yields rose mirroring the developments in the credit and equity markets. Growing perceptions among investors that the impact from the financial turmoil on real economic activity might turn out to be less severe than had been anticipated also improved investor confidence. Equity markets, however, declined beginning end-May 2008, reflecting hardening of inflation across the developed and emerging market economies (EMEs), surge in crude oil prices to new peaks and concerns over losses of two US mortgage companies, viz., Fannie Mae and Freddie Mac. In view of uncertainty about inflation outlook remaining high, the US Fed decided to keep the fed funds rate target unchanged in its meeting held on June 25, 2008. On July 8, 2008, the Bank of Canada indicated that it would withdraw liquidity from the system in view of improvement in funding conditions witnessed since end-April 2008. The measures taken by the US Federal Reserve and other central banks improved somewhat the conditions in the financial markets. The recent episode of financial distress, however, raises several issues about financial regulation and the appropriate role of the lender of last resort. An important lesson emerging from the recent financial market turbulence is that the financial system needs to be strengthened with an array of regulatory changes, including strengthening of capital and liquidity rules, stronger risk management practices, closer supervision and management of firm-wide risks, and greater transparency and resilience of the financial infrastructure. Private investors and other market participants have to also play crucial roles in strengthening the financial system. Short-term Interest Rates During 2008-09 so far (up to July 16, 2008), short-term interest rates in advanced economies witnessed a mixed trend, moving broadly in tandem with the policy rates (Table 39). In the US, short-term interest rates increased marginally. The US Fed kept its fed funds rate target unchanged at 2.0 per cent in June 2008. The pause occurred after a series of consecutive reductions in the fed funds rate target undertaken between September 18, 2007 and April 30, 2008. In the UK, short-term interest rates declined, reflecting cut in policy rate in the second half of 2007-08 and also in April 2008. The Bank of England, which had increased its policy rate in May 2007 and July 2007, reduced it in December 2007, February 2008 and April 2008 to 5.0 per cent in the wake of concerns over slow growth, thereby prompting a decline in short-term rates. On the other hand, short-term interest rates increased in the Euro Area reflecting increase in the key policy rates on July 3, 2008. In the EMEs, short-term interest rates generally witnessed an uptrend, firming up in Argentina, Brazil, Hong Kong, Malaysia and Thailand. The only exceptions were China, the Philippines and Singapore. Government Bond Yields Long-term government bond yields in major advanced economies, which had bottomed out at end-March 2008, hardened during 2008-09 so far (up to July 16,
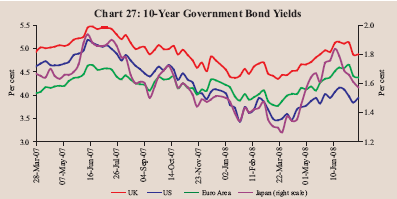
2008) (Chart 27). In addition to reduced safe haven demand for government securities, the rise in yields reflected a reassessment among investors of the need for monetary easing, following the stabilisation of financial markets during April-May 2008. The 10-year government bond yield in the US increased by 44 basis points between March 26, 2008 and July 16, 2008. During the same period, yields on 10-year government papers increased by 51 basis points in the Euro area, 44 basis points in the UK and 31 basis points in Japan. Equity Markets During 2008-09, so far (up to July 22, 2008) international equity markets witnessed a two-way movement (Table 40). International equity markets, which had recovered somewhat during April-May 2008, but declined thereafter on concerns over elevated crude oil prices and high inflation. Equity markets in most of the EMEs also declined due to signs of economic slowdown, sharp rise in inflation rate, high international crude oil prices and concerns over stagflation in the US. Foreign Exchange Market In the foreign exchange market, the US dollar depreciated against most of the currencies during 2008-09 so far (up to July 21, 2008). The dollar’s weakness reflected lower consumer confidence in the wake of elevated global commodity prices, weaker equity markets, lower manufacturing growth, higher unemployment with downward non-farm payroll employment, lower sales of the new houses in the US and selling pressure of the US dollar in the international market. Between end-March 2007 and July 21, 2008, the US dollar depreciated by 0.3 per cent against the Euro, 0.5 per cent against the Pound sterling and 2.7 per cent against the
Chinese Yuan. On the other hand, the US dollar appreciated by 6.3 per cent against the Japanese yen and 6.1 per cent against the Thai Baht (Table 41). Domestic Financial Markets Indian financial markets remained largely orderly during the first quarter of 2008-09. The main drivers of liquidity, and consequently the rates in the money market, were cash balances of the Central Government with the Reserve Bank, hikes in the cash reserve ratio (CRR) and the Reserve Bank’s foreign exchange operations. Interest rates in the call money market mostly remained within the informal corridor set by reverse repo and repo rates during the quarter. As in the past, interest rates in the collateralised segment of the money market remained below the call rate. In the foreign exchange market, the Indian rupee generally depreciated against major currencies. Yields in the Government securities market hardened during the quarter (Table 42). Indian equity markets recovered somewhat during April-May 2008 but declined thereafter in tandem with trends in major international equity markets as well as edging up of domestic inflation.
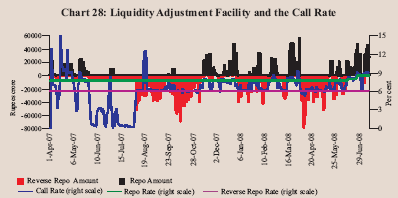
The Indian money market remained largely orderly during the first quarter of 2008-09. Money market rates declined during the beginning of the first quarter of 2008-09 from their levels witnessed in the second-half of March 2008. The various interest rates in the money market moved in tandem with the evolving liquidity conditions. The daily average call rate, which hovered around the repo rate in the second-half of March 2008, moderated in the beginning of April 2008 as liquidity conditions eased on account of significant reduction in the surplus cash balances of the Central Government with the Reserve Bank. The call rate hovered around the reverse repo rate during April 2008 on account of easy liquidity conditions. In May 2008, the call rate mostly remained within the informal corridor as liquidity remained in a surplus mode. The weighted average call rate in May 2008 was, however, higher than that during April 2008, as the surplus liquidity in the banking system declined in May 2008 due to the cumulative impact of the three-stage hike in the CRR of 25 basis points each to 8.25 per cent. On some occasions during the second-half of May 2008, the call rate hovered around the upper bound of the liquidity adjustment facility (LAF) corridor (Chart 28). The call rate declined in the beginning of June 2008, but moved above the repo rate on June 10, 2008 as liquidity conditions turned tight, and mostly remained around that level for the rest of the month. In the first week of July 2008, the call rate declined sharply and moved within the LAF corridor as liquidity eased mainly on account of a decline in the cash balances of the Central Government. Subsequently, the call rate mostly remained above the repo rate reflecting the two-stage CRR hike of 25 basis points each (on July 5 and July 19, respectively) to 8.75 per cent. The call rate was placed at 9.67 per cent on July 23, 2008. Interest rates in the collateralised segments of the money market – the market repo (outside the LAF) and the Collateralised Borrowing and Lending Obligation (CBLO) – moved in tandem with call rates, and continued to remain below the call rate during the first quarter of 2008-09 (Chart 29). During April-June 2008, interest rates averaged 6.83 per cent, 6.14 per cent, 6.42 per cent in the call, CBLO and market repo segments, respectively (5.90 per cent, 4.17 per cent, 4.66 per cent, respectively, a year ago). The average daily volume in the money market segments – call, market repo (outside the LAF) and CBLO – during April-June 2008 was around 52 per cent higher than that in the same period of 2007. The collateralised market (market repo and CBLO) remained the predominant segment of the money market, and accounted for more than 80 per cent of the total volume during April-June 2008 (Table 43). Mutual funds were the major lenders in the CBLO and market repo segments, while commercial banks were the major borrowers in both the segments. Certificates of Deposit The outstanding amount of certificates of deposit (CDs) issued by scheduled commercial banks (SCBs) increased from Rs.1,47,792 crore at end-March 2008 to Rs.1,63,143 crore as on June 20, 2008 (see Table 43). The outstanding amount of CDs as on June 20, 2008 accounted for 6.2 per cent of total aggregate deposits of the 'CD-issuing' banks with significant inter-bank variation ranging from 0.2 per
cent to 37.0 per cent. The overall weighted average discount rate (WADR) of CDs declined from 10.0 per cent at end-March 2008 to 8.49 per cent at end-April 2008 but thereafter increased to 9.16 per cent on June 20, 2008. The top five CD-issuers, two private sector banks, two foreign banks and one public sector bank, accounted for 64 per cent of the new issuances during the fortnight ended June 20, 2008. Commercial Paper The outstanding amount of commercial paper (CP) issued by corporates increased from Rs.32,592 crore at end-March 2008 to Rs.46,847 crore on June 30, 2008 (see Table 43). The WADR on CP declined from 10.38 per cent at end-March 2008 to 8.57 per cent on May 15, 2008 but thereafter increased to 10.03 per cent on June 30, 2008. Mutual funds were the major investors in the CP market and the preferred tenor of CP issuances was '6 months to 1 year'.
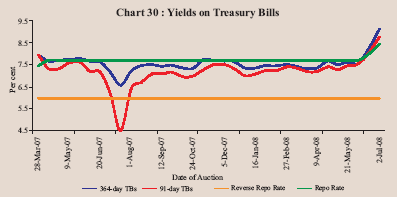
Leasing and finance companies were the predominant issuers of CP with 75 per cent share, followed by 'manufacturing and other companies' and 'financial institutions' as on June 30, 2008 (Table 44). Treasury Bills During the first quarter of 2008-09, primary market yields on Treasury Bills (TBs) hardened, particularly from May 2008, in tandem with higher money market interest rates, hikes in the CRR, higher inflation and inflation expectations (Chart 30 and Table 45). The yield spread between 364-day and 91-day TBs was 8 basis points in June 2008 (7 basis points in March 2008).
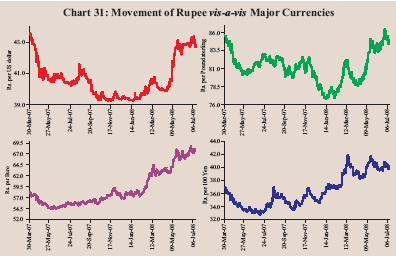
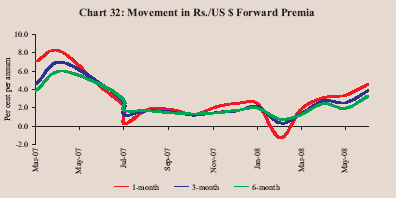
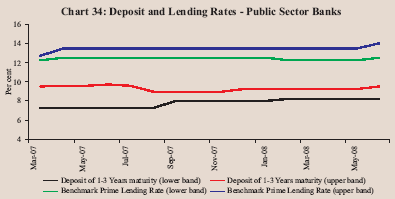
Foreign Exchange Market During 2007-08, the Indian rupee generally exhibited two-way movements (Chart 31). The rupee moved in the range of Rs.39.26-43.15 per US dollar during 2007-08. The rupee depreciated during the first half of August 2007 due to bearish conditions in the Asian stock markets including India, strong FII outflows and concerns over sub-prime lending crisis in the US, while it appreciated thereafter reflecting large capital inflows, weakening of the US dollar vis-à-vis other currencies and strong performance in the domestic stock markets. However, the rupee started depreciating against the US dollar from the beginning of February 2008 on account of bearish conditions in the stock market, capital outflows, rising crude oil prices and increased demand for US dollars by corporates. The exchange rate of the rupee was Rs.39.99 per US dollar on March 31, 2008. At this level, the Indian rupee appreciated by 9.0 per cent over its level on March 31, 2007. Over the same period, the rupee appreciated by 7.6 per cent against the Pound sterling, while it depreciated by 7.8 per cent against the Euro, 7.6 per cent against the Japanese yen and 1.1 per cent against the Chinese yuan. During 2008-09 so far (up to July 23, 2008), the Indian rupee generally depreciated. The rupee moved in the range of Rs.39.89-43.16 per US dollar during the first quarter. The rupee, which depreciated during fourth quarter of 2007-08, up to mid-March 2008, appreciated thereafter till end-March 2008, reflecting strong FDI inflows. After trading in a range of Rs. 39.89-40.02 per US dollar till April 22, 2008, the rupee broke above the value of Rs. 40.00 per US dollar on April 24, 2008. The rupee depreciated continuously thereafter, reflecting large capital outflows by FIIs (US $ 5.2 billion during the first quarter of 2008-09), increased demand for dollars by the oil companies and bearish stock market conditions. The exchange rate of the rupee was Rs.42.33 per US dollar on July 23, 2008. At this level, the Indian rupee depreciated by 5.5 per cent over its level on March 31, 2008. Over the same period, the rupee depreciated by 5.7 per cent against the Pound sterling, 5.5 per cent against the Euro and 8.2 per cent against the Chinese yuan, while appreciated by 1.8 per cent against the Japanese yen. On an average basis, both the 36-currency trade weighted nominal effective exchange rate (NEER) and real effective exchange rate (REER) of the Indian rupee depreciated by 3.9 per cent each between March 2008 and May 2008 (Table 46). Over the same period, the 6-currency trade weighted NEER and REER of the rupee depreciated by 4.1 per cent and 2.7 per cent, respectively. On July 22, 2008, the 6-currency trade weighted NEER and REER of the rupee depreciated by 6.4 per cent and 1.7 per cent, respectively, over their end-March 2008 levels. Forward premia increased during the first quarter of 2008-09, reflecting the rising interest rate differentials on account of higher domestic interest rates and CRR hikes. The one-month forward premia increased from 3.45 per cent at end March 2008 to 7.57 per cent on July 18, 2008, while the six-month forward premia increased from 2.50 per cent to 5.10 per cent over the same period (Chart 32). The average daily turnover in the foreign exchange market increased to US $ 49.1 billion during April-June 2008 from US $ 39.2 billion in the corresponding period of 2007 (Chart 33). While the inter-bank turnover increased from US $ 28.5 billion to US $ 35.6 billion, the merchant turnover increased from US $ 10.8 billion to US $ 13.6 billion. The ratio of inter-bank to merchant turnover at 2.6 during April-June 2008 was almost the same as a year ago. Credit Market The deposit rates of scheduled commercial banks (SCBs) hardened during 2008-09 so far (up to July 14, 2008). Interest rates of public sector banks (PSBs) on deposits of maturity of up to one year increased to 2.75-9.25 per cent in July 2008 from 2.75-8.50 per cent in March 2008. The deposit rates of private sector banks on deposits of maturity both of one to three years and above three years firmed up to the range of 8.00-10.00 per cent in July 2008 from the range of 7.25-9.25 per cent and 7.25-9.75 per cent, respectively, in March 2008 (Table 47). The benchmark prime lending rates (BPLRs) of PSBs and private sector banks were placed in the range of 12.75-14.00 per cent and 13.50-17.25 per cent, respectively, in July 2008 as compared with the range of 12.25-13.50 per cent and 13.00-16.50 per cent, respectively, in March 2008 (Chart 34). The BPLR of foreign banks at 10.00-15.50 per cent, however, remained unchanged during the same period. The weighted average BPLR of PSBs increased from 12.43 per cent in March 2007 and 12.84 per cent in March 2008 to 12.94 per cent in June 2008. The weighted average BPLR of private sector banks increased from 14.33 per cent in
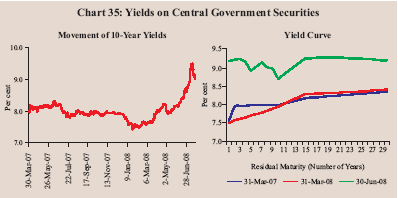
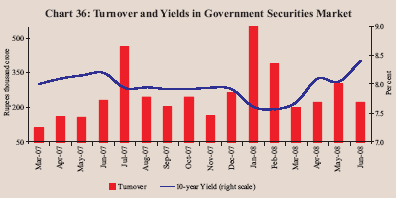
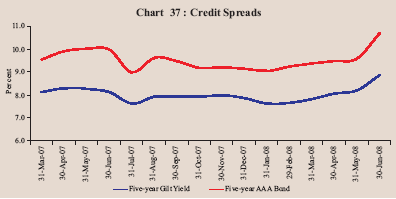
March 2007 and 15.10 per cent in March 2008 to 15.22 per cent in June 2008. The weighted average BPLR of foreign banks also rose from 12.63 per cent in March 2007 and 13.87 per cent in March 2008 to 14.06 per cent in June 2008. Government Securities Market The yields in the Government securities market hardened initially during the first quarter of 2008-09 on the back of rise in inflation. The 10-year yield increased from 7.98 per cent as on April 2, 2008 to 8.24 per cent as on April 24, 2008. Thereafter, the 10-year yield eased below 8.0 per cent as the policy rates were kept unchanged in the Annual Policy Statement for the Year 2008-09, announced on April 29, 2008. Easy liquidity condition on the back of Government spending also contributed to the decline in yields. Subsequently, heightened inflationary expectations emanating from the sharp increase in global commodity prices as well as international crude oil prices led to the hardening of the yields (Chart 35). Tight liquidity conditions due to monetary measures and advance tax flows towards the end of June 2008 also contributed to the rise in yields. The 10-year yield declined in the third week of July 2008 after reaching a peak of 9.51 per cent on July 15, 2008, reflecting easing of international crude oil prices. The 10-year yield closed at 9.03 per cent on July 23, 2008, 110 basis points higher than that at end-March 2008. The spread between 1-year and 10-year yields was (-)49 basis points at end-June 2008 as compared with 45 basis points at end-March 2008. The spread between 10-year and 30-year yields was 50 basis points at end-June 2008 (47 basis points at end-March 2008). The entire yield curve as on June 30, 2008 shifted up as compared with March 31, 2008 reflecting tightness in liquidity conditions and the consequent rise in money market rates. The yield curve as on June 30, 2008 continued to exhibit flatness beyond 15 years but was marked by dips around 5-year and 10-year tenors, reflecting demand-supply imbalances around these buckets. The daily turnover in the Government securities market averaged Rs.8,196 crore during April-June 2008, which was 39 per cent lower than that in the preceding quarter (Chart 36). The yield on 5-year AAA-rated corporate bonds hardened during the first quarter of 2008-09 in tandem with Government securities yield. The spread between the yields on 5-year AAA-rated bonds and 5-year Government securities was 125 basis points at end-June 2008 as compared with 161 basis points at end-March 2008 (Chart 37). Equity Market Primary Market Resources raised through public issues declined by 91.5 per cent to Rs. 2,031 crore during April-June 2008 over those in the corresponding period of last year. The number of issues declined from 24 in April-June 2007 to 15 in April-June 2008 (Table 48). The average size of public issues also declined to Rs.135 crore during April-June 2008 from Rs.994 crore during April-June 2007. All public issues during April-June 2008 were in the form of equity. Out of 15 issues during April-June 2008, 13 issues were initial public offerings (IPOs), accounting for 78.4 per cent of total resource mobilisation. Mobilisation of resources through private placement increased by 45.7 per cent to Rs.2,12,568 crore during 2007-08 over the previous year. Resources
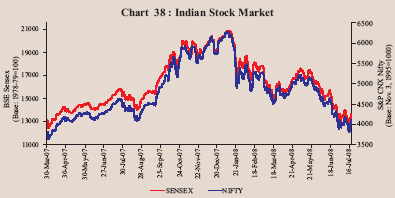
mobilised by private sector entities increased by 58.3 per cent during 2007-08, while those by public sector entities increased by 29.7 per cent. Financial intermediaries (both from public sector and private sector) accounted for the bulk (67.9 per cent) of the total resource mobilisation from the private placement market during 2007-08 (68.9 per cent during 2006-07). Resources raised through Euro issues – American Depository Receipts (ADRs) and Global Depository Receipts (GDRs) – by Indian corporates during April-June 2008 at Rs.4,056 crore were substantially higher than those during the corresponding period of previous year. During April-June 2008, net mobilisation of resources by mutual funds declined by 25.3 per cent to Rs.38,437 crore over the corresponding period of 2007 (Table 49). Scheme-wise, during April-June 2008, 90.0 per cent of net mobilisation of funds was under income/debt oriented schemes. Growth-oriented schemes accounted for 7.9 per cent of net resource mobilisation during April-June 2008. Secondary Market The domestic stock markets, which remained generally firm up to first week of January 2008, witnessed severe bouts of volatility thereafter due to heightened concerns over the severity of sub-prime lending crisis in the US and its spillover to other market segments and in other countries (Chart 38). The domestic stock markets recovered somewhat during April-May 2008. On May 21, 2008, the BSE Sensex registered gains of 10.2 per cent over end-March 2008. The upward trend was attributed to better than expected fourth quarter results of 2007-08 declared by IT majors, net purchases by FIIs in the Indian equity market, and some easing of international crude oil prices. The market sentiment, however, turned cautious
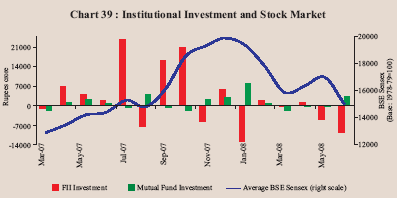
thereafter mainly on account of hike in domestic retail fuel prices, rise in domestic inflation rate, net sales by FIIs in the Indian equity market, concerns over rising trade deficit and depreciation of the rupee, downward trend in major international equity markets, increase in international crude oil prices and other sector and stock specific news. As a result, both the BSE Sensex and the S&P CNX Nifty closed lower at 14942.28 and 4476.80, respectively, on July 23, 2008, registering losses of 4.5 per cent and 5.4 per cent, respectively, over their end-March 2008 level. Between end-March 2008 to July 23, 2008, the BSE Sensex moved in a range of 12576-17600. According to the data released by the Securities and Exchange Board of India (SEBI), FIIs made net sales of Rs.16,279 crore (US $ 4.0 billion) in the Indian equity market during 2008-09 so far (up to July 17, 2008) as against net purchases of Rs.30,777 crore (US $ 7.4 billion) during the corresponding period of the previous year (Chart 39). Mutual funds, on the other hand, made net purchases of Rs.3,654 crore during 2008-09 so far (up to July 17, 2008) as compared with net purchases of Rs.2,604 crore during the corresponding period of last year. The sectoral indices witnessed a mixed trend during the current financial year so far (up to July 18, 2008) (Table 50). The losers among the sectoral indices were capital goods, auto, banking, public sector undertakings, metal, fast moving consumer goods, consumer durables and oil and gas, while the gainers were information technology and healthcare sector stocks. Reflecting the downward trend in stock prices, the price-earnings (P/E) ratio of the 30 scrips included in the BSE Sensex declined from 20.1 at end-March 2008 to 16.5 at end-June 2008. The market capitalisation of the BSE also declined by 14.8 per cent between end-March 2008 and end-June 2008. The volatility in the stock markets, however, increased during April-June 2008 as compared with the corresponding period of last year. The turnover of both BSE and NSE in the cash segment during April-June 2008 was higher by 38.2 per cent than the corresponding period of 2007 (Table 51).
1A detail account of the recent financial market turbulence was covered in the Macroeconomic and Monetary Developments in 2007-08, April 2008. | |||||||||||||||||||||||||||||||||||||||||||||||||||||||||||||||||||||||||||||||||||||||||||||||||||||||||||||||||||||||||||||||||||||||||||||||||||||||||||||||||||||||||||||||||||||||||||||||||||||||||||||||||||||||||||||||||||||||||||||||||||||||||||||||||||||||||||||||||||||||||||||||||||||||||||||||||||||||||||||||||||||||||||||||||||||||||||||||||||||||||||||||||||||||||||||||||||||||||||||||||||||||||||||||||||||||||||||||||||||||||||||||||||||||||||||||||||||||||||||||||||||||||||||||||||||||||||||||||||||||||||||||||||||||||||||||||||||||||||||||||||||||||||||||||||||||||||||||||||||||||||||||||||||||||||||||||||||||||||||||||||||||||||||||||||||||||||||||||||||||||||||||||||||||||||||||||||||||||||||||||||||||||||||||||||||||||||||||||||||||||||||||||||||||||||||||||||||||||||||||||||||||||||||||||||||||||||||||||||||||||||||||||||||||||||||||||||||||||||||||||||||||||||||||||||||||||||||||||||||||||||||||||||||||||||||||||||||||||||||||||||||||||||||||||||||||||||||||||||||||


આ પેજ શેર કરો:


રિઝર્વ બેંક ઑફ ઇન્ડિયા મોબાઇલ એપ્લિકેશન ઇન્સ્ટૉલ કરો અને લેટેસ્ટ ન્યૂઝનો ઝડપી ઍક્સેસ મેળવો!
અમારી એપ ઇન્સ્ટોલ કરવા માટે QR કોડ સ્કેન કરો


પેજની છેલ્લી અપડેટની તારીખ:


