 IST,
IST,


Changing Inflation Dynamics in India
Shri Deepak Mohanty, Executive Director, Reserve Bank of India
delivered-on ઑગસ્ટ 13, 2011
I thank the Motilal Nehru National Institute of Technology (MNNIT) for giving me this opportunity to address this distinguished gathering. I propose to speak on inflation which is a matter of concern to all of us. What is inflation? Simply put, inflation is the sustained increase in the overall price level. Relative change in prices of goods and services is a desirable attribute of market economy as it reflects productivity changes as well as demand and supply conditions. However, when this process transforms into an acceleration of the overall price level, we need to worry as inflation imposes many socio-economic costs. The headline wholesale price index (WPI) inflation averaged 9.6 per cent in 2010-11 as compared with 5.3 per cent per annum in the previous decade. Similarly, the average consumer price inflation, measured by the consumer price index for industrial workers (CPI-IW), was even higher at 10.5 per cent in 2010-11 as compared with 5.9 per cent per annum in the previous decade. Moreover, this elevated level of inflation also persisted through the first quarter of 2011-12. In response to inflationary pressures, the Reserve Bank has raised the policy repo rate 11 times bringing it up from a low of 4.75 per cent in March 2010 to 8.00 per cent by July 2011. It is expected that inflation should come down towards the later part of this year. Why has inflation been so high and persisted for so long? This is the theme of my talk today. In my presentation, I propose to address the following questions: Is India an outlier among major countries in terms of recent inflation performance? Has the inflation process changed? What are the causal factors – global and domestic as well as supply and demand? I will conclude with some thoughts on managing the inflation dynamics on the way forward. Is India an outlier in the inflation performance among major countries? It is important to appreciate the global backdrop in which we are experiencing a resurgence of inflation now. In the last decade, inflation was low, both in advanced countries as well as in emerging and developing economies till the global financial crisis unfolded. Consequently, global economy got into a recession and global output declined by 0.5 per cent in 2009. However, global output growth rebounded to 5.0 per cent in 2010. As the global economy recovered from the worst effect of the global financial crisis, inflation picked up in emerging and developing economies. This was because the global recovery was largely driven by emerging market economies (EMEs) what was termed as a two-speed recovery – a faster growth in EMEs accompanied by a slower growth in advanced economies. As output gaps closed, there was increasing inflationary pressure in EMEs, particularly in Asia. According to the International Monetary Fund (IMF), consumer price inflation in developing Asia almost doubled from 3.1 per cent in 2009 to 6.0 per cent in 2010 and is projected to be around the same level in 2011. Latest data suggest that inflation in rapidly growing BRICS1 remains elevated (Table 1).
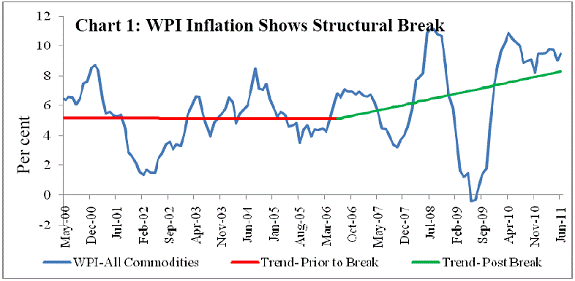
Global factors With recovery, global commodity prices rebounded given the higher level of commodity intensity of growth in EMEs. There was also an element of financialisation of commodities given the global excess liquidity2. Crop loss due to adverse weather conditions in many parts in the world coupled with increased diversion of foodgrains towards biofuel exerted added pressure on global food prices. Thus, global commodity prices including food prices rose sharply. For example, the IMF Commodities Index rose by 24 per cent in 2010 on top of an increase of 43 per cent in 2009. It further rose by 20 per cent in December 2010–April 2011, before moderating by about 2 per cent during June–July 2011. Notwithstanding some softening in the last few months, it is important to recognize that the current level of commodity prices is almost double of that two and half years ago (Table 2). The increase in commodity prices has affected different countries differently depending on whether they are net importers or exporters of commodities. India being a net importer of commodities, the adverse impact on domestic inflation has been stronger. Inflation increased in developing and emerging economies with a combination of closing of output gaps and sharp increase in commodity prices. In this regard, India is not an exception. But the level of inflation in India has been high compared to those in many EMEs. This suggests that apart from global factors, domestic factors have had a significant influence on the inflation trajectory in India. Has the inflation process changed? In India, we have multiple price indices – 6 consumer price indices and a wholesale price index (WPI). While the Reserve Bank examines all the price indices both at aggregate and disaggregated levels, changes in the WPI is taken as the headline inflation for policy articulation. Within the WPI, non-food manufactured products inflation is considered the core inflation3. Going by any measure of inflation, India comes out as a moderate inflation country, though occasionally inflation crossed the double digit mark. The historical average long-term inflation rate was around 7.5 per cent. But significantly, there was substantial moderation in inflation in the 2000s. The annual average inflation rate was around 5.5 per cent irrespective of the inflation indices taken, whether WPI or CPI. This raises the question: did the inflation dynamics change in the 2000s? Monthly WPI inflation data suggest that there was a structural break4 around the mid-2000s with the inflation rate during the latter half being higher (Chart 1).
Average WPI inflation increased from 5.2 per cent in the first half of 2000s to 5.5 per cent in the second half. This was largely contributed by primary food inflation. In fact, the core non-food manufactured products inflation moderated from 4.2 per cent to 3.9 per cent. What did cause the structural break in the mid-2000s? A disaggregated assessment suggests that protein items largely contributed to this change in trend (Table 3).
Not only did the average food prices rise during the second half of 2000s but they were more volatile (Table 4).
Structural food inflation Food prices being subject to supply shocks tend to be volatile. For example, the performance of monsoon has a significant bearing on the trend of domestic foodgrain prices. Spikes in food prices normally subside as they are transitory. However, empirical analysis suggests that inflation in protein items has become persistent5. This suggests that protein inflation has assumed a structural character and is partly driven by demand factors. Within the protein group, persistence was lower for pulses as well as ‘egg, meat and fish’, but it was markedly higher for milk. Thus, the persistence of protein inflation has changed the inflation dynamics in the latter half of the 2000s. Increase in demand for protein appears to be an inevitable consequence of rising affluence (Gokarn, 2010)6. This process was further accentuated by renewed global food price shock during 2010-11. Among the processed food items, the persistence of inflation for edible oils was high (Table 5).
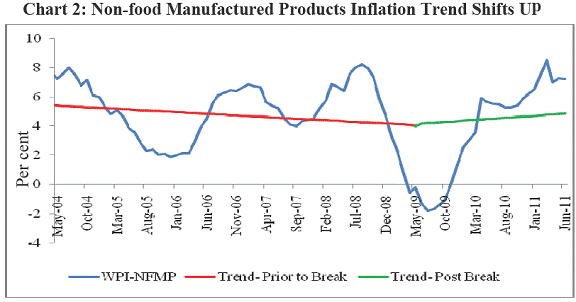
International price pass-through While the persistence of inflation on protein items has increased, it still has a relatively smaller share in overall WPI inflation. What matters more for the overall inflation trajectory is the non-food manufactured products inflation which has a higher weight of 55.0 per cent in the WPI. It averaged 4.0 per cent in the 2000s with a moderation in the second half (Table 3). Subsequently, there has been a sharp increase in 2010-11 and 2011-12 so far. The non-food manufactured products inflation shows a major structural break towards the middle of 2009-10 around the time the global commodity prices rebounded (Chart 2). This has also raised the question: is the non-food manufactured products inflation an imported inflation?
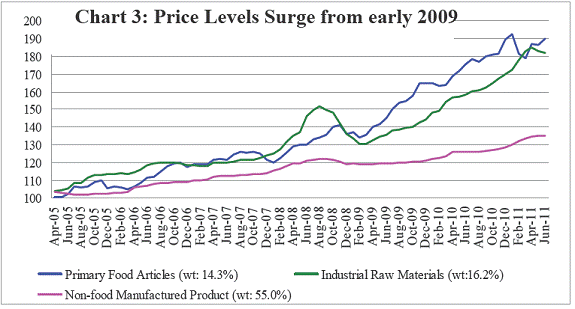
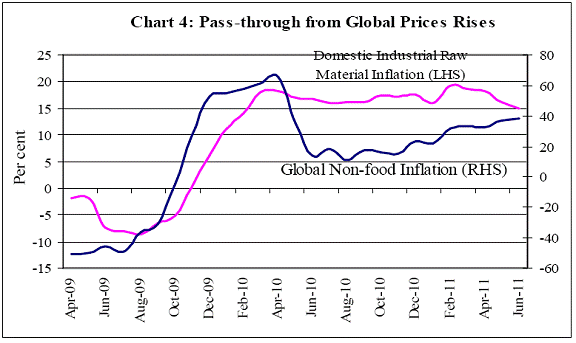
Further, analysis suggests that industrial raw material7 prices also showed a structural break in early 2009 and the average price increase has been high and volatile (Chart 3). Moreover, the pass-through from non-food international commodity prices to domestic raw material prices has increased particularly in the recent years reflecting growing interconnectedness of domestic and global commodity markets (Chart 4).
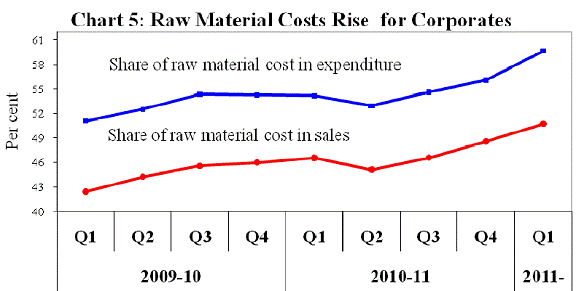
This trend is also corroborated by corporate finance data which show that the share of raw material costs as a percentage of both expenditure and sales has been rising (Chart 5).
Demand factors Price pressures can emanate from the supply side but it will be difficult to sustain it without rising demand. In this context, important information on recent trend in expenditure pattern and wages is available from the 66th round of NSSO consumption survey and Labour Bureau. The average annual monthly per capita expenditure has increased at a faster pace in the second half of 2000s as compared with the first half, both in nominal and real terms (Table 6).
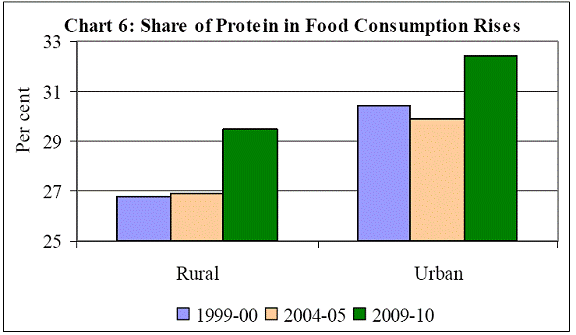
While the share of per-capita expenditure in food has gone down, as could be expected from rise in income levels, both in rural and urban centers, the dietary pattern has shifted in favour of protein items whose share has gone up markedly in the second half of 2000s (Chart 6).
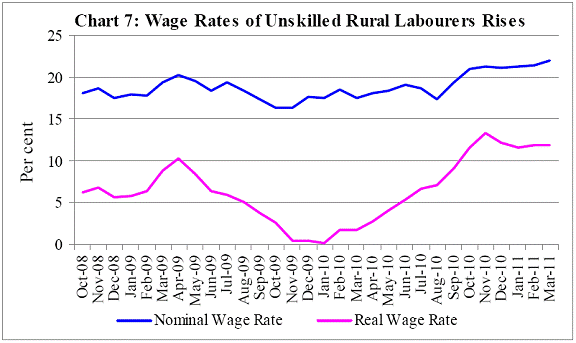
The sharp increase in rural consumption of protein seems to have been sustained by increase in wage rates of the unskilled rural labourers both in nominal and real terms (Chart 7).
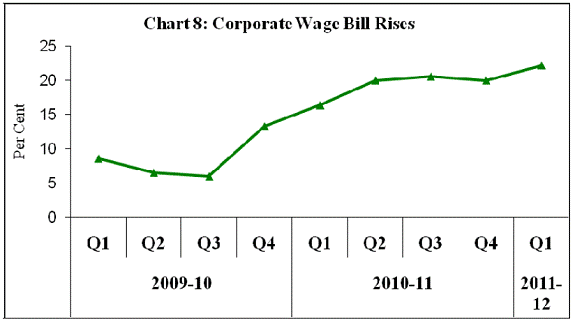
In the formal sector, company finance data suggest that the wage bill has risen at a faster rate since the middle of 2009-10 (Chart 8).
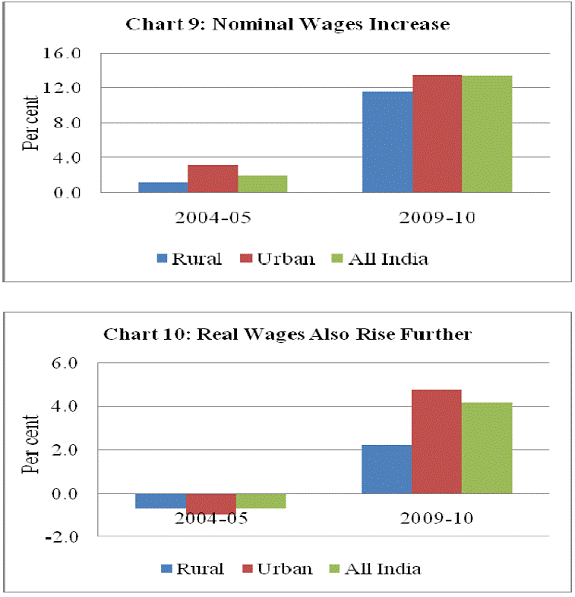
As per the NSSO surveys (61st round and 66th round), nominal wage rates of skilled workers in both rural and urban areas increased much faster in the second half of the 2000s than in the first half. While the real wage rates declined in the first half, it increased significantly in the second half of 2000s (Charts 9 & 10).
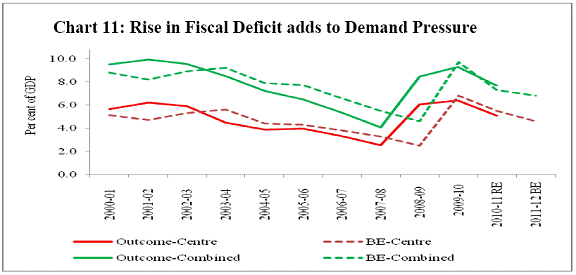
There has also been added stimulus from the crisis driven fiscal expansion as the fiscal consolidation process was reversed in 2008-09 and continued through 2009-10 (Chart 11).
These evidences taken together suggest that sustained rise in real wages both in the formal and informal sectors in the recent years contributed to increase in demand. Conclusions The recent surge in inflation has become more generalised. Food inflation, prone to supply shocks, is also assuming a structural character given the change in the dietary habits and high demand, in absence of adequate supply response. Sharp increase in non-food manufactured product inflation suggests that producers are able to pass on the cost increases, given higher demand. While the persistence in non-food manufactured products inflation is high, the persistence of food inflation has increased making the overall inflation rate sticky. The current inflation process, therefore, is an amalgam of both supply constraints and demand pressures. Prolonged high inflation even if originating from supply side would give rise to increased inflation expectations and cause general prices to rise. Poorly anchored inflation expectations make long-term financial planning more complex with potential adverse effects on investment and growth. Moreover, high inflation is the most regressive form of taxation, particularly on the poor. It is, therefore, important to contain inflation and keep inflation expectations anchored so that consumers do not mark up their long-run inflation expectations by reacting to a short period of higher-than-expected inflation. Keeping in view the costs of inflation and the fact that high inflation is inimical to sustained growth, the medium-term objective of the Reserve Bank is to bring down inflation to 3.0 per cent consistent with India’s broader integration with the global economy. In this direction, monetary policy aims to contain perceptions of inflation in the range of 4.0 – 4.5 per cent with a particular focus on the behaviour of the non-food manufacturing component, which is considered as core inflation given its high degree of persistence. Going forward, both global and domestic factors will shape the inflation outlook. With increasing global integration, global commodity prices are having an increasingly significant influence on domestic prices. It is expected that global commodity prices will peak in 2011 which should provide some relief to domestic inflation scenario. The Reserve Bank signaled the reversal from its crisis driven expansionary monetary policy stance in October 2009. Since then, the cash reserve ratio (CRR) has been raised by 100 basis points. The policy repo rate has been raised by a cumulative 325 basis points. As the liquidity in the system transited from surplus to deficit, the effective tightening has been of the order of 475 basis points. Thus, the cumulative monetary policy action would have the desired impact on inflation. While inflation is expected to moderate towards the later part of the year reflecting monetary tightening and likely softening of global commodity prices, fiscal policy needs to be supportive in containing aggregate demand. In addition, there is an urgent need to address the issue of structural supply constraints, particularly in agriculture, so that these do not become binding constraints in the long-run hampering the task of inflation management. * Speech by Shri Deepak Mohanty, Executive Director, Reserve Bank of India, delivered at the Motilal Nehru National Institute of Technology (MNNIT), Allahabad on 13th August 2011. The assistance provided by Abhiman Das, Sanjib Bordoloi and Manjusha Senapati is acknowledged. 1 Brazil, Russia, India China and South Africa. 2 While there is disagreement over the role of financial investment in commodity markets, financial flows to commodity funds typically increase with higher commodity prices further accentuating price pressures. 3 Core inflation is generally estimated by excluding volatile food and fuel components from the headline inflation, though there are various statistical methods of estimation of core inflation. Analytically, core inflation is considered as an indicator of demand conditions. 4 Estimated by Bai-Perron test. 5 Persistence is estimated as the sum of autoregressive coefficients of the inflation series of the relevant items; a coefficient of over 0.5 is considered to be an indication of persistence. 6 “The Price of Protein”, Inaugural Address at the Special Conference in honour of Dr. Kirit Parikh at IGIDR, Mumbai, October 26, 2010. 7 Includes non-food articles, metallic minerals, other minerals, coal, aviation turbine fuel, high speed diesel oil, naphtha, bitumen, furnace oil, lubricant, electricity for industry, cotton yarn and paper pulp with a weight of 16.2 in WPI. |
||||||||||||||||||||||||||||||||||||||||||||||||||||||||||||||||||||||||||||||||||||||||||||||||||||||||||||||||||||||||||||||||||||||||||||||||||||||||||||||||||||||||||||||||||||||||||||||||||||||
પેજની છેલ્લી અપડેટની તારીખ:


