 IST,
IST,


Sustainability of Economic Growth and Controlling Inflation: The Way Forward
Dr. Subir Gokarn, Deputy Governor, Reserve Bank of India
delivered-on એપ્રિલ 05, 2011
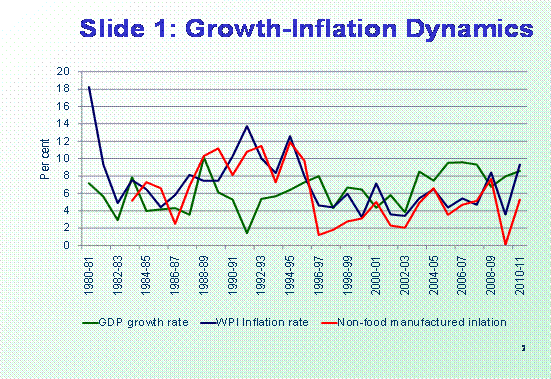
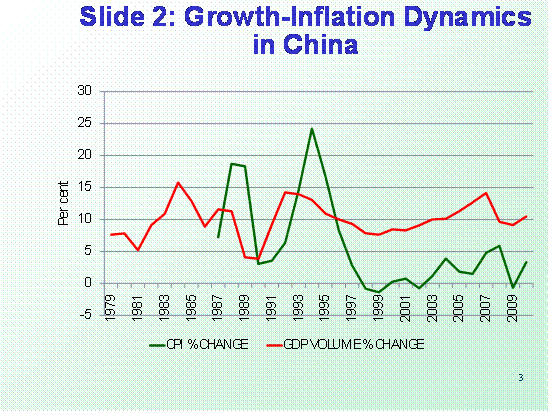
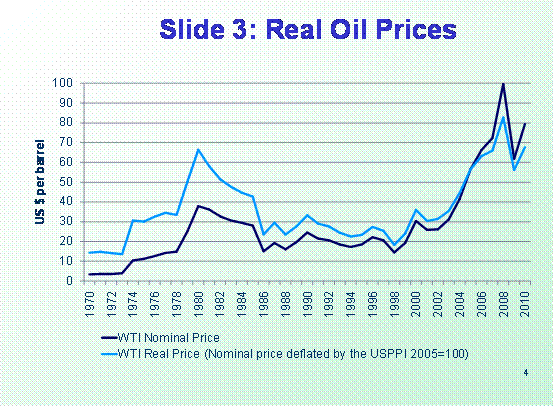
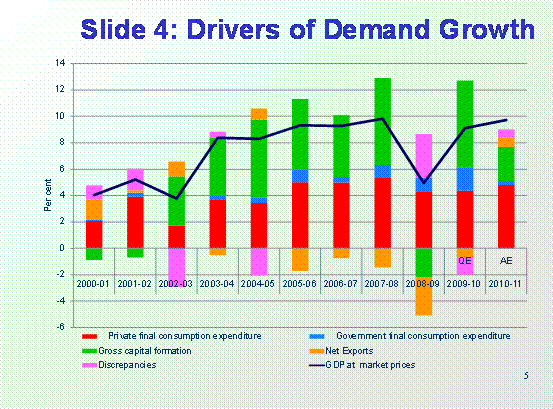
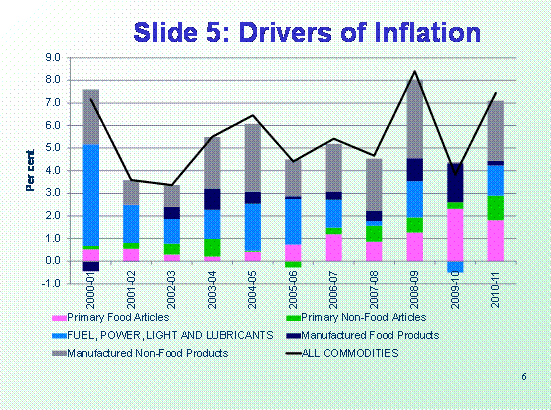
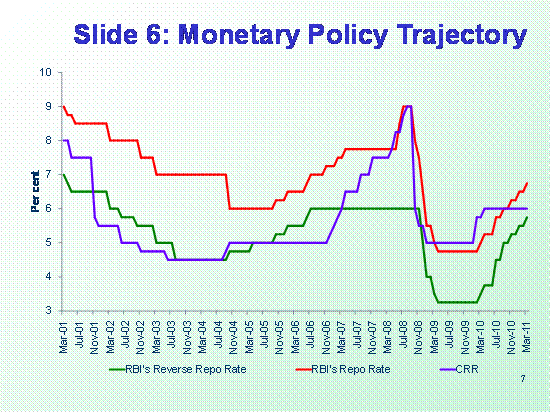
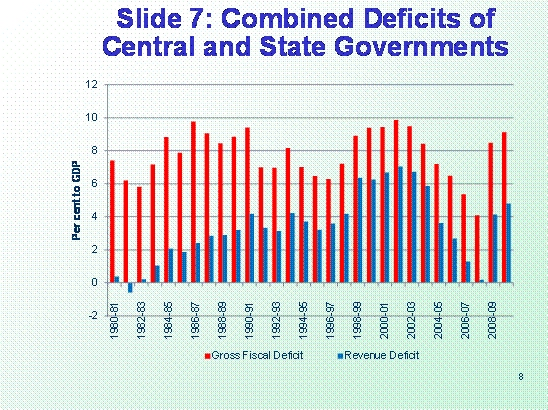
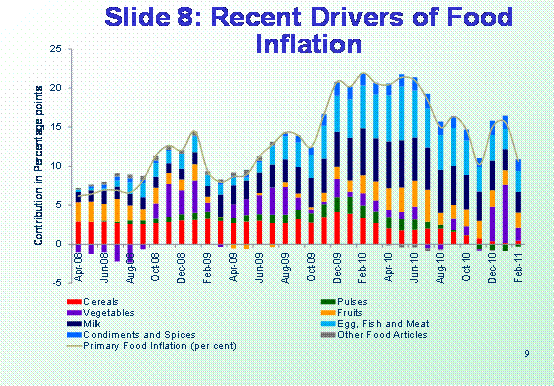
It is my pleasure to speak at FICCI’s National Executive Committee Meeting this year. As many observers have been highlighting, after a relatively long phase of benign, growth-friendly macroeconomic conditions, things have begun to look somewhat hostile on the macroeconomic front. The most significant manifestation of this is the acceleration of inflation, a trend that was visible even before the impact of the financial crisis was felt in late 2008, but which very quickly and strongly re-emerged as the economy began to recover in the second half of 2009-10. Despite significant actions on both policy rates and liquidity by the Reserve Bank, inflation remains high, giving rise to some very fundamental questions: is this high rate of inflation, previously believed to be unacceptable, now the new normal? Is it an unavoidable price to pay for sustaining the current growth trend? Or, will it actually work to undermine the sustainability of the current trend? Before arriving at a firm policy position on this issue, we must examine all the risks associated with persistently high rates of inflation over relatively long periods of time. In this address, I propose to do three things: 1. Examine the growth-inflation dynamics in the Indian economy over the past couple of decades to see if any patterns can be discerned; 2. Examine the drivers of the recent trends in inflation and relate them to underlying growth drivers; 3. Present some key issues and concerns that I believe should influence our policy thinking. The Growth-Inflation Relationship in India: The Post-1991 Experience Slide 1 displays the trajectories of growth and two indicators of inflation over the past two decades – the Wholesale Price Index (WPI), reflecting headline inflation and the Non-Food Manufacturing component of it. In our policy framework, we see the latter as a measure of ‘core’ inflation – that which is driven by demand side pressures. A number of patterns emerge that might provide a useful backdrop to the discussion of what lies ahead. First, we do see a striking contrast between the two episodes of high growth that the economy experienced after 1991. During the first episode, 1994-95 – 1996-97, both measures of inflation ran relatively high. In fact, the growth began to accelerate in the midst of an already uncomfortable inflationary environment, reflected by both the headline and core measures. The proximity between the two suggested that demand pressures were predominant. In this scenario, the only way that inflation would come down would be through demand compression and that is indeed what happened. An anti-inflationary monetary stance combined with a shock to exports in the wake of the East Asian crisis and a bad monsoon achieved this. Over the next few years, both growth and inflation rates were relatively low. The second high-growth episode began in 2003-04 and, with the exception of the slowdown during the crisis period, is still continuing. However, from the inflation perspective, this episode itself has two distinct segments. In the first few years, high growth was accompanied by low inflation, both headline and core. On the eve of the crisis period, both indicators increased significantly, suggesting the emergence of demand-side pressures. During the brief slowdown, both inflation indicators dropped sharply, but core fell far more than headline, indicating that supply-side pressures were now visible. The resurgence of inflation over the past year is the result of both demand and supply forces, as can be seen from sharp climb in both inflation indicators and the persistent gap between them. One impression from the contrast between these two episodes is that growth in a low-inflation environment can be more robust and enduring. This is partly because monetary policy can afford to accommodate growth by keeping interest rates low. However, as we saw, even in the more recent episode, demand pressures were driving inflation up, which saw the monetary policy stance, which I shall discuss in somewhat more detail later, reverse course during that period. A second observation, relating to recent developments, is that, while supply-side pressures have clearly impacted headline inflation, the relatively brief and shallow slowdown did not fully eliminate demand-side pressures from the system and these too have contributed to the recent behaviour of inflation. For comparison purposes, I will briefly discuss the Chinese growth-inflation dynamics before coming back to a more detailed discussion of recent Indian patterns. Slide 2 depicts the growth rates achieved by the Chinese economy since its own liberalization of the late 1970s and the behaviour of its Consumer Price Index over the period. Two episodes – one in the late 1980s and one in the mid-1990s – stand out. In both, a sharp rise in the inflation rate was followed by a decline in the growth rate. This was quite pronounced in the first episode and somewhat moderate, though unmistakable in the second. After that, growth has sustained at a relatively fast pace accompanied by relatively low inflation. Immediately before the crisis period, both growth and inflation accelerated sharply, suggesting the build-up of demand-side pressures. However, the overall impression, over a somewhat longer period than for India is that sustained high growth is concomitant with relatively low inflation. A final issue that I want to look at in this long-term perspective is the behaviour of crude oil prices. Slide 3 displays the trend of nominal prices as well as real prices, derived by deflating by the US Producer Price Index. During the period that we have been talking about, both moved in tandem. The 1990s were a benign period, with oil not exerting significant global inflationary pressure. In contrast, oil prices have risen persistently over the past decade, aggravating demand-driven inflationary pressures in the period before the crisis and continuing to do that after a brief respite. Recent Inflation Dynamics To provide a backdrop, let me first talk about some important characteristics of the recent episode of fast growth. Slide 4 displays the annual contribution to growth made by each of the components of aggregate demand. Private Consumption, the largest single component makes a steady contribution throughout the period, a factor influenced by its sheer size. But, the most significant feature of the period is the relatively large and sustained contribution of capital formation, or investment. The acceleration in growth seen since 2003-04 was preceded by a surge in investment spending, which then remained a very significant contributor to growth over the entire episode. It slumped during the crisis period, reflecting its high sensitivity to macroeconomic conditions, but recovered noticeably in the following year. When we bring the inflation trajectory back into the picture, we might infer that the combination of fast growth and low inflation is actually very conducive to high investment spending. With reference to today’s theme, this is obviously a relationship of great significance. Investment has the twin virtues of creating demand for goods and services in the present while simultaneously expanding the capacity to produce them in the future. It follows that a growth process that is more conducive to investment spending is more likely to be sustainable than one that is less conducive. The recent episode of fast growth in India suggests that low inflation is one factor that encourages investment spending. From this perspective, the reduction of the contribution of investment to growth in 2010-11 raises some concerns. Let me now provide some perspectives on recent inflation dynamics in India. Slide 5 displays the relative contributions of different components of the WPI to aggregate inflation over the past decade. There are a number of significant patterns in the graph. First, food inflation may have grabbed the headlines in recent months, but the fact is that it has been steadily increasing its contribution to overall inflation for some time now. A combination of factors may have aggravated the situation in the recent past, but the impact of sustained high growth on food consumption patterns cannot be wished away. In the absence of a strong supply response, increasing demand will inevitably lead to higher prices, a trend that may be reinforced by a monsoon failure or other shocks. This is what we are seeing on the food front today. Second, even though crude oil prices were increasing steadily over this period, the contribution of energy prices to inflation was variable. This was the result of a combination of differential rates of annual increases and restrictions on pass-through to domestic consumers. In fact, during the three-year period 2005-08, while aggregate inflation remained relatively steady, the relative contributions of food and energy swapped positions. In a sense, incipient food inflation was being offset by the moderating contribution from oil. Third, non-food manufacturing inflation, which, as I indicated earlier, we interpret as reflecting demand-side pressures, while contributing to inflation throughout the period, was fairly steady. However, in 2007-08, as overall inflation accelerated, so did this component. One explanation for this is that, with capacities being stretched, producers had significant pricing power. Consequently, the intensification of supply-side drivers, which is clearly visible in the graph that year, spilled over into a more generalized inflationary process. Of course, the picture changed dramatically during the crisis period, but it is striking that in 2010-11, the pattern is quite similar, with the added contribution from rising non-food primary articles. We do appear to be in a situation in which capacity constraints are helping convert supply-side pressures into generalized inflation. If, in fact, the contribution of investment spending to growth is declining, the constraints can only become more binding, further aggravating inflationary pressures if the growth momentum is kept going by other components of demand. I will end this section with a brief discussion on the monetary and fiscal policy trajectories during this period. Slide 6 displays the movement of monetary policy instruments before, during and after the crisis period. In the first phase depicted on the graph, there was a steady reduction in policy rates, motivated by a moderating inflation scenario. This was presumably supportive of investment activity, which, as we saw earlier, was relatively buoyant during this period. In 2005-06, the cycle turned and there were steady increases in policy rates and the cash reserve ratio (CRR) in response to the acceleration in inflation that was displayed in the previous graph. It is important to point out that investment activity apparently did not change course even as interest rates were being increased. This suggests that it is not just the immediate interest rate scenario that influences investment decisions. Actions taken to control inflation also help by providing reassurances about macroeconomic stability. As the impact of the crisis was felt, there as a sharp reversal in all policy instruments, a movement consistent with the inflationary pattern during the year, as seen by the complete disappearance of non-food manufacturing inflation. As the economy recovered, bringing with it a rather quick resurgence of inflationary pressures, the monetary stance has responded. The pace of action has been influenced by a number of domestic and global factors; the primary motivation being to keep the recovery going, while preventing the spill-over of supply-side pressures into a more generalized inflationary process. Slide 7 displays trends in the fiscal position, showing the combined revenue and fiscal deficits for centre and states. The main point that I would like to make from this picture is with reference to the fast growth episode of 2003-08. On the fiscal front, this period was characterized by a steady decline in the combined fiscal deficit, but, most importantly, a very sharp decline in the revenue deficit. What this meant was that not only was the government claiming relatively fewer resources, it was devoting a greater proportion of its spending to creating capital assets. In terms of the virtuous combination of high growth, low inflation and high investment that I have already characterized the episode by, these fiscal characteristics add another dimension to the understanding of conditions conducive to sustaining growth. The Way Forward: Issues and Concerns I would like to highlight three key messages from the preceding discussion as we look ahead at the challenges of sustaining growth while controlling inflation. First, from our own experience, low inflation and fiscal moderation, particularly on the revenue deficit, seem to be conducive to high investment rates and, consequently, to high and sustainable growth rates. Second, when growth is relatively rapid, supply-side inflationary pressures do spill over into more generalized inflation, presumably reflecting high pricing power of all producers, including workers. The implications of this for monetary policy are quite clear and direct: if there are signs of spill-over from supply-side to core, then a monetary response is warranted to prevent the process from spiralling out of control. Third, looking back at the previous high-growth episode, slower growth over a period of time will result in lower inflation, but we must recognize that both high inflation and slow growth have significant welfare costs. In essence, the challenge is to keep growth as high as possible without the risk of inflation spiralling out of control. In this context, there are two bodies of evidence that have a bearing on policies intending to sustain growth while controlling inflation. First, analysis of a large sample of countries over long periods of time does not suggest that more rapid growth phases were accompanied by higher rates of inflation. There have, of course, been periods when inflation rates have been high, but these have typically been followed by a slowdown in growth rates, presumably as a result of monetary actions but, more fundamentally, because the prospect of macroeconomic instability may lead to lower rates of investment. In general, the evidence across a large set of countries bears out what we observed in India over the high growth episode in India immediately before the crisis period and also in China over the past decade. Faster growth seems to persist in an environment of low inflation. Second, recent analytical work on the Phillips Curve, which represents the trade-off between growth (unemployment) and inflation suggests a break in the relationship between growth and inflation at some threshold rate of inflation (See of Akerlof, et al., 20001 and Palley, 20032, 20083). If inflation is below that rate, the analysis suggests that there is a trade-off between growth and inflation; growth can be accelerated (unemployment can be reduced) with some concomitant increase in inflation. However, above that threshold, the relationship is reversed; higher rates of inflation are accompanied by slower growth (higher unemployment). The main reason for the existence of such a threshold rate of inflation is the speed and magnitude with which the inflation rate feeds into inflationary expectations. Below the threshold, workers and producers do not raise their wage and price demands very often because the impact of inflation is not too visible. By contrast, they respond very quickly above the threshold because they are worried that high inflation will rapidly erode their living standards or profitability. In short, when inflation is high, the behaviour of workers and producers increases the likelihood that it will increase further. Putting the two together, one could argue that keeping inflation below the threshold at all times serves both the short term objective of macroeconomic stability, or minimizing the deviation of the growth rate from its sustainable trend, and the long-term objective of raising the trend by encouraging investment activity. Do we know what the threshold is for the Indian economy? The Report on Currency and Finance, an annual research publication of the Reserve Bank of India, examined this question in its 2000-01 issue and came to the conclusion that the “growth-maximizing rate of inflation” for the Indian economy was 5 per cent.4 Of course, in a rapidly evolving environment, this number could well be different now; the average rate of inflation during the pre-crisis period high growth episode was slightly below this number. But, even if it is different, it is unlikely to be significantly higher. The current rate of inflation does raise concerns about the risks of spiralling, as high inflation becomes increasingly entrenched into the wage and price setting behaviour of workers and producers. In turn, if this were to adversely impact investment activity, the growth momentum would inevitably slow down. In essence, the trade-off is more between inflation now and growth in the future. Before I conclude, I would like to briefly address the very fundamental issue of food inflation. Slide 8 displays the relative contributions made by different food groups to overall food inflation. For much of the past several months, the dominant contributors to it have been pulses, milk, eggs, fish and meat and fruits. Cereals have made virtually no contribution, while vegetables, with the exception of the onion spike (other vegetables also contributed) in late 2010, were not very significant contributors. To reiterate a point we have been making in both our policy statements and other communications: this pattern is the outcome of consumption baskets being diversified by an increasing number of households as they cross some income threshold. The increase in prices indicates that supply is just not keeping pace with demand. The only way to keep food prices in check is to produce more of what people want to consume. There are several initiatives in the Union Budget for 2011-12, which are based on this recognition. Now, the emphasis must be on implementing the schemes for quick increases in productivity and output of the items in question. Concluding Remarks I began by raising three questions: is this high rate of inflation, previously believed to be unacceptable, now the new normal? Is it an unavoidable price to pay for sustaining the current growth trend? Or, will it actually work to undermine the sustainability of the current trend? Based on the preceding discussion, let me attempt a combined answer. Acceptance of a higher rate of inflation as the new normal - an inevitable consequence of rapid growth – will raise risks of accelerating inflation. In turn, this is likely to weaken incentives for investment, which will threaten the sustainability of growth. This is a vicious circle of high inflation, low investment and slowing growth. The alternative is the kind of virtuous circle that the economy has already experienced during the five years preceding the crisis period. This was characterized by low inflation, high investment and fiscal consolidation, particularly on the revenue account, accompanying high growth as well as resilience during the crisis period. That is the configuration that we need to re-create to sustain growth. Both monetary and fiscal policies have a role in achieving this configuration. The challenge for monetary policy is to prevent supply-side inflationary pressures from spilling over into more generalized inflation, both by managing expectations and by reining in demand. This needs to be done with minimal disruption to growth, particularly investment activity. The challenge for fiscal policy is to bring down the fiscal deficit, particularly on the revenue account. This needs to be done while ensuring both resource allocation and effective implementation of programmes dealing with critical supply constraints in food and elsewhere. Significantly, both sets of challenges have to be met amidst an uncertain global environment, both generally and with respect to oil prices. I shall end with reference to the topic of today’s address. The issue is not so much one of higher inflation for faster growth in the present. It is about the risks that higher inflation now poses for faster growth in the future. In other words, sustainability of growth over the long term does require controlling inflation. I thank the National Executive Committee of FICCI for inviting me to speak on this occasion and wish them success both for a successful event and a successful year ahead.
* Inputs from Bhupal Singh, Sitikantha Pattanaik and Mridul Saggar are gratefully acknowledged. 1 Akerlof, G.A., Dickens, W.T. and Perry, G.L. (2000), “The Near-Rational Wage and Price Setting and the Long Run Phillips Curve”, Brookings Paper of Economic Activity, 1: 1-60. 2 Palley, T.I. (2003), “The Backward Bending Phillips Curve and the Minimum Unemployment Rate of Inflation (MURI): Wage Adjustment with Opportunistic Firms”, The Manchester School of Economic and Social Studies, 71(1): 35-50. 3 Palley T. I. (2008), “The Backward Bending Phillips Curves:A Simple Model”, Working Paper No. 168, Political Economy Research Institute, University of Massachusetts, Amerhest 4 Reserve Bank of India (2002), "Growth, Inflation and the Conduct of Monetary Policy", Report on Currency and Finance 2000-01. |
પેજની છેલ્લી અપડેટની તારીખ:


