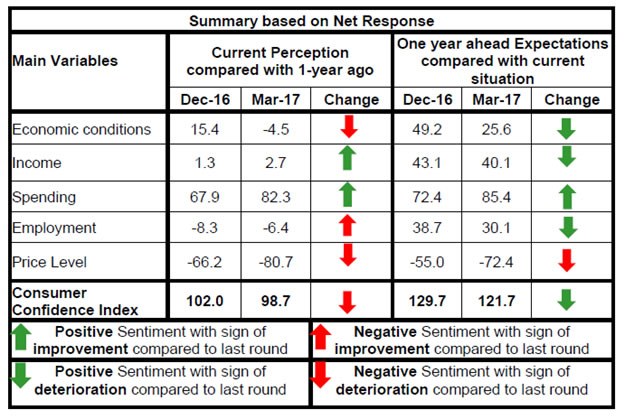
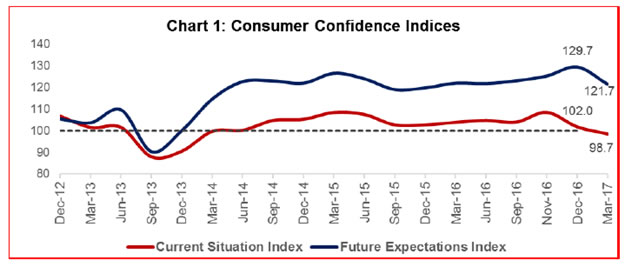
The March 2017 round of the Consumer Confidence Survey (CCS)1 conducted by the Reserve Bank in six metropolitan cities - Bengaluru; Chennai; Hyderabad; Kolkata; Mumbai; and New Delhi- obtained 4,890 responses on households’ perceptions and expectations of general economic conditions, the employment scenario, the price situation in the country and their own income and spending. Highlights: I. The Current Situation Index (CSI)2 entered into the pessimistic zone (98.7) in March 2017 due to worsening sentiments on economic conditions and price situation. II. The Future Expectations Index (FEI) also declined sharply to 121.7 in March 2017 from 129.7 in the December 2016 round, with the outlook on all parameters, barring spending, worsening (Chart 1). III. Households’ current perceptions on the economic situation worsened significantly in March 2017, with the net response slipping into negative zone for the first time since September 2014; respondents’ outlook on future economic conditions also worsened, though it remained in the optimistic zone. (Table 1). IV. Households’ current perceptions on their income level picked up marginally in March 2017, from the ‘low’ in the December 2016 round; however, their outlook on income one year ahead was less optimistic than in the December 2016 (Table 2). V. Respondents reported increase in overall spending in March 2017 and expected it to rise further over the year ahead (Table 3) in respect of both essential and non-essential spending (Table 4 & 5). VI. Perceptions on employment remained pessimistic (Table 6). VII. The assessment of/ outlook on current/future inflation showed significant worsening in the March 2017 round, contrary to the improvement observed in the December 2016. (Table 7 and 8). | Table 1: Perceptions and Expectations on Economic Conditions | | Survey Round | Current Perception | One year Ahead Expectation | | Improved | Remained Same | Worsened | Net Response | Will improve | Will remain same | Will worsen | Net Response | | Sep-15 | 36.5 | 32.7 | 30.9 | 5.6 | 47.7 | 32.1 | 20.3 | 27.4 | | Dec-15 | 38.0 | 30.9 | 31.1 | 7.0 | 51.0 | 27.6 | 21.4 | 29.6 | | Mar-16 | 39.9 | 30.3 | 29.8 | 10.1 | 54.6 | 27.2 | 18.2 | 36.4 | | June-16 | 40.2 | 27.9 | 31.9 | 8.2 | 54.2 | 25.5 | 20.4 | 33.8 | | Sept-16 | 44.6 | 30.1 | 25.3 | 19.4 | 57.7 | 24.3 | 18.0 | 39.6 | | Nov-16 | 49.5 | 26.6 | 23.9 | 25.6 | 63.0 | 18.7 | 18.3 | 44.8 | | Dec-16 | 45.7 | 24.1 | 30.3 | 15.4 | 66.3 | 16.6 | 17.1 | 49.2 | | Mar-17 | 35.6 | 24.4 | 40.0 | -4.5 | 52.1 | 21.4 | 26.5 | 25.6 |
| Table 2: Perceptions and Expectations on Income | | (Percentage responses) | | Survey Round | Current Perception | One year Ahead Expectation | | Increased | Remained same | Decreased | Net Response | Will increase | Will remain same | Will decrease | Net Response | | Sep-15 | 29.1 | 50.4 | 20.5 | 8.6 | 47.1 | 42.4 | 10.5 | 36.6 | | Dec-15 | 28.7 | 50.2 | 21.1 | 7.7 | 49.1 | 40.4 | 10.5 | 38.6 | | Mar-16 | 31.3 | 48.9 | 19.8 | 11.5 | 52.1 | 39.3 | 8.6 | 43.5 | | June-16 | 29.9 | 51.8 | 18.4 | 11.5 | 51.2 | 39.9 | 8.9 | 42.3 | | Sept-16 | 31.2 | 48.6 | 20.2 | 11.1 | 52.3 | 36.4 | 11.3 | 41.1 | | Nov-16 | 37.3 | 45.5 | 17.2 | 20.1 | 57.1 | 33.4 | 9.4 | 47.7 | | Dec-16 | 27.1 | 47.1 | 25.8 | 1.3 | 54.8 | 33.5 | 11.7 | 43.1 | | Mar-17 | 27.7 | 47.3 | 25.0 | 2.7 | 51.8 | 36.5 | 11.7 | 40.1 |
| Table 3: Perceptions and Expectations on Spending | | (Percentage responses) | | Survey Round | Current Perception | One year Ahead Expectation | | Increased | Remained same | Decreased | Net Response | Will increase | Will remain same | Will decrease | Net Response | | Sep-15 | 81.0 | 10.7 | 8.2 | 72.8 | 80.9 | 11.2 | 7.9 | 73.0 | | Dec-15 | 78.7 | 9.8 | 11.5 | 67.2 | 79.3 | 10.1 | 10.6 | 68.6 | | Mar-16 | 78.0 | 9.9 | 12.1 | 65.9 | 78.5 | 10.6 | 11.0 | 67.5 | | June-16 | 82.7 | 8.4 | 8.8 | 73.9 | 82.2 | 10.2 | 7.6 | 74.6 | | Sept-16 | 70.3 | 24.1 | 5.7 | 64.6 | 79.1 | 17.0 | 3.9 | 75.2 | | Nov-16 | 73.2 | 23.6 | 3.2 | 70.0 | 77.3 | 20.3 | 2.5 | 74.8 | | Dec-16 | 73.5 | 20.8 | 5.6 | 67.9 | 78.3 | 15.8 | 5.9 | 72.4 | | Mar-17 | 84.4 | 13.4 | 2.1 | 82.3 | 88.5 | 8.3 | 3.1 | 85.4 |
| Table 4: Perceptions and Expectations on Spending-Essential Items | | (Percentage responses) | | Survey Round | Current Perception | One year Ahead Expectation | | Increased | Remained same | Decreased | Net Response | Will increase | Will remain same | Will decrease | Net Response | | Sep-15 | 82.0 | 9.7 | 8.4 | 73.6 | 80.1 | 11.6 | 8.3 | 71.9 | | Dec-15 | 81.4 | 9.0 | 9.6 | 71.8 | 81.5 | 9.4 | 9.1 | 72.4 | | Mar-16 | 79.6 | 9.3 | 11.1 | 68.5 | 78.6 | 11.9 | 9.6 | 69.0 | | June-16 | 83.0 | 8.2 | 8.8 | 74.3 | 81.1 | 10.6 | 8.3 | 72.8 | | Sept-16 | 79.1 | 16.9 | 4.0 | 75.1 | 82.5 | 12.7 | 4.8 | 77.6 | | Nov-16 | 81.7 | 15.2 | 3.1 | 78.6 | 85.1 | 10.9 | 4.0 | 81.1 | | Dec-16 | 76.9 | 18.4 | 4.7 | 72.2 | 77.5 | 14.9 | 7.7 | 69.8 | | Mar-17 | 85.8 | 11.1 | 3.1 | 82.7 | 87.0 | 9.2 | 3.8 | 83.2 |
| Table 5: Perceptions and Expectations on Spending-Non-Essential Items | | (Percentage responses) | | Survey Round | Current Perception | One year Ahead Expectation | | Increased | Remained same | Decreased | Net Response | Will increase | Will remain same | Will decrease | Net Response | | Sep-15 | 41.2 | 35.0 | 23.8 | 17.4 | 44 | 34.2 | 21.8 | 22.2 | | Dec-15 | 45.3 | 28.9 | 25.8 | 19.5 | 49.2 | 28.6 | 22.2 | 27.1 | | Mar-16 | 37.7 | 31.7 | 30.6 | 7.1 | 44.7 | 33.2 | 22.1 | 22.6 | | June-16 | 43.9 | 32.3 | 23.8 | 20.1 | 51.2 | 30.3 | 18.5 | 32.7 | | Sept-16 | 50.2 | 37.6 | 12.2 | 38.0 | 60.6 | 29.5 | 9.9 | 50.7 | | Nov-16 | 52.2 | 36.8 | 11.1 | 41.1 | 62.7 | 27.6 | 9.7 | 53.0 | | Dec-16 | 37.3 | 44.7 | 18.1 | 19.2 | 49.6 | 35.8 | 14.7 | 34.9 | | Mar-17 | 48.9 | 36.4 | 14.7 | 34.2 | 57.8 | 30.3 | 11.8 | 46.0 |
| Table 6: Perceptions and Expectations on Employment | | (Percentage responses) | | Survey Round | Current Perception | One year Ahead Expectation | | Improved | Remained Same | Worsened | Net Response | Will improve | Will remain same | Will worsen | Net Response | | Sep-15 | 31.9 | 34.8 | 33.3 | -1.4 | 47.1 | 33.4 | 19.5 | 27.6 | | Dec-15 | 34.0 | 34.7 | 31.3 | 2.6 | 51.6 | 29.8 | 18.7 | 32.9 | | Mar-16 | 34.3 | 31.1 | 34.6 | -0.3 | 50.4 | 31.4 | 18.1 | 32.3 | | June-16 | 35.6 | 28.7 | 35.7 | -0.2 | 51.1 | 29.6 | 19.3 | 31.8 | | Sept-16 | 31.7 | 36.4 | 31.9 | -0.2 | 50.5 | 30.5 | 19.0 | 31.5 | | Nov-16 | 37.6 | 30.9 | 31.4 | 6.2 | 55.7 | 26.6 | 17.7 | 37.9 | | Dec-16 | 31.0 | 29.8 | 39.2 | -8.3 | 57.3 | 24.1 | 18.6 | 38.7 | | Mar-17 | 32.6 | 28.4 | 39.0 | -6.4 | 52.8 | 24.5 | 22.7 | 30.1 |
| Table 7: Perceptions and Expectations on Price Level | | (Percentage responses) | | Survey Round | Current Perception | One year Ahead Expectation | | Increased | Remained same | Decreased | Net Response | Will increase | Will remain same | Will decrease | Net Response | | Sep-15 | 80.9 | 9.4 | 9.8 | -71.1 | 78.0 | 12.4 | 9.5 | -68.5 | | Dec-15 | 79.5 | 10.9 | 9.6 | -70.0 | 78.9 | 11.7 | 9.4 | -69.5 | | Mar-16 | 77.3 | 12.4 | 10.4 | -66.9 | 78.6 | 11.7 | 9.7 | -68.8 | | June-16 | 78.1 | 12.5 | 9.4 | -68.7 | 80.5 | 11.5 | 8.0 | -72.6 | | Sept-16 | 78.2 | 17.2 | 4.6 | -73.6 | 77.8 | 15.4 | 6.9 | -70.9 | | Nov-16 | 82.2 | 14.3 | 3.6 | -78.6 | 82.9 | 11.9 | 5.2 | -77.7 | | Dec-16 | 73.9 | 18.3 | 7.7 | -66.2 | 69.5 | 16.0 | 14.5 | -55.0 | | Mar-17 | 85.8 | 9.1 | 5.1 | -80.7 | 81.0 | 10.4 | 8.6 | -72.4 |
| Table 8: Perceptions and Expectations on Rate of Change in Price Level (Inflation)* | | (Percentage responses) | | Survey Round | Current Perception | One year Ahead Expectation | | Increased | Remained same | Decreased | Net Response | Will increase | Will remain same | Will decrease | Net Response | | Sep-15 | 82.7 | 14.6 | 2.7 | -80.0 | 81.1 | 16.3 | 2.6 | -78.5 | | Dec-15 | 86.3 | 10.8 | 2.9 | -83.4 | 85.4 | 11.7 | 2.8 | -82.6 | | Mar-16 | 82.7 | 13.9 | 3.4 | -79.3 | 82.4 | 13.2 | 4.4 | -78.0 | | June-16 | 85.3 | 12.4 | 2.3 | -83.0 | 83.3 | 13.0 | 3.7 | -79.6 | | Sept-16 | 61.8 | 22.4 | 15.8 | -45.9 | 64.3 | 22.4 | 13.3 | -51.0 | | Nov-16 | 64.5 | 18.2 | 17.3 | -47.2 | 66.8 | 18.6 | 14.6 | -52.1 | | Dec-16 | 57.8 | 18.0 | 24.2 | -33.5 | 62.4 | 17.1 | 20.6 | -41.8 | | Mar-17 | 80.5 | 12.5 | 7.0 | -73.5 | 79.9 | 13.8 | 6.3 | -73.6 | | *Applicable only for those respondents who felt price has increased/price will increase. |
|  IST,
IST,