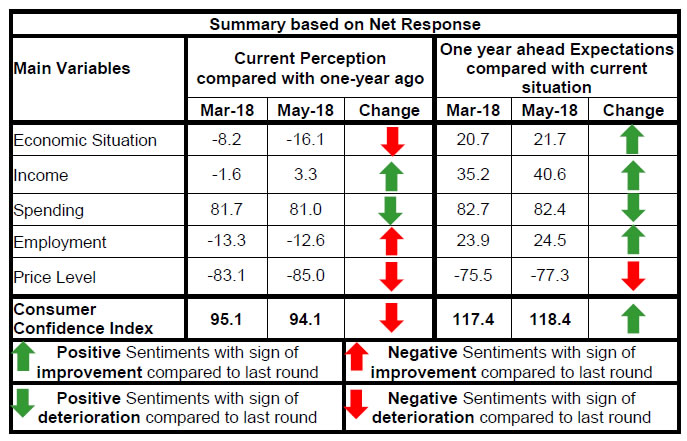
Today, the Reserve Bank released the results of the May 2018 round of its Consumer Confidence Survey (CCS)1. The survey was conducted in six metropolitan cities - Bengaluru; Chennai; Hyderabad; Kolkata; Mumbai; and New Delhi - and obtained 5,077 responses on households’ perceptions and expectations on the general economic situation, the employment scenario, the overall price situation and their own income and spending. Highlights: I. The level of consumer confidence in May 2018 was almost similar to that in March 2018; while the current situation index (CSI)2 slid down by one point into the pessimistic zone, the future expectations index (FEI) showed a marginal uptick (Chart 1). Note: Please see the excel file for time series data II. Households’ sentiments on the general economic situation for the current period worsened from the previous round as 48 per cent of the respondents felt that the situation had deteriorated; expectations for the next year, however, improved over their level in the previous round (Table 1). III. While households remained pessimistic about the current employment situation, their sentiments were marginally better for the future (Table 2). IV. Prices continued to remain a concern for households, and their outlook for the next year was largely unchanged. (Tables 3 and 4). V. Respondents’ perceptions regarding their current income turned positive with an improvement of around 5 percentage points, and the outlook for one year ahead also improved by a similar magnitude (Table 5). VI. The proportion of households expecting their spending to increase in the next one year remained almost unchanged from the previous round (Table 6). VII. As regards spending on non-essential (or discretionary) items, households’ responses shifted towards similar or lower levels of expenditure, possibly reflecting pessimism on the perception and outlook on prices (Table 8). | Table 1: Perceptions and Expectations on General Economic Situation | | (Percentage responses) | | Survey Round | Current Perception | One year ahead Expectation | | Improved | Remained Same | Worsened | Net Response | Will Improve | Will Remain Same | Will Worsen | Net Response | | Dec-16 | 45.7 | 24.1 | 30.3 | 15.4 | 66.3 | 16.6 | 17.1 | 49.2 | | Mar-17 | 35.6 | 24.4 | 40.0 | -4.5 | 52.1 | 21.4 | 26.5 | 25.6 | | May-17 | 36.4 | 25.9 | 37.7 | -1.3 | 52.4 | 23.5 | 24.1 | 28.3 | | Jun-17 | 32.4 | 27.7 | 39.9 | -7.5 | 48.6 | 25.9 | 25.5 | 23.1 | | Sep-17 | 34.6 | 24.7 | 40.7 | -6.2 | 50.8 | 22.8 | 26.3 | 24.5 | | Nov-17 | 28.9 | 23.3 | 47.9 | -18.9 | 45.2 | 24.1 | 30.6 | 14.6 | | Dec-17 | 36.8 | 25.8 | 37.4 | -0.6 | 54.4 | 22.7 | 22.9 | 31.5 | | Mar-18 | 33.7 | 24.5 | 41.8 | -8.2 | 48.3 | 24.0 | 27.6 | 20.7 | | May-18 | 31.9 | 20.1 | 48.0 | -16.1 | 49.5 | 22.7 | 27.8 | 21.7 |
| Table 2: Perceptions and Expectations on Employment | | (Percentage responses) | | Survey Round | Current Perception | One year ahead Expectation | | Improved | Remained Same | Worsened | Net Response | Will Improve | Will Remain Same | Will Worsen | Net Response | | Dec-16 | 31.0 | 29.8 | 39.2 | -8.3 | 57.3 | 24.1 | 18.6 | 38.7 | | Mar-17 | 32.6 | 28.4 | 39.0 | -6.4 | 52.8 | 24.5 | 22.7 | 30.1 | | May-17 | 32.5 | 28.3 | 39.2 | -6.8 | 52.7 | 26.7 | 20.7 | 32.0 | | Jun-17 | 30.8 | 30.3 | 38.9 | -8.1 | 49.6 | 29.3 | 21.2 | 28.4 | | Sep-17 | 30.1 | 26.3 | 43.7 | -13.6 | 49.9 | 24.0 | 26.1 | 23.8 | | Nov-17 | 27.5 | 25.7 | 46.8 | -19.2 | 45.1 | 27.5 | 27.4 | 17.8 | | Dec-17 | 30.3 | 28.4 | 41.3 | -11.0 | 53.1 | 25.9 | 21.1 | 32.0 | | Mar-18 | 29.9 | 26.9 | 43.2 | -13.3 | 49.5 | 25.0 | 25.5 | 23.9 | | May-18 | 31.5 | 24.4 | 44.1 | -12.6 | 49.5 | 25.5 | 25.0 | 24.5 |
| Table 3: Perceptions and Expectations on Price Level | | (Percentage responses) | | Survey Round | Current Perception | One year ahead Expectation | | Increased | Remained Same | Decreased | Net Response | Will Increase | Will Remain Same | Will Decrease | Net Response | | Dec-16 | 73.9 | 18.3 | 7.7 | -66.2 | 69.5 | 16.0 | 14.5 | -55.0 | | Mar-17 | 85.8 | 9.1 | 5.1 | -80.7 | 81.0 | 10.4 | 8.6 | -72.4 | | May-17 | 83.3 | 11.3 | 5.4 | -78.0 | 79.7 | 11.5 | 8.8 | -70.9 | | Jun-17 | 85.2 | 11.4 | 3.4 | -81.8 | 76.1 | 13.8 | 10.1 | -66.0 | | Sep-17 | 87.7 | 8.7 | 3.6 | -84.1 | 81.0 | 12.5 | 6.5 | -74.5 | | Nov-17 | 89.9 | 7.1 | 3.0 | -86.9 | 82.9 | 10.4 | 6.7 | -76.2 | | Dec-17 | 89.9 | 7.1 | 3.0 | -86.9 | 80.1 | 12.4 | 7.5 | -72.6 | | Mar-18 | 86.7 | 9.8 | 3.6 | -83.1 | 82.1 | 11.4 | 6.6 | -75.5 | | May-18 | 88.2 | 8.6 | 3.2 | -85.0 | 83.1 | 11.1 | 5.9 | -77.3 |
| Table 4: Perceptions and Expectations on Rate of Change in Price Level (Inflation)* | | (Percentage responses) | | Survey Round | Current Perception | One year ahead Expectation | | Increased | Remained Same | Decreased | Net Response | Will Increase | Will Remain Same | Will Decrease | Net Response | | Dec-16 | 57.8 | 18.0 | 24.2 | -33.5 | 62.4 | 17.1 | 20.6 | -41.8 | | Mar-17 | 80.5 | 12.5 | 7.0 | -73.5 | 79.9 | 13.8 | 6.3 | -73.6 | | May-17 | 82.0 | 10.0 | 8.0 | -74.0 | 82.6 | 10.9 | 6.5 | -76.1 | | Jun-17 | 79.9 | 11.5 | 8.5 | -71.4 | 78.7 | 13.5 | 7.9 | -70.8 | | Sep-17 | 80.6 | 10.4 | 9.0 | -71.5 | 78.6 | 14.1 | 7.2 | -71.4 | | Nov-17 | 82.9 | 9.0 | 8.1 | -74.8 | 80.4 | 12.1 | 7.5 | -72.9 | | Dec-17 | 80.4 | 12.8 | 6.8 | -73.6 | 76.9 | 17.0 | 6.1 | -70.8 | | Mar-18 | 79.9 | 13.2 | 6.9 | -73.0 | 80.2 | 13.4 | 6.4 | -73.8 | | May-18 | 79.2 | 13.5 | 7.3 | -71.9 | 78.0 | 16.5 | 5.5 | -72.5 | | *Applicable only for those respondents who felt price has increased/price will increase. |
| Table 5: Perceptions and Expectations on Income | | (Percentage responses) | | Survey Round | Current Perception | One year ahead Expectation | | Increased | Remained Same | Decreased | Net Response | Will Increase | Will Remain Same | Will Decrease | Net Response | | Dec-16 | 27.1 | 47.1 | 25.8 | 1.3 | 54.8 | 33.5 | 11.7 | 43.1 | | Mar-17 | 27.7 | 47.3 | 25.0 | 2.7 | 51.8 | 36.5 | 11.7 | 40.1 | | May-17 | 28.2 | 48.0 | 23.8 | 4.4 | 52.8 | 38.1 | 9.1 | 43.6 | | Jun-17 | 23.8 | 53.8 | 22.4 | 1.4 | 47.1 | 43.5 | 9.4 | 37.7 | | Sep-17 | 26.6 | 46.8 | 26.6 | -0.1 | 48.5 | 39.0 | 12.5 | 36.1 | | Nov-17 | 24.4 | 47.6 | 28.0 | -3.6 | 45.6 | 41.8 | 12.6 | 33.0 | | Dec-17 | 25.2 | 50.7 | 24.1 | 1.1 | 50.7 | 39.1 | 10.3 | 40.5 | | Mar-18 | 23.5 | 51.5 | 25.1 | -1.6 | 46.9 | 41.3 | 11.7 | 35.2 | | May-18 | 27.2 | 48.9 | 23.9 | 3.3 | 50.8 | 38.9 | 10.3 | 40.6 |
| Table 6: Perceptions and Expectations on Spending | | (Percentage responses) | | Survey Round | Current Perception | One year ahead Expectation | | Increased | Remained Same | Decreased | Net Response | Will Increase | Will Remain Same | Will Decrease | Net Response | | Dec-16 | 73.5 | 20.8 | 5.6 | 67.9 | 78.3 | 15.8 | 5.9 | 72.4 | | Mar-17 | 84.4 | 13.4 | 2.1 | 82.3 | 88.5 | 8.3 | 3.1 | 85.4 | | May-17 | 83.4 | 14.9 | 1.6 | 81.8 | 86.0 | 11.9 | 2.0 | 84.0 | | Jun-17 | 81.3 | 17.2 | 1.5 | 79.8 | 83.5 | 13.7 | 2.8 | 80.7 | | Sep-17 | 83.2 | 15.0 | 1.8 | 81.5 | 85.8 | 12.3 | 2.0 | 83.8 | | Nov-17 | 85.6 | 13.1 | 1.3 | 84.2 | 86.8 | 11.0 | 2.3 | 84.6 | | Dec-17 | 83.9 | 14.3 | 1.8 | 82.1 | 84.7 | 12.5 | 2.9 | 81.8 | | Mar-18 | 83.5 | 14.7 | 1.8 | 81.7 | 85.0 | 12.6 | 2.4 | 82.7 | | May-18 | 83.2 | 14.5 | 2.3 | 81.0 | 84.8 | 12.8 | 2.4 | 82.4 |
| Table 7: Perceptions and Expectations on Spending- Essential Items | | (Percentage responses) | | Survey Round | Current Perception | One year ahead Expectation | | Increased | Remained Same | Decreased | Net Response | Will Increase | Will Remain Same | Will Decrease | Net Response | | Dec-16 | 76.9 | 18.4 | 4.7 | 72.2 | 77.5 | 14.9 | 7.7 | 69.8 | | Mar-17 | 85.8 | 11.1 | 3.1 | 82.7 | 87.0 | 9.2 | 3.8 | 83.2 | | May-17 | 85.7 | 11.6 | 2.8 | 82.9 | 86.9 | 9.6 | 3.5 | 83.4 | | Jun-17 | 82.2 | 15.3 | 2.5 | 79.7 | 81.9 | 13.5 | 4.6 | 77.2 | | Sep-17 | 85.0 | 12.6 | 2.4 | 82.6 | 86.1 | 10.9 | 3.0 | 83.1 | | Nov-17 | 86.8 | 11.3 | 1.9 | 85.0 | 86.2 | 10.7 | 3.2 | 83.0 | | Dec-17 | 85.2 | 13.0 | 1.8 | 83.4 | 85.2 | 10.9 | 4.0 | 81.2 | | Mar-18 | 83.9 | 13.8 | 2.3 | 81.5 | 84.8 | 12.3 | 3.0 | 81.8 | | May-18 | 85.0 | 12.4 | 2.7 | 82.3 | 84.8 | 11.7 | 3.5 | 81.3 |
| Table 8: Perceptions and Expectations on Spending- Non-Essential Items | | (Percentage responses) | | Survey Round | Current Perception | One year ahead Expectation | | Increased | Remained Same | Decreased | Net Response | Will Increase | Will Remain Same | Will Decrease | Net Response | | Dec-16 | 37.3 | 44.7 | 18.1 | 19.2 | 49.6 | 35.8 | 14.7 | 34.9 | | Mar-17 | 48.9 | 36.4 | 14.7 | 34.2 | 57.8 | 30.3 | 11.8 | 46.0 | | May-17 | 51.9 | 34.6 | 13.5 | 38.3 | 59.9 | 31.1 | 9.0 | 50.9 | | Jun-17 | 51.6 | 35.5 | 13.0 | 38.6 | 56.3 | 32.6 | 11.1 | 45.2 | | Sep-17 | 54.0 | 34.4 | 11.7 | 42.4 | 60.2 | 30.6 | 9.2 | 50.9 | | Nov-17 | 56.5 | 32.5 | 11.0 | 45.5 | 60.6 | 31.1 | 8.3 | 52.3 | | Dec-17 | 51.1 | 36.6 | 12.3 | 38.8 | 57.3 | 33.6 | 9.1 | 48.2 | | Mar-18 | 54.5 | 32.5 | 12.9 | 41.6 | 61.2 | 29.4 | 9.4 | 51.8 | | May-18 | 52.1 | 32.9 | 15.1 | 37.0 | 57.3 | 32.8 | 9.9 | 47.4 |
|  IST,
IST,