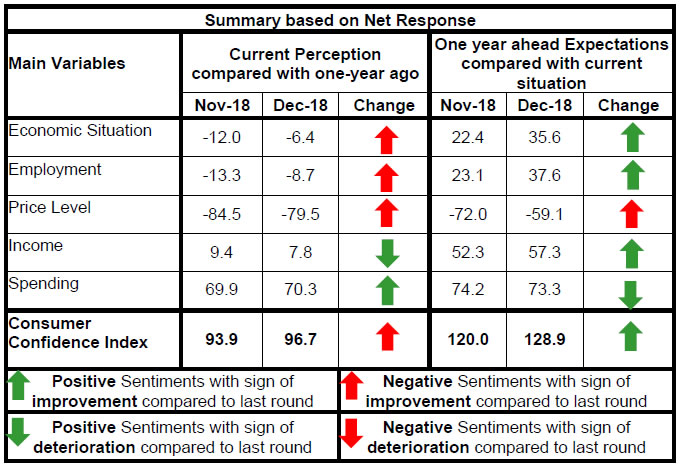
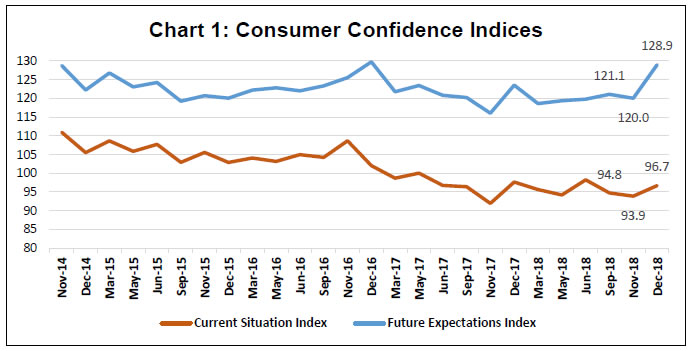
Today, the Reserve Bank released the results of the December 2018 round of its Consumer Confidence Survey (CCS)1. The survey was conducted in 13 major cities – Ahmedabad; Bengaluru; Bhopal; Chennai; Delhi; Guwahati; Hyderabad; Jaipur; Kolkata; Lucknow; Mumbai; Patna; and Thiruvananthapuram - and obtained 5,347 responses on households’ perceptions and expectations on the general economic situation, the employment scenario, the overall price situation and their own income and spending. Highlights: I. Consumer confidence turned around in the December 2018 round with the current situation index (CSI)2 gaining 2.8 points, though still remaining in pessimistic territory. II. The future expectations index (FEI) recorded a sharp uptick, with increased optimism about the general economic situation and employment scenario (Chart 1). Note: Please see the excel file for time series data III. Pessimism on the general economic situation in the last few rounds seems to have been arrested in the current round; the outlook for the year ahead was also more optimistic than before (Table 1). IV. Although consumers remain worried about the current employment situation, the majority expects improvement in the future (Table 2). V. Sharp improvement is seen in the price situation in the country for the current period as well as a year ahead (Tables 3 and 4). VI. While respondents mostly reported unchanged incomes in the year gone by, more than 60 per cent expect their incomes to rise in the year ahead (Table 5). VII. Sentiments on spending remained almost unchanged from the previous round (Table 6, 7 and 8). | Table 1: Perceptions and Expectations on General Economic Situation | | (Percentage responses) | | Survey Round | Current Perception | One year ahead Expectation | | Improved | Remained Same | Worsened | Net Response | Will Improve | Will Remain Same | Will Worsen | Net Response | | Dec-17 | 38.5 | 24.0 | 37.5 | 1.0 | 55.6 | 21.8 | 22.6 | 33.0 | | Mar-18 | 34.9 | 23.4 | 41.7 | -6.8 | 49.7 | 22.8 | 27.5 | 22.2 | | May-18 | 32.5 | 19.6 | 47.9 | -15.4 | 50.6 | 22.1 | 27.4 | 23.2 | | Jun-18 | 36.4 | 21.9 | 41.8 | -5.4 | 50.4 | 23.0 | 26.6 | 23.8 | | Sep-18 | 33.7 | 22.1 | 44.3 | -10.6 | 53.2 | 16.7 | 30.2 | 23.0 | | Nov-18 | 33.2 | 21.6 | 45.2 | -12.0 | 53.6 | 15.3 | 31.2 | 22.4 | | Dec-18 | 36.7 | 20.2 | 43.1 | -6.4 | 59.9 | 15.8 | 24.3 | 35.6 |
| Table 2: Perceptions and Expectations on Employment | | (Percentage responses) | | Survey Round | Current Perception | One year ahead Expectation | | Improved | Remained Same | Worsened | Net Response | Will Improve | Will Remain Same | Will Worsen | Net Response | | Dec-17 | 31.6 | 27.4 | 41.0 | -9.4 | 54.4 | 24.7 | 20.9 | 33.6 | | Mar-18 | 31.2 | 26.0 | 42.8 | -11.6 | 50.8 | 24.3 | 24.9 | 26.0 | | May-18 | 32.1 | 24.0 | 43.9 | -11.8 | 51.0 | 24.4 | 24.6 | 26.5 | | Jun-18 | 34.7 | 26.4 | 38.9 | -4.1 | 50.9 | 25.8 | 23.4 | 27.5 | | Sep-18 | 35.2 | 19.3 | 45.5 | -10.3 | 54.1 | 17.0 | 29.0 | 25.1 | | Nov-18 | 33.9 | 18.9 | 47.2 | -13.3 | 53.5 | 16.1 | 30.4 | 23.1 | | Dec-18 | 35.6 | 20.1 | 44.3 | -8.7 | 60.3 | 17.1 | 22.7 | 37.6 |
| Table 3: Perceptions and Expectations on Price Level | | (Percentage responses) | | Survey Round | Current Perception | One year ahead Expectation | | Increased | Remained Same | Decreased | Net Response | Will Increase | Will Remain Same | Will Decrease | Net Response | | Dec-17 | 90.2 | 6.9 | 2.9 | -87.3 | 79.8 | 12.4 | 7.8 | -72.0 | | Mar-18 | 87.1 | 9.2 | 3.7 | -83.5 | 81.9 | 11.0 | 7.1 | -74.8 | | May-18 | 87.9 | 8.7 | 3.3 | -84.6 | 82.7 | 11.0 | 6.4 | -76.3 | | Jun-18 | 89.1 | 7.9 | 3.0 | -86.0 | 82.8 | 11.8 | 5.4 | -77.4 | | Sep-18 | 88.3 | 8.5 | 3.2 | -85.1 | 80.1 | 12.0 | 7.9 | -72.2 | | Nov-18 | 88.3 | 7.8 | 3.8 | -84.5 | 80.2 | 11.6 | 8.2 | -72.0 | | Dec-18 | 84.3 | 10.9 | 4.8 | -79.5 | 71.6 | 15.9 | 12.5 | -59.1 |
| Table 4: Perceptions and Expectations on Rate of Change in Price Level (Inflation)* | | (Percentage responses) | | Survey Round | Current Perception | One year ahead Expectation | | Increased | Remained Same | Decreased | Net Response | Will Increase | Will Remain Same | Will Decrease | Net Response | | Dec-17 | 80.9 | 12.7 | 6.4 | -74.5 | 77.9 | 16.2 | 5.9 | -72.0 | | Mar-18 | 81.0 | 12.4 | 6.6 | -74.4 | 81.5 | 12.5 | 6.1 | -75.4 | | May-18 | 80.4 | 12.7 | 6.9 | -73.5 | 79.2 | 15.4 | 5.5 | -73.7 | | Jun-18 | 81.8 | 10.5 | 7.7 | -74.2 | 79.4 | 13.7 | 6.9 | -72.5 | | Sep-18 | 80.8 | 13.2 | 6.1 | -74.7 | 79.8 | 14.2 | 6.1 | -73.7 | | Nov-18 | 80.0 | 13.9 | 6.1 | -73.9 | 75.9 | 18.0 | 6.1 | -69.8 | | Dec-18 | 77.9 | 15.2 | 6.9 | -71.0 | 76.3 | 17.3 | 6.4 | -69.9 | | *Applicable only for those respondents who felt price has increased/price will increase. |
| Table 5: Perceptions and Expectations on Income | | (Percentage responses) | | Survey Round | Current Perception | One year ahead Expectation | | Increased | Remained Same | Decreased | Net Response | Will Increase | Will Remain Same | Will Decrease | Net Response | | Dec-17 | 26.1 | 49.4 | 24.5 | 1.6 | 51.1 | 38.3 | 10.6 | 40.5 | | Mar-18 | 24.5 | 50.1 | 25.4 | -0.9 | 48.6 | 39.6 | 11.9 | 36.8 | | May-18 | 27.6 | 47.8 | 24.6 | 3.0 | 51.4 | 38.2 | 10.4 | 41.0 | | Jun-18 | 27.1 | 50.8 | 22.1 | 5.0 | 51.3 | 38.0 | 10.7 | 40.5 | | Sep-18 | 28.3 | 48.3 | 23.4 | 4.9 | 59.1 | 33.1 | 7.8 | 51.3 | | Nov-18 | 29.9 | 49.5 | 20.5 | 9.4 | 59.0 | 34.3 | 6.7 | 52.3 | | Dec-18 | 29.8 | 48.2 | 22.0 | 7.8 | 63.5 | 30.4 | 6.2 | 57.3 |
| Table 6: Perceptions and Expectations on Spending | | (Percentage responses) | | Survey Round | Current Perception | One year ahead Expectation | | Increased | Remained Same | Decreased | Net Response | Will Increase | Will Remain Same | Will Decrease | Net Response | | Dec-17 | 84.2 | 14.0 | 1.8 | 82.4 | 85.2 | 12.0 | 2.8 | 82.4 | | Mar-18 | 83.1 | 14.9 | 2.1 | 81.0 | 85.2 | 12.3 | 2.5 | 82.8 | | May-18 | 82.6 | 14.8 | 2.7 | 79.9 | 84.8 | 12.6 | 2.6 | 82.2 | | Jun-18 | 83.8 | 14.1 | 2.0 | 81.8 | 86.5 | 11.3 | 2.2 | 84.4 | | Sep-18 | 78.4 | 18.2 | 3.5 | 74.9 | 81.2 | 15.7 | 3.1 | 78.1 | | Nov-18 | 73.0 | 23.9 | 3.1 | 69.9 | 77.6 | 19.0 | 3.4 | 74.2 | | Dec-18 | 73.8 | 22.7 | 3.5 | 70.3 | 77.3 | 18.7 | 4.0 | 73.3 |
| Table 7: Perceptions and Expectations on Spending- Essential Items | | (Percentage responses) | | Survey Round | Current Perception | One year ahead Expectation | | Increased | Remained Same | Decreased | Net Response | Will Increase | Will Remain Same | Will Decrease | Net Response | | Dec-17 | 85.7 | 12.4 | 1.9 | 83.8 | 85.4 | 10.5 | 4.0 | 81.4 | | Mar-18 | 83.8 | 13.7 | 2.5 | 81.3 | 85.2 | 11.6 | 3.2 | 82.0 | | May-18 | 85.2 | 11.8 | 3.0 | 82.2 | 85.1 | 11.2 | 3.7 | 81.4 | | Jun-18 | 86.6 | 11.1 | 2.3 | 84.3 | 87.5 | 10.0 | 2.5 | 85.0 | | Sep-18 | 83.6 | 13.1 | 3.4 | 80.2 | 84.2 | 13.1 | 2.7 | 81.5 | | Nov-18 | 83.4 | 13.4 | 3.2 | 80.2 | 84.1 | 12.5 | 3.3 | 80.8 | | Dec-18 | 82.4 | 14.5 | 3.1 | 79.3 | 83.5 | 13.0 | 3.4 | 80.1 |
| Table 8: Perceptions and Expectations on Spending- Non-Essential Items | | (Percentage responses) | | Survey Round | Current Perception | One year ahead Expectation | | Increased | Remained Same | Decreased | Net Response | Will Increase | Will Remain Same | Will Decrease | Net Response | | Dec-17 | 53.1 | 34.6 | 12.3 | 40.8 | 59.4 | 31.4 | 9.2 | 50.1 | | Mar-18 | 56.0 | 31.4 | 12.6 | 43.4 | 62.8 | 28.0 | 9.2 | 53.7 | | May-18 | 52.3 | 32.5 | 15.1 | 37.2 | 58.7 | 31.0 | 10.3 | 48.4 | | Jun-18 | 55.4 | 32.9 | 11.7 | 43.8 | 62.7 | 28.0 | 9.3 | 53.4 | | Sep-18 | 44.0 | 34.3 | 21.7 | 22.3 | 49.2 | 33.3 | 17.5 | 31.7 | | Nov-18 | 39.1 | 37.6 | 23.3 | 15.8 | 44.5 | 35.9 | 19.6 | 24.9 | | Dec-18 | 38.4 | 37.5 | 24.1 | 14.3 | 46.1 | 33.0 | 20.9 | 25.2 |
|  IST,
IST,