भारतीय रिज़र्व बैंक ने आज औद्योगिक परिदृश्य सर्वेक्षण (आइओएस) के 95वें चक्र का परिणाम आज जारी किया। इस सर्वेक्षण में क्यू2: 2021-22 के लिए भारतीय विनिर्माण कंपनियों द्वारा किए जानेवाले कारोबार के परिवेश और क्यू3: 2021-221 के लिए उनकी प्रत्याशाओं का गुणात्मक मूल्यांकन किया गया है। जुलाई-सितंबर 2021 में संचालित सर्वेक्षण के इस चक्र में कुल 1414 कंपनियों ने प्रत्युत्तर दिए। कोविद 19 महामारी के कारण व्याप्त अनिश्चितता की स्थिति को देखते हुए प्रमुख मानदंडों के आधार पर आगे की दो तिमाहियों और उसके आगे की तीन तिमाहियों के आउटलुक का मूल्यांकन करने के लिए सर्वेक्षण के इस चक्र में एक अतिरिक्त ब्लॉक सम्मिलित किया गया है। विशेष: क. दूसरी तिमाही (Q2) 2021-22 का मूल्यांकन -
विनिर्माण कंपनियों ने महामारी की दूसरी लहर के कारण 2021-22 की पहली तिमाही (Q1) में उत्पादन, ऑर्डर बहियों और रोज़गार स्थितियों के संदर्भ में मांग की स्थितियों में संकुचन का सामना करने के बाद 2021-22 की दूसरी तिमाही में दुबारा तीव्र वृद्धि होने का मूल्यांकन किया है (सारणी-ए)। -
2021-22 की दूसरी तिमाही में क्षमता उपभोग में सुधार दिखा जो पहली तिमाही में गिरावट दर्शा रहा था। -
हाल ही में देखा गया है कि वित्त स्थितियों में दर्शनीय सुधार हुआ है और सभी तीन स्रोतों (अर्थात आंतरिक जमा, बैंकों और ओवरसीज) से वित्त की उपलब्धता को लेकर आशावादिता प्रबल हुई है। -
विनिर्माणकर्ताओं का मानना था कि कछे माल की लागत, वित्त की लागत और वेतन भुगतान व्यय से उन पर उच्च लागत का दबाव रहेगा। उनका यह भी मानना था कि बिक्री कीमतों में वृद्धि लाभ मार्जिन को पुनः हासिल करने में मददगार होगा। -
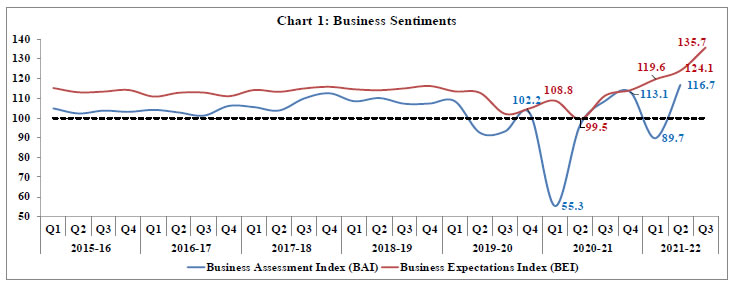
कारोबार मूल्यांकन सूचकांक (BAI)2 पिछली तिमाही के 89.7 से बढ़कर दूसरी तिमाही में 116.7 हो गया, जो भारतीय विनिर्माण क्षेत्र में समग्र कारोबारी भावनाओं में आए सुधार को प्रदर्शित करता है (चार्ट-1)। ख. तीसरी तिमाही (Q3) 2021-22 के लिए अपेक्षाएं -
2021-22 की तीसरी तिमाही के लिए उत्पादन मात्रा, नए ऑर्डस और रोज़गार लैंडस्केप में सुधार की उम्मीद ज़ाहिर की गई है। -
विनिर्माणकर्ताओं को अपनी क्षमता उपभोग और समग्र वित्त स्थिति में और भी सुधार होने की उम्मीद है । -
2021-22 की तीसरी तिमाही में कच्ची सामग्री की लागत के दबावों में प्रसार की गुंजाइश है; बिक्री मूल्यों और लाभ मार्जिन में वृद्धि हो सकती है। -
2021-22 की तीसरी तिमाही में व्यापार अपेक्षा सूचकांक (BEI) दूसरी तिमाही में रहे 124.1 से बढ़कर 135.7 हो गया (चार्ट-1)। ग. 2021-22 की चौथी तिमाही और 2022-23 की पहली तिमाही के लिए अपेक्षाएं -
2022-23 की पहली तिमाही में विनिर्माणकर्ताओं द्वारा उत्पादन मात्रा, ऑर्डर बहियों, क्षमता उपभोग, रोज़गार और समग्र कारोबार की स्थितियों में आगे और सुधार होने की संभावनाएं व्यक्त की गई हैं (सारणी-बी) । -
उत्तरदाताओं ने कच्ची सामग्री की लागत में वृद्धि की निरंतरता जताई है हालांकि ये हो सकता है कि इसमें मामूली कमी हो, और विक्री मूल्यों में वृद्धि की उम्मीद की है। | Table A: Summary of Net responses3 on Survey Parameters | | (per cent) | | Parameters | Assessment period | Expectation period | | Q1:2021-22 | Q2:2021-22 | Q1:2021-22 | Q3:2021-22 | | Production | -25.9 | 33.8 | 52.0 | 71.5 | | Order Books | -16.4 | 34.7 | 50.4 | 70.3 | | Pending Orders | 10.0 | -1.6 | -3.7 | -4.1 | | Capacity Utilisation | -26.1 | 28.8 | 45.4 | 65.2 | | Inventory of Raw Materials | -0.3 | -14.7 | -17.5 | -29.4 | | Inventory of Finished Goods | -4.2 | -14.9 | -19.4 | -30.7 | | Exports | -7.8 | 31.5 | 43.6 | 64.3 | | Imports | 1.7 | 30.2 | 42.8 | 60.4 | | Employment | -3.5 | 24.9 | 26.1 | 50.9 | | Financial Situation (Overall) | -12.7 | 32.8 | 48.2 | 68.6 | | Availability of Finance (from internal accruals) | -4.3 | 28.5 | 38.6 | 61.9 | | Availability of Finance (from banks & other sources) | -2.4 | 28.3 | 35.5 | 58.7 | | Availability of Finance (from overseas, if applicable) | 1.6 | 31.5 | 42.7 | 65.9 | | Cost of Finance | -4.5 | -28.6 | -31.5 | -55.8 | | Cost of Raw Material | -52.3 | -61.0 | -54.9 | -75.2 | | Salary/ Other Remuneration | -19.9 | -31.3 | -31.6 | -50.4 | | Selling Price | 19.6 | 38.2 | 28.2 | 57.4 | | Profit Margin | -32.2 | 9.4 | 32.7 | 51.7 | | Overall Business Situation | -20.6 | 34.0 | 52.4 | 70.3 | Note: Please see the excel file for time series data. | Table B: Business Expectations of Select Parameters for extended period – Net response | | (per cent) | | Parameters | Round 94 | Round 95 | | Q2:2021-22 | Q3:2021-22 | Q4:2021-22 | Q1:2022-23 | | Overall Business Situation | 52.4 | 70.3 | 78.4 | 76.9 | | Production | 52.0 | 71.5 | 77.4 | 75.4 | | Order Books | 50.4 | 70.3 | 76.9 | 75.9 | | Capacity Utilisation | 45.4 | 65.2 | 74.8 | 73.0 | | Employment | 26.1 | 50.9 | 65.8 | 54.7 | | Cost of Raw Materials | -54.9 | -75.2 | -74.2 | -70.3 | | Selling Prices | 28.2 | 57.4 | 69.3 | 56.4 |
| Table 1: Assessment and Expectations for Production | | (Percentage responses) | | Quarter | Total response | Assessment | Expectations | | Increase | Decrease | No change | Net response | Increase | Decrease | No change | Net response | | Q2:2020-21 | 959 | 42.4 | 32.1 | 25.5 | 10.3 | 41.4 | 30.2 | 28.5 | 11.2 | | Q3:2020-21 | 1,011 | 46.6 | 19.4 | 34.0 | 27.2 | 43.4 | 16.9 | 39.7 | 26.4 | | Q4:2020-21 | 967 | 48.9 | 12.6 | 38.5 | 36.3 | 43.7 | 12.2 | 44.0 | 31.5 | | Q1:2021-22 | 1,281 | 16.5 | 42.3 | 41.2 | -25.9 | 53.3 | 9.7 | 37.0 | 43.7 | | Q2:2021-22 | 1,414 | 44.5 | 10.7 | 44.8 | 33.8 | 58.8 | 6.8 | 34.3 | 52.0 | | Q3:2021-22 | | | | | | 75.3 | 3.8 | 20.9 | 71.5 | ‘Increase’ in production is optimistic.
Note: The sum of components may not add up to total due to rounding off (This is applicable for all tables). |
| Table 2: Assessment and Expectations for Order Books | | (Percentage responses) | | Quarter | Total response | Assessment | Expectations | | Increase | Decrease | No change | Net response | Increase | Decrease | No change | Net response | | Q2:2020-21 | 959 | 37.2 | 31.3 | 31.5 | 5.9 | 36.4 | 28.4 | 35.3 | 8.0 | | Q3:2020-21 | 1,011 | 40.3 | 19.8 | 40.0 | 20.5 | 39.2 | 18.6 | 42.2 | 20.6 | | Q4:2020-21 | 967 | 46.4 | 13.3 | 40.3 | 33.1 | 41.1 | 13.7 | 45.2 | 27.3 | | Q1:2021-22 | 1,281 | 20.0 | 36.5 | 43.5 | -16.4 | 51.0 | 7.8 | 41.1 | 43.2 | | Q2:2021-22 | 1,414 | 44.9 | 10.1 | 45.0 | 34.7 | 56.9 | 6.5 | 36.7 | 50.4 | | Q3:2021-22 | | | | | | 73.9 | 3.6 | 22.4 | 70.3 | | ‘Increase’ in order books is optimistic. |
| Table 3: Assessment and Expectations for Pending Orders | | (Percentage responses) | | Quarter | Total response | Assessment | Expectations | | Above Normal | Below Normal | Normal | Net response | Above Normal | Below Normal | Normal | Net response | | Q2:2020-21 | 959 | 7.2 | 30.1 | 62.7 | 22.8 | 5.8 | 31.8 | 62.4 | 26.0 | | Q3:2020-21 | 1,011 | 7.2 | 19.2 | 73.6 | 12.0 | 7.4 | 21.5 | 71.1 | 14.2 | | Q4:2020-21 | 967 | 13.2 | 10.2 | 76.6 | -3.0 | 5.6 | 14.8 | 79.7 | 9.2 | | Q1:2021-22 | 1,281 | 7.4 | 17.5 | 75.1 | 10.0 | 11.6 | 9.2 | 79.3 | -2.4 | | Q2:2021-22 | 1,414 | 9.6 | 8.1 | 82.3 | -1.6 | 10.8 | 7.2 | 82.0 | -3.7 | | Q3:2021-22 | | | | | | 8.8 | 4.8 | 86.4 | -4.1 | | Pending orders ‘Below Normal’ is optimistic. |
| Table 4: Assessment and Expectations for Capacity Utilisation (Main Product) | | (Percentage responses) | | Quarter | Total response | Assessment | Expectations | | Increase | Decrease | No change | Net response | Increase | Decrease | No change | Net response | | Q2:2020-21 | 959 | 31.8 | 30.2 | 37.9 | 1.6 | 36.2 | 28.6 | 35.2 | 7.6 | | Q3:2020-21 | 1,011 | 35.3 | 18.0 | 46.7 | 17.3 | 32.4 | 15.0 | 52.6 | 17.5 | | Q4:2020-21 | 967 | 40.6 | 11.5 | 47.9 | 29.1 | 34.7 | 10.6 | 54.7 | 24.1 | | Q1:2021-22 | 1,281 | 13.4 | 39.5 | 47.1 | -26.1 | 45.2 | 7.3 | 47.5 | 38.0 | | Q2:2021-22 | 1,414 | 39.2 | 10.4 | 50.4 | 28.8 | 51.6 | 6.2 | 42.2 | 45.4 | | Q3:2021-22 | | | | | | 68.3 | 3.1 | 28.5 | 65.2 | | ‘Increase’ in capacity utilisation is optimistic. |
| Table 5: Assessment and Expectations for Level of CU (compared to the average in last 4 quarters) | | (Percentage responses) | | Quarter | Total response | Assessment | Expectations | | Above Normal | Below Normal | Normal | Net response | Above Normal | Below Normal | Normal | Net response | | Q2:2020-21 | 959 | 5.9 | 43.4 | 50.8 | -37.5 | 5.8 | 39.2 | 55.0 | -33.5 | | Q3:2020-21 | 1,011 | 11.3 | 23.2 | 65.5 | -12.0 | 8.3 | 25.5 | 66.2 | -17.2 | | Q4:2020-21 | 967 | 21.3 | 12.2 | 66.5 | 9.1 | 11.7 | 15.3 | 73.0 | -3.6 | | Q1:2021-22 | 1,281 | 5.2 | 18.4 | 76.3 | -13.2 | 25.3 | 8.4 | 66.2 | 16.9 | | Q2:2021-22 | 1,414 | 15.4 | 7.7 | 76.9 | 7.8 | 15.6 | 7.9 | 76.5 | 7.7 | | Q3:2021-22 | | | | | | 30.4 | 3.7 | 65.9 | 26.7 | | ‘Above Normal’ in Level of capacity utilisation is optimistic. |
| Table 6: Assessment and Expectations for Assessment of Production Capacity (with regard to expected demand in next 6 months) | | (Percentage responses) | | Quarter | Total response | Assessment | Expectations | | More than adequate | Less than adequate | Adequate | Net response | More than adequate | Less than adequate | Adequate | Net response | | Q2:2020-21 | 959 | 15.9 | 17.2 | 66.9 | -1.3 | 18.7 | 17.3 | 64.0 | 1.3 | | Q3:2020-21 | 1,011 | 14.1 | 11.2 | 74.6 | 2.9 | 15.9 | 12.3 | 71.8 | 3.5 | | Q4:2020-21 | 967 | 15.5 | 10.0 | 74.5 | 5.5 | 14.2 | 9.3 | 76.5 | 5.0 | | Q1:2021-22 | 1,281 | 10.8 | 13.0 | 76.2 | -2.2 | 20.2 | 7.3 | 72.5 | 12.9 | | Q2:2021-22 | 1,414 | 17.3 | 7.6 | 75.1 | 9.7 | 28.4 | 5.8 | 65.8 | 22.6 | | Q3:2021-22 | | | | | | 31.0 | 4.0 | 65.1 | 27.0 | | ‘More than adequate’ in Assessment of Production Capacity is optimistic. |
| Table 7: Assessment and Expectations for Exports | | (Percentage responses) | | Quarter | Total response | Assessment | Expectations | | Increase | Decrease | No change | Net response | Increase | Decrease | No change | Net response | | Q2:2020-21 | 959 | 25.3 | 25.9 | 48.8 | -0.6 | 23.1 | 26.9 | 50.0 | -3.8 | | Q3:2020-21 | 1,011 | 22.5 | 17.9 | 59.5 | 4.6 | 25.1 | 17.6 | 57.3 | 7.5 | | Q4:2020-21 | 967 | 31.6 | 16.0 | 52.4 | 15.5 | 25.1 | 12.1 | 62.7 | 13.0 | | Q1:2021-22 | 1,281 | 18.3 | 26.1 | 55.6 | -7.8 | 38.7 | 9.0 | 52.3 | 29.6 | | Q2:2021-22 | 1,414 | 39.2 | 7.7 | 53.0 | 31.5 | 49.8 | 6.2 | 44.0 | 43.6 | | Q3:2021-22 | | | | | | 67.3 | 3.1 | 29.6 | 64.3 | | ‘Increase’ in exports is optimistic. |
| Table 8: Assessment and Expectations for Imports | | (Percentage responses) | | Quarter | Total response | Assessment | Expectations | | Increase | Decrease | No change | Net response | Increase | Decrease | No change | Net response | | Q2:2020-21 | 959 | 18.4 | 21.2 | 60.5 | -2.8 | 19.9 | 21.0 | 59.1 | -1.0 | | Q3:2020-21 | 1,011 | 19.6 | 13.3 | 67.2 | 6.3 | 17.3 | 12.4 | 70.4 | 4.9 | | Q4:2020-21 | 967 | 25.8 | 9.3 | 64.9 | 16.4 | 17.7 | 9.1 | 73.2 | 8.5 | | Q1:2021-22 | 1,281 | 18.9 | 17.1 | 64.0 | 1.7 | 32.6 | 6.6 | 60.8 | 26.1 | | Q2:2021-22 | 1,414 | 36.0 | 5.8 | 58.2 | 30.2 | 47.3 | 4.5 | 48.3 | 42.8 | | Q3:2021-22 | | | | | | 63.4 | 2.9 | 33.7 | 60.4 | | ‘Increase’ in imports is optimistic. |
| Table 9: Assessment and Expectations for level of Raw Materials Inventory | | (Percentage responses) | | Quarter | Total response | Assessment | Expectations | | Above average | Below average | Average | Net response | Above average | Below average | Average | Net response | | Q2:2020-21 | 959 | 16.7 | 10.9 | 72.3 | -5.8 | 15.5 | 9.7 | 74.8 | -5.9 | | Q3:2020-21 | 1,011 | 13.1 | 7.7 | 79.3 | -5.4 | 11.5 | 7.4 | 81.1 | -4.2 | | Q4:2020-21 | 967 | 17.5 | 6.5 | 76.0 | -11.1 | 12.0 | 5.3 | 82.8 | -6.7 | | Q1:2021-22 | 1,281 | 11.5 | 11.2 | 77.3 | -0.3 | 17.2 | 5.4 | 77.4 | -11.8 | | Q2:2021-22 | 1,414 | 20.2 | 5.5 | 74.4 | -14.7 | 23.7 | 6.2 | 70.0 | -17.5 | | Q3:2021-22 | | | | | | 33.7 | 4.4 | 61.9 | -29.4 | | ‘Below average’ Inventory of raw materials is optimistic. |
| Table 10: Assessment and Expectations for level of Finished Goods Inventory | | (Percentage responses) | | Quarter | Total response | Assessment | Expectations | | Above average | Below average | Average | Net response | Above average | Below average | Average | Net response | | Q2:2020-21 | 959 | 18.9 | 10.2 | 70.9 | -8.7 | 17.2 | 9.5 | 73.3 | -7.6 | | Q3:2020-21 | 1,011 | 12.8 | 8.1 | 79.1 | -4.6 | 12.4 | 7.2 | 80.4 | -5.3 | | Q4:2020-21 | 967 | 15.2 | 7.5 | 77.3 | -7.6 | 11.5 | 5.1 | 83.4 | -6.3 | | Q1:2021-22 | 1,281 | 14.4 | 10.2 | 75.4 | -4.2 | 16.4 | 5.5 | 78.1 | -10.9 | | Q2:2021-22 | 1,414 | 20.0 | 5.2 | 74.8 | -14.9 | 25.0 | 5.6 | 69.4 | -19.4 | | Q3:2021-22 | | | | | | 34.4 | 3.8 | 61.8 | -30.7 | | ‘Below average’ Inventory of finished goods is optimistic. |
| Table 11: Assessment and Expectations for Employment | | (Percentage responses) | | Quarter | Total response | Assessment | Expectations | | Increase | Decrease | No change | Net response | Increase | Decrease | No change | Net response | | Q2:2020-21 | 959 | 11.8 | 21.0 | 67.2 | -9.2 | 11.0 | 18.7 | 70.3 | -7.7 | | Q3:2020-21 | 1,011 | 15.5 | 11.6 | 73.0 | 3.9 | 14.5 | 12.1 | 73.3 | 2.4 | | Q4:2020-21 | 967 | 19.4 | 8.5 | 72.1 | 10.9 | 14.6 | 7.3 | 78.1 | 7.2 | | Q1:2021-22 | 1,281 | 9.1 | 12.7 | 78.2 | -3.5 | 23.5 | 5.5 | 71.0 | 17.9 | | Q2:2021-22 | 1,414 | 29.5 | 4.6 | 65.9 | 24.9 | 28.6 | 2.5 | 69.0 | 26.1 | | Q3:2021-22 | | | | | | 52.2 | 1.3 | 46.5 | 50.9 | | ‘Increase’ in employment is optimistic. |
| Table 12: Assessment and Expectations for Overall Financial Situation | | (Percentage responses) | | Quarter | Total response | Assessment | Expectations | | Better | Worsen | No change | Net response | Better | Worsen | No change | Net response | | Q2:2020-21 | 959 | 31.8 | 23.9 | 44.3 | 7.8 | 34.6 | 23.2 | 42.2 | 11.4 | | Q3:2020-21 | 1,011 | 40.4 | 12.9 | 46.7 | 27.5 | 36.7 | 11.4 | 51.9 | 25.3 | | Q4:2020-21 | 967 | 43.0 | 13.6 | 43.4 | 29.4 | 39.2 | 6.2 | 54.6 | 33.0 | | Q1:2021-22 | 1,281 | 17.8 | 30.6 | 51.6 | -12.7 | 53.4 | 6.1 | 40.5 | 47.3 | | Q2:2021-22 | 1,414 | 41.7 | 8.9 | 49.4 | 32.8 | 54.0 | 5.8 | 40.2 | 48.2 | | Q3:2021-22 | | | | | | 71.5 | 2.9 | 25.7 | 68.6 | | ‘Better’ overall financial situation is optimistic. |
| Table 13: Assessment and Expectations for Working Capital Finance Requirement | | (Percentage responses) | | Quarter | Total response | Assessment | Expectations | | Increase | Decrease | No change | Net response | Increase | Decrease | No change | Net response | | Q2:2020-21 | 959 | 33.3 | 11.4 | 55.3 | 21.9 | 37.2 | 11.5 | 51.3 | 25.7 | | Q3:2020-21 | 1,011 | 30.7 | 7.1 | 62.2 | 23.7 | 31.3 | 6.9 | 61.8 | 24.4 | | Q4:2020-21 | 967 | 30.8 | 7.7 | 61.4 | 23.1 | 28.5 | 3.7 | 67.8 | 24.8 | | Q1:2021-22 | 1,281 | 24.4 | 14.0 | 61.7 | 10.4 | 37.6 | 5.2 | 57.3 | 32.4 | | Q2:2021-22 | 1,414 | 39.6 | 4.7 | 55.7 | 34.9 | 44.7 | 3.0 | 52.2 | 41.7 | | Q3:2021-22 | | | | | | 63.3 | 2.2 | 34.4 | 61.1 | | ‘Increase’ in working capital finance is optimistic. |
| Table 14: Assessment and Expectations for Availability of Finance (from Internal Accruals) | | (Percentage responses) | | Quarter | Total response | Assessment | Expectations | | Improve | Worsen | No change | Net response | Improve | Worsen | No change | Net response | | Q2:2020-21 | 959 | 22.2 | 18.4 | 59.5 | 3.8 | 22.5 | 16.1 | 61.3 | 6.4 | | Q3:2020-21 | 1,011 | 27.2 | 9.7 | 63.1 | 17.4 | 24.8 | 9.7 | 65.5 | 15.1 | | Q4:2020-21 | 967 | 33.3 | 9.6 | 57.1 | 23.7 | 28.3 | 5.6 | 66.1 | 22.8 | | Q1:2021-22 | 1,281 | 13.3 | 17.6 | 69.1 | -4.3 | 39.7 | 5.1 | 55.2 | 34.7 | | Q2:2021-22 | 1,414 | 35.3 | 6.8 | 57.9 | 28.5 | 42.4 | 3.8 | 53.7 | 38.6 | | Q3:2021-22 | | | | | | 64.1 | 2.1 | 33.8 | 61.9 | | ‘Improvement’ in availability of finance is optimistic. |
| Table 15: Assessment and Expectations for Availability of Finance (from banks and other sources) | | (Percentage responses) | | Quarter | Total response | Assessment | Expectations | | Improve | Worsen | No change | Net response | Improve | Worsen | No change | Net response | | Q2:2020-21 | 959 | 20.3 | 8.3 | 71.4 | 12.0 | 20.4 | 9.8 | 69.8 | 10.6 | | Q3:2020-21 | 1,011 | 21.0 | 6.1 | 72.8 | 14.9 | 19.4 | 5.8 | 74.8 | 13.6 | | Q4:2020-21 | 967 | 23.1 | 6.6 | 70.3 | 16.5 | 19.6 | 4.3 | 76.1 | 15.3 | | Q1:2021-22 | 1,281 | 10.7 | 13.1 | 76.1 | -2.4 | 30.0 | 4.4 | 65.6 | 25.6 | | Q2:2021-22 | 1,414 | 33.2 | 4.9 | 61.8 | 28.3 | 38.4 | 2.9 | 58.8 | 35.5 | | Q3:2021-22 | | | | | | 60.6 | 1.9 | 37.5 | 58.7 | | ‘Improvement’ in availability of finance is optimistic. |
| Table 16: Assessment and Expectations for Availability of Finance (from overseas, if applicable) | | (Percentage responses) | | Quarter | Total response | Assessment | Expectations | | Improve | Worsen | No change | Net response | Improve | Worsen | No change | Net response | | Q2:2020-21 | 959 | 6.8 | 7.4 | 85.7 | -0.6 | 7.9 | 9.9 | 82.2 | -2.0 | | Q3:2020-21 | 1,011 | 5.8 | 5.0 | 89.2 | 0.8 | 7.2 | 6.6 | 86.1 | 0.6 | | Q4:2020-21 | 967 | 7.5 | 4.8 | 87.7 | 2.7 | 7.2 | 3.4 | 89.3 | 3.8 | | Q1:2021-22 | 1,281 | 13.6 | 12.0 | 74.5 | 1.6 | 16.5 | 3.1 | 80.3 | 13.4 | | Q2:2021-22 | 1,414 | 33.8 | 2.3 | 63.9 | 31.5 | 44.0 | 1.3 | 54.7 | 42.7 | | Q3:2021-22 | | | | | | 66.5 | 0.6 | 32.8 | 65.9 | | ‘Improvement’ in availability of finance is optimistic. |
| Table 17: Assessment and Expectations for Cost of Finance | | (Percentage responses) | | Quarter | Total response | Assessment | Expectations | | Increase | Decrease | No change | Net response | Increase | Decrease | No change | Net response | | Q2:2020-21 | 959 | 17.5 | 14.7 | 67.7 | -2.8 | 17.6 | 10.9 | 71.5 | -6.7 | | Q3:2020-21 | 1,011 | 13.3 | 13.5 | 73.2 | 0.2 | 15.5 | 8.8 | 75.7 | -6.7 | | Q4:2020-21 | 967 | 16.7 | 13.3 | 70.0 | -3.4 | 13.3 | 8.3 | 78.4 | -5.0 | | Q1:2021-22 | 1,281 | 15.7 | 11.3 | 73.0 | -4.5 | 22.2 | 8.2 | 69.6 | -13.9 | | Q2:2021-22 | 1,414 | 32.5 | 4.0 | 63.5 | -28.6 | 34.9 | 3.3 | 61.8 | -31.5 | | Q3:2021-22 | | | | | | 58.3 | 2.5 | 39.3 | -55.8 | | ‘Decrease’ in cost of finance is optimistic. |
| Table 18: Assessment and Expectations for Cost of Raw Materials | | (Percentage responses) | | Quarter | Total response | Assessment | Expectations | | Increase | Decrease | No change | Net response | Increase | Decrease | No change | Net response | | Q2:2020-21 | 959 | 46.1 | 8.2 | 45.7 | -38.0 | 37.8 | 5.7 | 56.5 | -32.0 | | Q3:2020-21 | 1,011 | 55.5 | 3.9 | 40.6 | -51.6 | 36.7 | 4.6 | 58.7 | -32.1 | | Q4:2020-21 | 967 | 71.0 | 2.0 | 26.9 | -69.0 | 45.2 | 2.6 | 52.2 | -42.7 | | Q1:2021-22 | 1,281 | 58.1 | 5.8 | 36.1 | -52.3 | 64.9 | 2.5 | 32.6 | -62.4 | | Q2:2021-22 | 1,414 | 62.5 | 1.4 | 36.1 | -61.0 | 56.8 | 2.0 | 41.2 | -54.9 | | Q3:2021-22 | | | | | | 76.6 | 1.4 | 22.1 | -75.2 | | ‘Decrease’ in cost of raw materials is optimistic. |
| Table 19: Assessment and Expectations for Salary/Other Remuneration | | (Percentage responses) | | Quarter | Total response | Assessment | Expectations | | Increase | Decrease | No change | Net response | Increase | Decrease | No change | Net response | | Q2:2020-21 | 959 | 15.7 | 12.9 | 71.4 | -2.8 | 16.5 | 12.5 | 70.9 | -4.0 | | Q3:2020-21 | 1,011 | 20.8 | 6.8 | 72.3 | -14.0 | 15.8 | 6.8 | 77.4 | -9.0 | | Q4:2020-21 | 967 | 21.8 | 3.1 | 75.1 | -18.7 | 19.9 | 3.9 | 76.2 | -16.0 | | Q1:2021-22 | 1,281 | 26.4 | 6.5 | 67.1 | -19.9 | 42.7 | 1.2 | 56.1 | -41.6 | | Q2:2021-22 | 1,414 | 33.1 | 1.8 | 65.2 | -31.3 | 32.5 | 0.9 | 66.6 | -31.6 | | Q3:2021-22 | | | | | | 51.2 | 0.9 | 47.9 | -50.4 | | ‘Decrease’ in Salary / other remuneration is optimistic. |
| Table 20: Assessment and Expectations for Selling Price | | (Percentage responses) | | Quarter | Total response | Assessment | Expectations | | Increase | Decrease | No change | Net response | Increase | Decrease | No change | Net response | | Q2:2020-21 | 959 | 13.9 | 19.7 | 66.4 | -5.8 | 12.9 | 18.9 | 68.1 | -6.0 | | Q3:2020-21 | 1,011 | 21.9 | 12.5 | 65.6 | 9.4 | 12.8 | 13.0 | 74.3 | -0.2 | | Q4:2020-21 | 967 | 31.3 | 8.6 | 60.1 | 22.7 | 19.6 | 8.9 | 71.5 | 10.7 | | Q1:2021-22 | 1,281 | 26.9 | 7.3 | 65.8 | 19.6 | 35.0 | 5.8 | 59.1 | 29.2 | | Q2:2021-22 | 1,414 | 42.0 | 3.9 | 54.1 | 38.2 | 31.1 | 2.9 | 66.0 | 28.2 | | Q3:2021-22 | | | | | | 59.7 | 2.3 | 38.0 | 57.4 | | ‘Increase’ in selling price is optimistic. |
| Table 21: Assessment and Expectations for Profit Margin | | (Percentage responses) | | Quarter | Total response | Assessment | Expectations | | Increase | Decrease | No change | Net response | Increase | Decrease | No change | Net response | | Q2:2020-21 | 959 | 15.3 | 41.8 | 43.0 | -26.5 | 13.7 | 40.5 | 45.8 | -26.8 | | Q3:2020-21 | 1,011 | 17.4 | 29.1 | 53.5 | -11.8 | 14.7 | 26.7 | 58.6 | -12.0 | | Q4:2020-21 | 967 | 24.9 | 22.9 | 52.1 | 2.0 | 17.8 | 20.1 | 62.1 | -2.4 | | Q1:2021-22 | 1,281 | 11.8 | 44.0 | 44.2 | -32.2 | 28.8 | 17.8 | 53.4 | 11.0 | | Q2:2021-22 | 1,414 | 30.0 | 20.6 | 49.5 | 9.4 | 43.7 | 11.0 | 45.3 | 32.7 | | Q3:2021-22 | | | | | | 59.9 | 8.2 | 31.9 | 51.7 | | ‘Increase’ in profit margin is optimistic. |
| Table 22: Assessment and Expectations for Overall Business Situation | | (Percentage responses) | | Quarter | Total response | Assessment | Expectations | | Better | Worsen | No change | Net response | Better | Worsen | No change | Net response | | Q2:2020-21 | 959 | 39.6 | 27.9 | 32.5 | 11.8 | 41.0 | 25.3 | 33.6 | 15.7 | | Q3:2020-21 | 1,011 | 46.7 | 13.8 | 39.6 | 32.9 | 45.7 | 12.8 | 41.6 | 32.9 | | Q4:2020-21 | 967 | 49.0 | 12.4 | 38.6 | 36.5 | 48.2 | 7.6 | 44.2 | 40.7 | | Q1:2021-22 | 1,281 | 18.6 | 39.2 | 42.3 | -20.6 | 57.7 | 5.1 | 37.2 | 52.5 | | Q2:2021-22 | 1,414 | 43.5 | 9.5 | 47.0 | 34.0 | 59.9 | 7.5 | 32.5 | 52.4 | | Q3:2021-22 | | | | | | 73.1 | 2.8 | 24.1 | 70.3 | | ‘Better’ Overall Business Situation is optimistic. |
| Table 23: Business Sentiments | | Quarter | Business Assessment Index (BAI) | Business Expectations Index (BEI) | | Q2:2020-21 | 96.2 | 99.5 | | Q3:2020-21 | 108.6 | 111.4 | | Q4:2020-21 | 113.1 | 114.1 | | Q1:2021-22 | 89.7 | 119.6 | | Q2:2021-22 | 116.7 | 124.1 | | Q3:2021-22 | | 135.7 |
|
 IST,
IST,