|
भारतीय रिज़र्व बैंक ने आज त्रैमासिक औद्योगिक परिदृश्य सर्वेक्षण (आइओएस) के 104वें दौर के परिणाम जारी किये। इस सर्वेक्षण में वर्ष 2023-24 की तीसरी तिमाही के लिए भारतीय विनिर्माण कंपनियों द्वारा कारोबार के परिवेश का गुणात्मक मूल्यांकन और वर्ष 2023-241 की चौथी तिमाही के लिए उक्त कंपनियों की प्रत्याशाओं के साथ-साथ आगामी दो तिमाहियों के लिए चयनित मापदंडों पर उनके आउटलुक को समाहित किया गया है। वर्ष 2023-24 की तीसरी तिमाही के दौरान सर्वेक्षण के इस दौर में कुल 1,040 कंपनियों ने प्रत्युत्तर दिए ।
विशेष:
क. तीसरी तिमाही (Q3) 2023-24 का मूल्यांकन
- विनिर्माण कंपनियों ने 2023-24 की तीसरी तिमाही के दौरान सकारात्मक मांग की स्थिति की सूचना दी, जैसा कि उनके उत्पादन, क्षमता उपयोग, लंबित ऑर्डर, रोजगार और समग्र व्यावसायिक स्थिति के आकलन में परिलक्षित होता है; हालाँकि, पिछले सर्वेक्षण दौर की तुलना में वे कम आशावादी थे (सारणी - ए) ।
- अनुमान है कि कच्चे माल की लागत, वित्तपोषण लागत और वेतन खर्च का दबाव थोड़ा कम हुआ है।
- अनुमान है कि तिमाही के दौरान बिक्री मूल्य और लाभ मार्जिन में बढ़ोतरी हुई है, हालांकि पिछली तिमाही के आकलन की तुलना में मनोभाव कुछ हद तक कम थे।
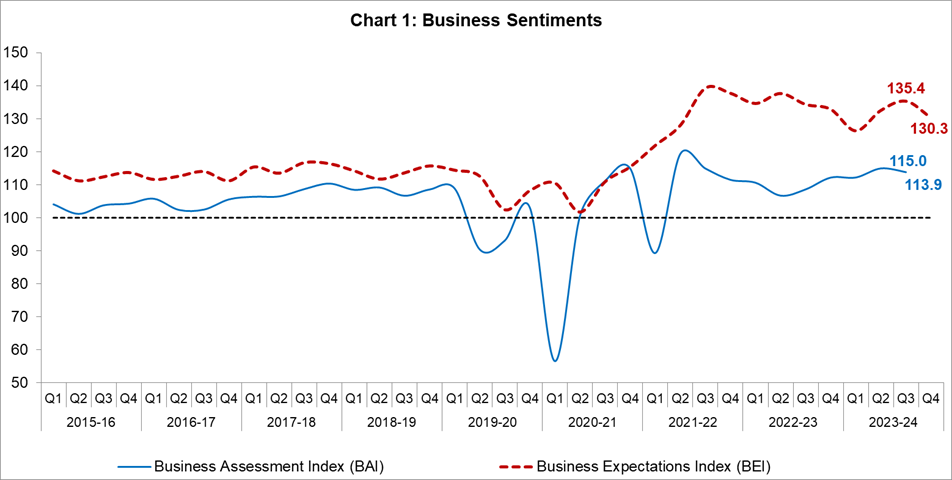
- विनिर्माण क्षेत्र में व्यापार मूल्यांकन सूचकांक (बीएआई) 2023-24 की तीसरी तिमाही में घटकर 113.9 हो गया, जो की पिछली तिमाही में 115.0 था (चार्ट 1)।
ख. चौथी तिमाही (Q4) 2023-24 के लिए प्रत्याशाएं
- विनिर्माता 2023-24 की चौथी तिमाही के दौरान मांग की स्थिति को लेकर आशावादी रहे, हालांकि पिछले सर्वेक्षण दौर की तुलना में संभावनाओं का स्तर अपेक्षाकृत कम था (सारणी - ए)।
- इनपुट लागत बढ़ने की संभावना है, हालांकि दबाव का स्तर कम होने की संभावना है।
- सकारात्मक मांग संभावनाओं के अनुरूप, बिक्री मूल्य और लाभ मार्जिन बढ़ने की उम्मीद है।
- व्यापार अपेक्षा सूचकांक (बीईआई) 2023-24 की चौथी तिमाही में 130.3 के उच्च स्तर पर रहा, हालांकि यह पिछली तिमाही के 135.4 के स्तर से कम हुआ (चार्ट 1)।
ग. 2024-25 की पहली और 2024-25 की दूसरी तिमाही के लिए प्रत्याशाएं
- विनिर्माण कंपनियां उत्पादन, क्षमता उपयोग, ऑर्डर बुक, रोजगार की स्थिति और समग्र व्यावसायिक स्थिति पर अत्यधिक आशावादी बनी हुई हैं (सारणी बी) ।
- 2024-25 की पहली अर्धवार्षिक अवधि के दौरान इनपुट लागत का दबाव बने रहने की संभावना है और बिक्री कीमतें भी उसी के अनुरूप रहने की उम्मीद है।
Table A: Summary of Net responses[2] on Survey Parameters
(per cent)
|
Parameters
|
Assessment period
|
Expectation period
|
|
Q2:2023-24
|
Q3:2023-24
|
Q3:2023-24
|
Q4:2023-24
|
|
Production
|
34.0
|
29.0
|
65.1
|
58.1
|
|
Order Books
|
30.7
|
26.3
|
62.3
|
55.8
|
|
Pending Orders
|
3.1
|
3.3
|
-1.1
|
1.1
|
|
Capacity Utilisation
|
29.5
|
19.6
|
57.5
|
46.7
|
|
Inventory of Raw Materials
|
-6.1
|
-8.9
|
-27.3
|
-25.7
|
|
Inventory of Finished Goods
|
-7.2
|
-9.5
|
-28.2
|
-25.3
|
|
Exports
|
17.7
|
11.6
|
53.1
|
43.6
|
|
Imports
|
17.2
|
14.5
|
51.0
|
41.0
|
|
Employment
|
18.0
|
18.2
|
38.8
|
39.5
|
|
Financial Situation (Overall)
|
30.9
|
25.6
|
63.5
|
54.2
|
|
Availability of Finance (from internal accruals)
|
30.8
|
23.7
|
59.1
|
47.4
|
|
Availability of Finance (from banks & other sources)
|
29.1
|
23.2
|
55.8
|
44.5
|
|
Availability of Finance (from overseas, if applicable)
|
18.6
|
14.2
|
53.5
|
43.9
|
|
Cost of Finance
|
-26.4
|
-22.5
|
-54.9
|
-45.9
|
|
Cost of Raw Material
|
-43.8
|
-33.4
|
-65.0
|
-54.2
|
|
Salary/ Other Remuneration
|
-28.8
|
-26.2
|
-45.6
|
-42.0
|
|
Selling Price
|
11.7
|
10.2
|
40.1
|
34.8
|
|
Profit Margin
|
4.5
|
1.4
|
35.8
|
30.8
|
|
Overall Business Situation
|
34.3
|
28.6
|
67.9
|
58.3
|
Table B: Business Expectations on Select Parameters for extended period – Net response
(per cent)
|
Parameters
|
Round 103
|
Round 104
|
|
Q3:2023-24
|
Q4:2023-24
|
Q1:2024:25
|
Q2:2024:25
|
|
Overall Business Situation
|
67.9
|
58.3
|
58.6
|
62.9
|
|
Production
|
65.1
|
58.1
|
57.0
|
59.7
|
|
Order Books
|
62.3
|
55.8
|
58.7
|
61.5
|
|
Capacity Utilisation
|
57.5
|
46.7
|
53.6
|
56.3
|
|
Employment
|
38.8
|
39.5
|
44.8
|
43.0
|
|
Cost of Raw Materials
|
-65.0
|
-54.2
|
-53.2
|
-54.0
|
|
Selling Prices
|
40.1
|
34.8
|
41.5
|
42.1
|
Note: Please see the excel file for time series data
|
Table 1: Assessment and Expectations for Production
(Percentage responses)
|
|
Quarter
|
Total response
|
Assessment
|
Expectations
|
|
Increase
|
Decrease
|
No change
|
Net response
|
Increase
|
Decrease
|
No change
|
Net response
|
|
Q3:2022-23
|
1,356
|
40.5
|
15.4
|
44.1
|
25.1
|
60.8
|
4.6
|
34.5
|
56.2
|
|
Q4:2022-23
|
1,066
|
46.3
|
13.3
|
40.4
|
33.0
|
61.2
|
3.8
|
34.9
|
57.4
|
|
Q1:2023-24
|
1,247
|
39.6
|
14.3
|
46.0
|
25.3
|
60.6
|
5.8
|
33.6
|
54.8
|
|
Q2:2023-24
|
1,223
|
45.2
|
11.2
|
43.6
|
34.0
|
63.0
|
5.0
|
31.9
|
58.0
|
|
Q3:2023-24
|
1,040
|
41.2
|
12.2
|
46.7
|
29.0
|
70.9
|
5.7
|
23.4
|
65.1
|
|
Q4:2023-24
|
|
|
|
|
|
62.3
|
4.2
|
33.6
|
58.1
|
|
‘Increase’ in production is optimistic.
Note: The sum of components may not add up to total due to rounding off (This is applicable for all tables).
|
|
Table 2: Assessment and Expectations for Order Books
(Percentage responses)
|
|
Quarter
|
Total response
|
Assessment
|
Expectations
|
|
Increase
|
Decrease
|
No change
|
Net response
|
Increase
|
Decrease
|
No change
|
Net response
|
|
Q3:2022-23
|
1,356
|
33.1
|
12.1
|
54.8
|
21.0
|
67.1
|
4.7
|
28.3
|
62.4
|
|
Q4:2022-23
|
1,066
|
37.2
|
11.8
|
51.0
|
25.4
|
63.3
|
3.9
|
32.8
|
59.4
|
|
Q1:2023-24
|
1,247
|
33.0
|
11.1
|
55.9
|
21.9
|
54.6
|
6.8
|
38.6
|
47.8
|
|
Q2:2023-24
|
1,223
|
41.1
|
10.4
|
48.5
|
30.7
|
63.0
|
4.8
|
32.2
|
58.1
|
|
Q3:2023-24
|
1,040
|
38.3
|
12.0
|
49.7
|
26.3
|
68.5
|
6.1
|
25.4
|
62.3
|
|
Q4:2023-24
|
|
|
|
|
|
61.8
|
6.0
|
32.1
|
55.8
|
|
‘Increase’ in order books is optimistic.
|
|
Table 3: Assessment and Expectations for Pending Orders
(Percentage responses)
|
|
Quarter
|
Total response
|
Assessment
|
Expectations
|
|
Above Normal
|
Below Normal
|
Normal
|
Net response
|
Above Normal
|
Below Normal
|
Normal
|
Net
response
|
|
Q3:2022-23
|
1,356
|
8.4
|
14.6
|
76.9
|
6.2
|
10.8
|
10.1
|
79.2
|
-0.7
|
|
Q4:2022-23
|
1,066
|
4.2
|
13.1
|
82.7
|
8.9
|
8.9
|
10.1
|
81.0
|
1.2
|
|
Q1:2023-24
|
1,247
|
9.2
|
14.1
|
76.6
|
4.9
|
4.5
|
8.0
|
87.5
|
3.4
|
|
Q2:2023-24
|
1,223
|
8.6
|
11.6
|
79.8
|
3.1
|
10.9
|
9.2
|
79.9
|
-1.7
|
|
Q3:2023-24
|
1,040
|
8.6
|
11.9
|
79.4
|
3.3
|
9.7
|
8.5
|
81.8
|
-1.1
|
|
Q4:2023-24
|
|
|
|
|
|
8.2
|
9.3
|
82.5
|
1.1
|
|
Pending orders ‘Below Normal’ is optimistic.
|
|
Table 4: Assessment and Expectations for Capacity Utilisation (Main Product)
(Percentage responses)
|
|
Quarter
|
Total response
|
Assessment
|
Expectations
|
|
Increase
|
Decrease
|
No change
|
Net response
|
Increase
|
Decrease
|
No change
|
Net
response
|
|
Q3:2022-23
|
1,356
|
29.8
|
15.0
|
55.2
|
14.9
|
51.5
|
4.9
|
43.6
|
46.6
|
|
Q4:2022-23
|
1,066
|
34.3
|
11.5
|
54.1
|
22.8
|
51.3
|
4.1
|
44.6
|
47.2
|
|
Q1:2023-24
|
1,247
|
28.5
|
13.0
|
58.5
|
15.5
|
46.7
|
5.5
|
47.8
|
41.2
|
|
Q2:2023-24
|
1,223
|
38.2
|
8.7
|
53.0
|
29.5
|
51.8
|
5.2
|
42.9
|
46.6
|
|
Q3:2023-24
|
1,040
|
30.1
|
10.6
|
59.3
|
19.6
|
62.1
|
4.6
|
33.3
|
57.5
|
|
Q4:2023-24
|
|
|
|
|
|
51.2
|
4.6
|
44.2
|
46.7
|
|
‘Increase’ in capacity utilisation is optimistic.
|
|
Table 5: Assessment and Expectations for Level of CU
(compared to the average in last 4 quarters)
(Percentage responses)
|
|
Quarter
|
Total response
|
Assessment
|
Expectations
|
|
Above Normal
|
Below Normal
|
Normal
|
Net response
|
Above Normal
|
Below Normal
|
Normal
|
Net response
|
|
Q3:2022-23
|
1,356
|
28.7
|
13.2
|
58.1
|
15.5
|
37.0
|
6.1
|
56.9
|
30.9
|
|
Q4:2022-23
|
1,066
|
19.8
|
10.5
|
69.7
|
9.3
|
34.7
|
8.1
|
57.2
|
26.7
|
|
Q1:2023-24
|
1,247
|
31.4
|
10.4
|
58.2
|
21.0
|
23.7
|
6.2
|
70.2
|
17.5
|
|
Q2:2023-24
|
1,223
|
30.5
|
9.0
|
60.6
|
21.5
|
39.0
|
6.0
|
55.1
|
33.0
|
|
Q3:2023-24
|
1,040
|
26.2
|
9.4
|
64.4
|
16.7
|
36.1
|
6.1
|
57.8
|
30.1
|
|
Q4:2023-24
|
|
|
|
|
|
33.3
|
5.7
|
61.1
|
27.6
|
|
‘Above Normal’ in Level of capacity utilisation is optimistic.
|
|
Table 6: Assessment and Expectations for Production Capacity
(with regard to expected demand in next 6 months)
(Percentage responses)
|
|
Quarter
|
Total response
|
Assessment
|
Expectations
|
|
More than adequate
|
Less than adequate
|
Adequate
|
Net response
|
More than adequate
|
Less than adequate
|
Adequate
|
Net response
|
|
Q3:2022-23
|
1,356
|
28.9
|
4.4
|
66.7
|
24.6
|
42.9
|
4.5
|
52.7
|
38.4
|
|
Q4:2022-23
|
1,066
|
17.3
|
5.7
|
77.0
|
11.6
|
42.7
|
3.3
|
53.9
|
39.4
|
|
Q1:2023-24
|
1,247
|
25.8
|
5.7
|
68.4
|
20.1
|
25.3
|
3.8
|
70.9
|
21.5
|
|
Q2:2023-24
|
1,223
|
23.3
|
4.0
|
72.7
|
19.3
|
43.4
|
3.9
|
52.7
|
39.5
|
|
Q3:2023-24
|
1,040
|
25.1
|
4.7
|
70.2
|
20.4
|
42.7
|
3.2
|
54.1
|
39.5
|
|
Q4:2023-24
|
|
|
|
|
|
38.5
|
3.6
|
57.9
|
34.9
|
|
‘More than adequate’ in Assessment of Production Capacity is optimistic.
|
|
Table 7: Assessment and Expectations for Exports
(Percentage responses)
|
|
Quarter
|
Total response
|
Assessment
|
Expectations
|
|
Increase
|
Decrease
|
No change
|
Net response
|
Increase
|
Decrease
|
No change
|
Net response
|
|
Q3:2022-23
|
1,356
|
25.6
|
17.1
|
57.3
|
8.5
|
61.2
|
5.2
|
33.6
|
56.0
|
|
Q4:2022-23
|
1,066
|
25.4
|
13.3
|
61.3
|
12.2
|
55.5
|
3.9
|
40.6
|
51.5
|
|
Q1:2023-24
|
1,247
|
30.1
|
12.5
|
57.4
|
17.6
|
43.0
|
6.8
|
50.2
|
36.2
|
|
Q2:2023-24
|
1,223
|
27.7
|
10.0
|
62.3
|
17.7
|
57.9
|
4.4
|
37.7
|
53.5
|
|
Q3:2023-24
|
1,040
|
25.1
|
13.5
|
61.3
|
11.6
|
58.1
|
5.0
|
36.9
|
53.1
|
|
Q4:2023-24
|
|
|
|
|
|
50.3
|
6.7
|
43.0
|
43.6
|
|
‘Increase’ in exports is optimistic.
|
|
Table 8: Assessment and Expectations for Imports
(Percentage responses)
|
|
Quarter
|
Total response
|
Assessment
|
Expectations
|
|
Increase
|
Decrease
|
No change
|
Net response
|
Increase
|
Decrease
|
No change
|
Net response
|
|
Q3:2022-23
|
1,356
|
23.8
|
12.2
|
64.0
|
11.6
|
60.8
|
3.2
|
36.0
|
57.6
|
|
Q4:2022-23
|
1,066
|
22.6
|
7.3
|
70.1
|
15.3
|
54.3
|
2.8
|
42.9
|
51.5
|
|
Q1:2023-24
|
1,247
|
28.9
|
8.6
|
62.5
|
20.4
|
37.4
|
4.2
|
58.4
|
33.2
|
|
Q2:2023-24
|
1,223
|
25.5
|
8.2
|
66.3
|
17.2
|
55.8
|
3.2
|
41.0
|
52.6
|
|
Q3:2023-24
|
1,040
|
23.2
|
8.7
|
68.0
|
14.5
|
54.8
|
3.9
|
41.3
|
51.0
|
|
Q4:2023-24
|
|
|
|
|
|
45.2
|
4.2
|
50.6
|
41.0
|
|
‘Increase’ in imports is optimistic.
|
|
Table 9: Assessment and Expectations for level of Raw Materials Inventory
(Percentage responses)
|
|
Quarter
|
Total response
|
Assessment
|
Expectations
|
|
Above average
|
Below average
|
Average
|
Net response
|
Above average
|
Below average
|
Average
|
Net response
|
|
Q3:2022-23
|
1,356
|
18.1
|
7.3
|
74.6
|
-10.8
|
32.8
|
7.1
|
60.1
|
-25.7
|
|
Q4:2022-23
|
1,066
|
13.1
|
4.7
|
82.2
|
-8.3
|
32.4
|
5.6
|
62.0
|
-26.8
|
|
Q1:2023-24
|
1,247
|
13.4
|
7.1
|
79.5
|
-6.3
|
20.5
|
2.5
|
76.9
|
-18.0
|
|
Q2:2023-24
|
1,223
|
11.5
|
5.3
|
83.2
|
-6.1
|
33.0
|
4.0
|
63.1
|
-29.0
|
|
Q3:2023-24
|
1,040
|
12.9
|
4.1
|
83.0
|
-8.9
|
30.9
|
3.6
|
65.6
|
-27.3
|
|
Q4:2023-24
|
|
|
|
|
|
27.4
|
1.7
|
70.9
|
-25.7
|
|
‘Below average’ Inventory of raw materials is optimistic.
|
|
Table 10: Assessment and Expectations for level of Finished Goods Inventory
(Percentage responses)
|
|
Quarter
|
Total response
|
Assessment
|
Expectations
|
|
Above average
|
Below average
|
Average
|
Net response
|
Above average
|
Below average
|
Average
|
Net response
|
|
Q3:2022-23
|
1,356
|
17.1
|
7.7
|
75.2
|
-9.5
|
33.4
|
6.9
|
59.7
|
-26.5
|
|
Q4:2022-23
|
1,066
|
13.3
|
5.1
|
81.5
|
-8.2
|
31.9
|
5.8
|
62.3
|
-26.1
|
|
Q1:2023-24
|
1,247
|
14.0
|
6.8
|
79.2
|
-7.2
|
19.9
|
2.8
|
77.3
|
-17.2
|
|
Q2:2023-24
|
1,223
|
11.7
|
4.5
|
83.7
|
-7.2
|
33.2
|
4.4
|
62.4
|
-28.8
|
|
Q3:2023-24
|
1,040
|
14.0
|
4.5
|
81.5
|
-9.5
|
31.4
|
3.3
|
65.3
|
-28.2
|
|
Q4:2023-24
|
|
|
|
|
|
27.3
|
2.0
|
70.7
|
-25.3
|
|
‘Below average’ Inventory of finished goods is optimistic.
|
|
Table 11: Assessment and Expectations for Employment
(Percentage responses)
|
|
Quarter
|
Total response
|
Assessment
|
Expectations
|
|
Increase
|
Decrease
|
No change
|
Net response
|
Increase
|
Decrease
|
No change
|
Net response
|
|
Q3:2022-23
|
1,356
|
23.0
|
9.4
|
67.7
|
13.6
|
45.0
|
1.2
|
53.9
|
43.8
|
|
Q4:2022-23
|
1,066
|
19.3
|
7.0
|
73.7
|
12.4
|
39.0
|
2.5
|
58.5
|
36.4
|
|
Q1:2023-24
|
1,247
|
25.9
|
9.9
|
64.2
|
16.1
|
29.8
|
3.1
|
67.1
|
26.7
|
|
Q2:2023-24
|
1,223
|
25.1
|
7.1
|
67.7
|
18.0
|
43.5
|
3.0
|
53.5
|
40.5
|
|
Q3:2023-24
|
1,040
|
25.1
|
6.9
|
67.9
|
18.2
|
42.5
|
3.7
|
53.8
|
38.8
|
|
Q4:2023-24
|
|
|
|
|
|
41.7
|
2.2
|
56.1
|
39.5
|
|
‘Increase’ in employment is optimistic.
|
|
Table 12: Assessment and Expectations for Overall Financial Situation
(Percentage responses)
|
|
Quarter
|
Total response
|
Assessment
|
Expectations
|
|
Better
|
Worsen
|
No change
|
Net response
|
Better
|
Worsen
|
No change
|
Net response
|
|
Q3:2022-23
|
1,356
|
35.6
|
15.5
|
49.0
|
20.1
|
61.4
|
3.8
|
34.8
|
57.7
|
|
Q4:2022-23
|
1,066
|
40.2
|
9.6
|
50.2
|
30.6
|
63.9
|
3.3
|
32.8
|
60.6
|
|
Q1:2023-24
|
1,247
|
36.6
|
12.6
|
50.7
|
24.0
|
56.3
|
3.4
|
40.3
|
52.9
|
|
Q2:2023-24
|
1,223
|
41.6
|
10.7
|
47.7
|
30.9
|
60.2
|
3.9
|
35.9
|
56.3
|
|
Q3:2023-24
|
1,040
|
36.8
|
11.2
|
52.0
|
25.6
|
68.7
|
5.1
|
26.2
|
63.5
|
|
Q4:2023-24
|
|
|
|
|
|
58.2
|
4.0
|
37.8
|
54.2
|
|
‘Better’ overall financial situation is optimistic.
|
|
Table 13: Assessment and Expectations for Working Capital Finance Requirement
(Percentage responses)
|
|
Quarter
|
Total response
|
Assessment
|
Expectations
|
|
Increase
|
Decrease
|
No change
|
Net response
|
Increase
|
Decrease
|
No change
|
Net response
|
|
Q3:2022-23
|
1,356
|
35.2
|
7.3
|
57.5
|
27.9
|
51.2
|
1.6
|
47.3
|
49.6
|
|
Q4:2022-23
|
1,066
|
36.4
|
4.3
|
59.3
|
32.1
|
52.3
|
1.1
|
46.5
|
51.2
|
|
Q1:2023-24
|
1,247
|
34.8
|
5.8
|
59.4
|
29.1
|
48.0
|
1.9
|
50.0
|
46.1
|
|
Q2:2023-24
|
1,223
|
38.4
|
5.1
|
56.6
|
33.3
|
53.3
|
2.2
|
44.4
|
51.1
|
|
Q3:2023-24
|
1,040
|
32.8
|
6.9
|
60.3
|
26.0
|
60.2
|
2.6
|
37.3
|
57.6
|
|
Q4:2023-24
|
|
|
|
|
|
49.6
|
2.9
|
47.6
|
46.7
|
|
‘Increase’ in working capital finance is optimistic.
|
|
Table 14: Assessment and Expectations for Availability of Finance (from Internal Accruals)
(Percentage responses)
|
|
Quarter
|
Total response
|
Assessment
|
Expectations
|
|
Improve
|
Worsen
|
No change
|
Net response
|
Improve
|
Worsen
|
No change
|
Net response
|
|
Q3:2022-23
|
1,356
|
31.1
|
9.1
|
59.8
|
21.9
|
51.3
|
2.0
|
46.7
|
49.3
|
|
Q4:2022-23
|
1,066
|
33.3
|
4.5
|
62.2
|
28.8
|
55.2
|
1.7
|
43.1
|
53.5
|
|
Q1:2023-24
|
1,247
|
33.2
|
7.4
|
59.4
|
25.8
|
48.7
|
2.0
|
49.3
|
46.6
|
|
Q2:2023-24
|
1,223
|
37.1
|
6.3
|
56.6
|
30.8
|
54.4
|
2.1
|
43.5
|
52.3
|
|
Q3:2023-24
|
1,040
|
30.6
|
6.9
|
62.5
|
23.7
|
61.6
|
2.5
|
35.9
|
59.1
|
|
Q4:2023-24
|
|
|
|
|
|
49.3
|
2.0
|
48.7
|
47.4
|
|
‘Improvement’ in availability of finance is optimistic.
|
|
Table 15: Assessment and Expectations for Availability of Finance (from banks and other sources)
(Percentage responses)
|
|
Quarter
|
Total response
|
Assessment
|
Expectations
|
|
Improve
|
Worsen
|
No change
|
Net response
|
Improve
|
Worsen
|
No change
|
Net response
|
|
Q3:2022-23
|
1,356
|
26.0
|
9.1
|
64.9
|
17.0
|
56.7
|
1.7
|
41.6
|
55.1
|
|
Q4:2022-23
|
1,066
|
27.8
|
4.5
|
67.7
|
23.3
|
50.5
|
1.3
|
48.2
|
49.2
|
|
Q1:2023-24
|
1,247
|
26.5
|
6.1
|
67.4
|
20.4
|
42.2
|
2.1
|
55.7
|
40.1
|
|
Q2:2023-24
|
1,223
|
34.9
|
5.7
|
59.4
|
29.1
|
50.5
|
1.5
|
47.9
|
49.0
|
|
Q3:2023-24
|
1,040
|
28.8
|
5.6
|
65.5
|
23.2
|
58.2
|
2.5
|
39.3
|
55.8
|
|
Q4:2023-24
|
|
|
|
|
|
46.5
|
2.1
|
51.4
|
44.5
|
|
‘Improvement’ in availability of finance is optimistic.
|
|
Table 16: Assessment and Expectations for Availability of Finance (from overseas, if applicable)
(per cent)
|
|
Quarter
|
Total response
|
Assessment
|
Expectations
|
|
Improve
|
Worsen
|
No change
|
Net response
|
Improve
|
Worsen
|
No change
|
Net response
|
|
Q3:2022-23
|
1,356
|
20.4
|
9.7
|
69.9
|
10.7
|
59.6
|
0.8
|
39.6
|
58.9
|
|
Q4:2022-23
|
1,066
|
11.1
|
3.6
|
85.3
|
7.6
|
51.3
|
1.3
|
47.4
|
50.1
|
|
Q1:2023-24
|
1,247
|
23.8
|
5.8
|
70.4
|
18.0
|
34.3
|
1.8
|
64.0
|
32.5
|
|
Q2:2023-24
|
1,223
|
24.3
|
5.7
|
69.9
|
18.6
|
52.4
|
2.0
|
45.7
|
50.4
|
|
Q3:2023-24
|
1,040
|
20.2
|
6.0
|
73.9
|
14.2
|
56.4
|
2.9
|
40.7
|
53.5
|
|
Q4:2023-24
|
|
|
|
|
|
45.3
|
1.4
|
53.4
|
43.9
|
|
‘Improvement’ in availability of finance is optimistic.
|
|
Table 17: Assessment and Expectations for Cost of Finance
(per cent)
|
|
Quarter
|
Total response
|
Assessment
|
Expectations
|
|
Increase
|
Decrease
|
No change
|
Net
response
|
Increase
|
Decrease
|
No change
|
Net response
|
|
Q3:2022-23
|
1,356
|
37.0
|
5.9
|
57.1
|
-31.1
|
53.5
|
1.6
|
44.9
|
-51.9
|
|
Q4:2022-23
|
1,066
|
36.2
|
3.8
|
60.0
|
-32.4
|
51.6
|
1.1
|
47.3
|
-50.5
|
|
Q1:2023-24
|
1,247
|
36.9
|
4.5
|
58.6
|
-32.4
|
47.5
|
1.7
|
50.8
|
-45.8
|
|
Q2:2023-24
|
1,223
|
33.0
|
6.6
|
60.4
|
-26.4
|
56.4
|
2.2
|
41.5
|
-54.2
|
|
Q3:2023-24
|
1,040
|
29.2
|
6.8
|
64.0
|
-22.5
|
58.5
|
3.6
|
37.9
|
-54.9
|
|
Q4:2023-24
|
|
|
|
|
|
48.8
|
2.9
|
48.3
|
-45.9
|
|
‘Decrease’ in cost of finance is optimistic.
|
|
Table 18: Assessment and Expectations for Cost of Raw Materials
(Percentage responses)
|
|
Quarter
|
Total response
|
Assessment
|
Expectations
|
|
Increase
|
Decrease
|
No change
|
Net
response
|
Increase
|
Decrease
|
No change
|
Net response
|
|
Q3:2022-23
|
1,356
|
73.0
|
8.1
|
18.9
|
-64.9
|
66.8
|
2.6
|
30.7
|
-64.2
|
|
Q4:2022-23
|
1,066
|
64.5
|
5.4
|
30.2
|
-59.1
|
63.4
|
2.4
|
34.2
|
-60.9
|
|
Q1:2023-24
|
1,247
|
49.1
|
8.0
|
42.8
|
-41.1
|
62.6
|
1.7
|
35.8
|
-60.9
|
|
Q2:2023-24
|
1,223
|
49.3
|
5.5
|
45.3
|
-43.8
|
60.6
|
2.4
|
37.0
|
-58.3
|
|
Q3:2023-24
|
1,040
|
41.8
|
8.4
|
49.7
|
-33.4
|
67.8
|
2.8
|
29.3
|
-65.0
|
|
Q4:2023-24
|
|
|
|
|
|
57.0
|
2.9
|
40.1
|
-54.2
|
|
‘Decrease’ in cost of raw materials is optimistic.
|
|
Table 19: Assessment and Expectations for Salary/Other Remuneration
(Percentage responses)
|
|
Quarter
|
Total response
|
Assessment
|
Expectations
|
|
Increase
|
Decrease
|
No change
|
Net response
|
Increase
|
Decrease
|
No change
|
Net response
|
|
Q3:2022-23
|
1,356
|
30.1
|
3.1
|
66.8
|
-27.0
|
46.3
|
0.3
|
53.4
|
-46.0
|
|
Q4:2022-23
|
1,066
|
23.1
|
1.9
|
75.0
|
-21.2
|
39.3
|
0.6
|
60.0
|
-38.7
|
|
Q1:2023-24
|
1,247
|
41.1
|
3.0
|
56.0
|
-38.1
|
45.2
|
0.9
|
53.9
|
-44.3
|
|
Q2:2023-24
|
1,223
|
32.3
|
3.5
|
64.2
|
-28.8
|
49.8
|
0.5
|
49.7
|
-49.3
|
|
Q3:2023-24
|
1,040
|
30.3
|
4.1
|
65.7
|
-26.2
|
47.3
|
1.7
|
51.0
|
-45.6
|
|
Q4:2023-24
|
|
|
|
|
|
42.9
|
0.9
|
56.2
|
-42.0
|
|
‘Decrease’ in Salary / other remuneration is optimistic.
|
|
Table 20: Assessment and Expectations for Selling Price
(Percentage responses)
|
|
Quarter
|
Total response
|
Assessment
|
Expectations
|
|
Increase
|
Decrease
|
No change
|
Net response
|
Increase
|
Decrease
|
No change
|
Net response
|
|
Q3:2022-23
|
1,356
|
23.3
|
12.9
|
63.8
|
10.4
|
48.8
|
3.7
|
47.5
|
45.1
|
|
Q4:2022-23
|
1,066
|
21.6
|
11.8
|
66.6
|
9.7
|
43.2
|
3.6
|
53.1
|
39.6
|
|
Q1:2023-24
|
1,247
|
26.1
|
13.3
|
60.6
|
12.8
|
34.0
|
5.6
|
60.4
|
28.4
|
|
Q2:2023-24
|
1,223
|
22.3
|
10.6
|
67.1
|
11.7
|
46.9
|
5.4
|
47.7
|
41.4
|
|
Q3:2023-24
|
1,040
|
22.0
|
11.9
|
66.1
|
10.2
|
45.2
|
5.2
|
49.6
|
40.1
|
|
Q4:2023-24
|
|
|
|
|
|
40.4
|
5.6
|
54.0
|
34.8
|
|
‘Increase’ in selling price is optimistic.
|
|
Table 21: Assessment and Expectations for Profit Margin
(Percentage responses)
|
|
Quarter
|
Total response
|
Assessment
|
Expectations
|
|
Increase
|
Decrease
|
No change
|
Net response
|
Increase
|
Decrease
|
No change
|
Net response
|
|
Q3:2022-23
|
1,356
|
17.6
|
26.1
|
56.3
|
-8.4
|
44.2
|
9.0
|
46.8
|
35.2
|
|
Q4:2022-23
|
1,066
|
16.2
|
21.6
|
62.1
|
-5.4
|
41.0
|
8.1
|
50.9
|
32.9
|
|
Q1:2023-24
|
1,247
|
20.6
|
21.8
|
57.5
|
-1.2
|
30.5
|
11.4
|
58.1
|
19.1
|
|
Q2:2023-24
|
1,223
|
21.9
|
17.4
|
60.7
|
4.5
|
43.8
|
8.1
|
48.1
|
35.7
|
|
Q3:2023-24
|
1,040
|
20.5
|
19.1
|
60.4
|
1.4
|
45.5
|
9.7
|
44.8
|
35.8
|
|
Q4:2023-24
|
|
|
|
|
|
40.3
|
9.5
|
50.2
|
30.8
|
|
‘Increase’ in profit margin is optimistic.
|
|
Table 22: Assessment and Expectations for Overall Business Situation
(Percentage responses)
|
|
Quarter
|
Total response
|
Assessment
|
Expectations
|
|
Better
|
Worsen
|
No change
|
Net response
|
Better
|
Worsen
|
No change
|
Net response
|
|
Q3:2022-23
|
1,356
|
37.7
|
17.4
|
44.9
|
20.3
|
63.8
|
4.4
|
31.7
|
59.4
|
|
Q4:2022-23
|
1,066
|
45.9
|
11.4
|
42.7
|
34.4
|
66.9
|
3.7
|
29.4
|
63.1
|
|
Q1:2023-24
|
1,247
|
39.9
|
15.0
|
45.1
|
24.9
|
62.4
|
4.0
|
33.6
|
58.3
|
|
Q2:2023-24
|
1,223
|
46.0
|
11.8
|
42.2
|
34.3
|
65.0
|
4.3
|
30.7
|
60.7
|
|
Q3:2023-24
|
1,040
|
40.6
|
12.0
|
47.4
|
28.6
|
73.1
|
5.2
|
21.7
|
67.9
|
|
Q4:2023-24
|
|
|
|
|
|
62.5
|
4.2
|
33.3
|
58.3
|
|
‘Better’ Overall Business Situation is optimistic.
|
|
Table 23: Business Sentiments
|
|
Quarter
|
Business Assessment Index (BAI)
|
Business Expectations Index (BEI)
|
|
Q3:2022-23
|
108.6
|
134.4
|
|
Q4:2022-23
|
112.2
|
132.9
|
|
Q1:2023-24
|
112.2
|
126.4
|
|
Q2:2023-24
|
115.0
|
132.5
|
|
Q3:2023-24
|
113.9
|
135.4
|
|
Q4:2023-24
|
|
130.3
|
[1].सर्वेक्षण के परिणाम उत्तरदाताओं के विचारों को दर्शाते हैं, जिन्हें आवश्यक रूप से रिज़र्व बैंक द्वारा साझा नहीं किया जाता है। पिछले सर्वेक्षण दौर के परिणाम 6 अक्टूबर, 202 3 को बैंक की वेबसाइट पर जारी किए गए।
[2] Net Response (NR) is the difference between the percentage of respondents reporting optimism and those reporting pessimism. It ranges between -100 to 100. Any value greater than zero indicates expansion/optimism and any value less than zero indicates contraction/pessimism. In other words, NR = (I – D), where, I is the percentage response of ‘Increase/optimism’, and D is the percentage response of ‘Decrease/pessimism’ and E is the percentage response as ‘no change/equal’ (i.e., I+D+E=100). For example, increase in production is optimism whereas decrease in cost of raw material is optimism.
|
 IST,
IST,