 IST,
IST,
Quarterly Order Books, Inventories and Capacity Utilisation Survey: October-December 2011 (16th Round)
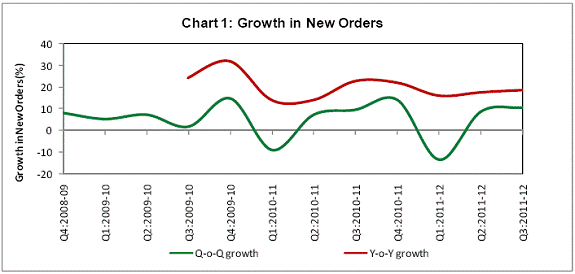
The Reserve Bank of India has been conducting Order Books, Inventories and Capacity Utilisation Survey (OBICUS) on a quarterly basis. This article, third in the series, presents the findings of OBICUS conducted for Q3:2011-12, the 16th round in the series. During Q3:2011-12, new orders of respondent companies increased by 10.6 per cent over that in the previous quarter and it is reflected in increased level of capacity utilisation (CU). Both finished goods inventory to sales ratio and raw material to sales ratio declined. I. Introduction The Reserve Bank of India has been conducting Order Books, Inventories and Capacity Utilisation Survey (OBICUS) on a quarterly basis. The survey captures the movements in order books, inventories and capacity utilisation which are important indicators of economic activity, inflationary pressures and overall business cycle and as such, are useful for assessing the consumption and investment demand outlook. The survey captures quantitative data on new orders received during the reference quarter, backlog orders at the beginning of the quarter, pending orders at the end of the quarter, total inventories with breakup of work-in-progress and finished goods inventories at the end of the quarter and item-wise production in terms of quantity and values during the quarter vis-à-vis the installed capacity from a targeted group of manufacturing companies). The level of capacity utilisation is derived from the data provided by companies as per the selected methodology. The survey is canvassed among 2,500 public and private limited companies in the manufacturing sector with a good size/industry representation. Trend analysis is done to study the movements in inventories, order books and capacity utilisation based on a common set of companies in each round to facilitate better comparability of data over the reference quarters. The common set of companies may vary to some extent across the survey rounds depending upon the response pattern in each survey round. II. Sample composition and response to the present survey In all 1207 companies participated in the survey for the quarter October-December 20111. Of this, 49 are government companies, 302 are non-government private limited and 856 are non-government public limited companies. The analysis is based on the data provided by these companies for last 13 quarters i.e. Q3:2008-09 to Q3:2011-12. The data tables are given in Annex. III. Findings of Survey III.1 Order Books – Average new orders of respondent companies, increased by 10.6 per cent in the current quarter over that in the previous quarter and by 18.7 per cent over the new orders received in the same quarter a year ago. (Chart 1, Table 1).
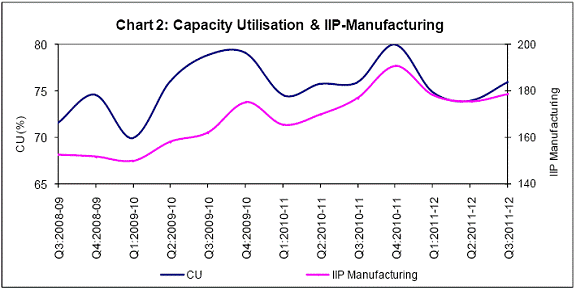
III.2 Capacity Utilisation (CU) –In line with higher new orders, CU of respondent companies at overall level increased to 75.9 per cent in Q3:2011-12 from 73.9 per cent in the previous quarter. However, the current level of CU is still below the peak observed during Q4:2010-11. The movement of CU is in tandem with the Index of Industrial Production (IIP) for manufacturing sector (Chart 2, Table 2).
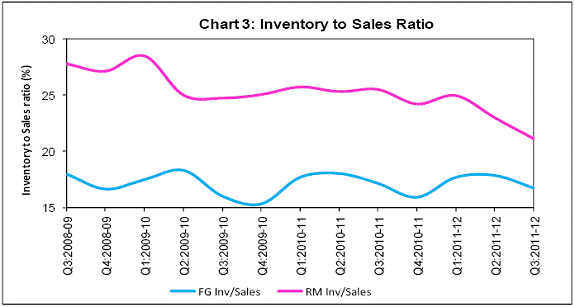
III.3 Inventories - During Q3: 2011-12, the average total inventory of respondent companies grew by 5.4 per cent over the previous quarter, whereas the average finished goods (FG) inventory increased by 7.7 per cent. Total inventory to sales ratio declined to 44.6 per cent at the end of Q3:2011-12. Raw material (RM) inventory to sales ratio at 21.1 per cent was at the lowest level in last 13 quarters under review. FG inventory to sales ratio which was at an elevated level in the previous two quarters, also declined in Q3:2011-12 (Chart 3, Table 3).
IV. Conclusion Based on various parameters viz., new orders growth, level of capacity utilization and finished goods inventory to sales ratio, the survey results indicate slight improvement in demand condition. Level of capacity utilization (CU) increased over previous quarter, but was well below the peak level achieved in Q4:2010-11.
* Prepared in the Division of Enterprise Survey of Department of Statistics and Information Management. The previous article on the subject based on the 15th survey round (July - September 2011) was published in February 2012 Bulletin. 1 The number of respondents for different segments varies to some extent. |
||||||||||||||||||||||||||||||||||||||||||||||||||||||||||||||||||||||||||||||||||||||||||||||||||||||||||||||||||
पृष्ठ अंतिम बार अपडेट किया गया:


