 IST,
IST,


अर्थव्यवस्था की स्थिति
|
The global economy is in a state of flux, reeling from the twin shocks of trade policy uncertainties and a spike in geo-political tensions. In this state of elevated global uncertainty, various high-frequency indicators for May 2025 point towards resilient economic activity in India across the industrial and services sectors. Agriculture showed a broad-based increase in production across most major crops during 2024-25. The domestic prices situation remains benign with headline inflation staying below the target for the fourth consecutive month in May. Financial conditions remained conducive to facilitate an efficient transmission of rate cuts to the credit market. Introduction The global economy is in a state of flux, reeling from the twin shocks of trade policy uncertainties and a spike in geo-political tensions. The optimism from a temporary tariff freeze and trade deals has kept financial market sentiments buoyed in May and early-June 2025. However, following the outbreak of the Iran-Israel conflict, heightened uncertainty and volatility have once again gripped financial markets. Meanwhile, the OECD and World Bank reports released in June have reaffirmed the possibility of a marked deterioration in the medium-term global economic prospects amidst rising trade barriers and restrictions. Reflecting the trade policy uncertainties, high-frequency indicators on global manufacturing activity for the month of May contracted for the second consecutive month. Global supply chain pressures also intensified. While food prices softened, non-food commodity prices have shown volatile movements accentuated by geopolitical tensions. Crude oil prices surged since June 13 on renewed tensions in the Middle East while gold prices also rallied on safe-haven demand. In contrast, the US dollar witnessed a depreciating trend, hitting a three-year low on June 12 following tariff uncertainty and fiscal debt concerns. Since June 13, the US dollar, however, strengthened somewhat in response to rising geo-political risks. Headline inflation rates among Advanced Economies (AEs) and Emerging Markets and Developing Economies (EMDEs) showed marked variations in their trajectories during April-May, driven mostly by country-specific factors. Amidst heightened concerns on their domestic growth outlook, several central banks utilised the headroom provided by lower inflation prints to further reduce policy rates. On the domestic front, the provisional estimates released in May have reaffirmed growth to be 6.5 per cent in 2024-25, with a significant sequential pick-up in Q4. Various high-frequency indicators for May point to signs of resilient economic activity across the industrial and services sector. In fact, among the countries surveyed for the Purchasing Managers’ Index (PMI), overall expansion in activity was the highest in India with the expansion in new export orders witnessed in May being an outlier, amidst contraction seen in other major economies. Capacity utilisation by manufacturing firms remained above its long-period average. High-frequency indicators of aggregate demand for May also suggested a pick-up in rural demand, especially given the strong performance of the agricultural sector. Forward-looking surveys of consumer sentiments show stable consumer confidence for the current period and improved optimism about the future.1 All of these indicate considerable resilience of the Indian economy, notwithstanding the global economic, trade, and geo-political uncertainties. Domestic inflation remains benign with headline inflation remaining below the target for the fourth consecutive month in May. Record domestic crop production in 2024-25 agricultural season is translating into a sharp and sustained easing of food price inflation. Steady core [Consumer Price Index (CPI) excluding food and fuel] inflation, with indications of some softening after excluding the impact of volatile and elevated gold and silver prices, indicates that underlying inflationary pressures remain muted. Equity markets registered modest gains during May-June, notwithstanding fluctuating movements caused by global cues on economic outlook, tariff-related news and the evolving domestic scenario. With the flaring up of geopolitical tensions in the Middle East, the equity market registered a brief sharp fall before witnessing a significant rebound on June 20. Although credit growth decelerated in April – notably in the agriculture and services sectors – non-bank sources of credit, including external commercial borrowing (ECB) inflows continued to be healthy, although it moderated from March. Overall, financial conditions remained conducive to facilitate an efficient transmission of rate cuts to the credit market. The external sector continued to be robust, with adequate forex reserve cover for imports and external debt. Set against this backdrop, the remainder of the article is structured into four sections. Section II covers the rapidly evolving developments in the global economy. Section III provides an assessment of domestic macroeconomic conditions. Section IV encapsulates financial conditions in India, while Section V presents the concluding observations. Global economic prospects remained fragile even as economic and financial uncertainty receded from their heightened levels in April buoyed by optimism emanating from the US tariff freeze and bilateral trade deals (Chart II.1). Since June 13, however, uncertainty once again loomed large over the macroeconomic landscape in the wake of renewed geopolitical turbulence in the Middle East.  The OECD’s Economic Outlook released in June 2025 revised the global GDP growth forecast to 2.9 per cent for both 2025 and 2026. The growth forecasts are lower from their March release by 20 basis points (bps) for 2025 and 10 bps for 2026. This revision stemmed from the assumption that bilateral tariff regimes, as in mid-May, would persist unaltered throughout the remainder of 2025 and into 2026. The deteriorating economic prospects were most acutely visible for North America and parts of Asia, notably China (Table II.1). Moreover, the World Bank in its latest Global Economic Prospects (GEP), projected global GDP growth (using PPP weights) to decelerate to 2.9 per cent in 2025 but recover marginally to 3.0 per cent in 2026. The cumulative decline of 50 bps in projections [30 bps in 2025 and 20 bps in 2026] has been primarily attributed to increased trade tensions and heightened policy uncertainty. Global trade has also been projected to decelerate to 1.8 per cent in 2025, marking a downward revision of 1.3 percentage points from the previous release. The global composite PMI expanded to 51.2 in May, albeit at a modest pace. While global PMI services showed an expansion led by the business services sector, the global manufacturing PMI contracted for the second successive month in May to a five-month low of 49.6 (Table II.2). Export orders across manufacturing and services remained in the contraction zone for the second consecutive month in May. In May 2025, there were marked variations in the global composite PMI readings across jurisdictions. While the US and the UK showed an improvement in business conditions, the Eurozone and Japan reported a moderation (Chart II.2a). The significant expansion in new export orders for India was an exception, with most major economies continuing to record a contraction (Chart II.2b).  Commodity prices continued their downward movement in May 2025, as indicated by both the Bloomberg Commodity Index and the World Bank Commodity Price Index. This downtrend was aided by lower food prices that offset an uptick in energy and industrial metal prices. Food prices2 moderated by 0.8 per cent month-on-month (m-o-m) in May, primarily driven by a decline in the prices of vegetable oil, sugar, and cereals (Chart II.3a). High frequency commodity price data for June indicate a sharp pick-up in crude oil prices from their end-May levels on account of escalating geopolitical tensions between Russia and Ukraine, as well as intensifying conflict between Israel and Iran. Copper prices also saw an uptick in June, aided by US-China trade truce and speculation over potential US import duties on the metal. Gold prices have remained elevated so far in June, bolstered by safe-haven demand amidst concerns about mounting US debt and geopolitical risks (Chart II.3b). Amidst ongoing trade tensions, the Global Supply Chain Pressure Index (GSCPI) rose above its historical average levels to 0.19 in May 2025 suggesting some stress in supply chain (Annex Chart A3).   Recent readings of inflation point to diverging trajectories in AEs as well as EMEs. While inflation in the Euro area moderated to below target in May supported by lower energy prices, inflation in the UK edged up while that in Japan and the US continued to remain sticky and above the target due to pressures from inflation in the services sector (Chart II.4a). Among EMEs, while CPI inflation in Brazil and Russia remained elevated above the target rate, China continued to experience deflation amidst weak domestic demand and persistent employment uncertainty. Inflation in South Africa remained below target (Chart II.4b and Annex Chart A4).  In May, global equity markets regained their lost ground, buoyed by improved sentiments on signs of de-escalation of trade tensions and upbeat earnings report (Chart II.5a). The uptrend continued in early June, supported by the announcement of a breakthrough in trade negotiations between the US and China. With uncertainties receding from its heightened level of April, global VIX exhibited a decline in May, though punctuated with sporadic upticks within a tight range. However, the rally in global equities was subsequently capped by a resurgence in geopolitical risks. The global VIX also increased from around mid-June. Yields on US government securities hardened in May on concerns regarding higher near-term inflation and increased term premia on account of the worsening US fiscal outlook, while EME spreads widened amidst increased risk-off sentiment (Chart II.5b). In June (up to June 20, 2025), yields in the US remained volatile as rising geopolitical tensions also resulted in higher safe haven demand. EME spreads continued to increase on intensifying geopolitical tensions. The US dollar appreciated somewhat in the first half of May, fuelled by a US–China tariff suspension but shed gains subsequently on growth slowdown fears and fiscal concerns. In June (up to June 20, 2025), weak signals, emerging from the Institute for Supply Management (ISM) PMI, labour market and lower-than-expected CPI in the US, have continued to exert bearish pressure on the dollar though some appreciation was witnessed after the Israel-Iran conflict on safe haven demand (Chart II.5c). Mirroring the dollar movement, the MSCI EME Currency Index has increased since May, with equity markets recording inflows; however, a reversal in trend has been witnessed since mid-June (Chart II.5d).  In the monetary policy meetings conducted during May-June 2025, most central banks continued to lower policy rates amidst heightened macroeconomic uncertainties. Among AEs, New Zealand and South Korea reduced their policy rates by 25 bps in May while ECB and Sweden reduced their policy rates by 25 bps in their June meetings. Switzerland also reduced its key rate in June by 25 bps to zero amidst domestic deflation. On the other hand, Canada, Japan, the UK, and the US maintained status quo on policy rates in June amidst uncertain macroeconomic outlook (Chart II.6). Several EME central banks undertook policy easing to support growth. In May, Indonesia and South Africa reduced their policy rates by 25 bps each, while Mexico pared its benchmark interest rate by 50 bps. In June so far, Philippines cut its benchmark rate by 25 bps. In contrast, Brazil delivered 25 bps rate hike in June, following a 50 bps increase in May due to persistent domestic inflation, raising the policy rate to a near 20-year high. Amidst elevated global trade uncertainty, the Indian economy remained resilient, registering the highest growth among the world’s major economies, with the latest estimates for Q4:2024-25 indicating a sharp pick-up in momentum. Aggregate Demand The provisional estimates (PE) of national income released by the National Statistical Office (NSO) on May 30, 2025 placed India’s real gross domestic product (GDP) growth at 6.5 per cent for 2024-25, same as the second advance estimates (SAE). The dual engines of India’s growth–private final consumption expenditure (PFCE) and gross fixed capital formation (GFCF)–contributed 4 percentage points and 2.4 percentage points, respectively, to GDP growth. In terms of the quarterly trajectory, the Indian economy registered a growth of 7.4 per cent in Q4:2024-25, notably higher than 6.4 per cent recorded in the preceding quarter. The pick-up in growth was mainly driven by fixed investment, which increased sharply to 9.4 per cent from a low of 5.2 per cent in the preceding quarter, owing to a sustained momentum in construction activity. Despite a challenging external environment, the contribution of net exports to GDP was the highest since Q2:2020-21. The contribution of PFCE and government final consumption expenditure (GFCE), however, moderated (Chart III.1).   High-frequency indicators for May present mixed signals on aggregate demand. Urban demand showed signs of moderation as passenger vehicle sales declined with a sharp drop in entry-level segment. However, rural demand improved as evident from the increase in the retail sales of two-wheelers.3 During May 2025, household demand for work under the Mahatma Gandhi National Rural Employment Guarantee Scheme (MGNREGS) picked up, following the pursuit of alternative avenues for employment in the pre-sowing lean agricultural period and an increase in MGNREGS wage rates (Table III.1).  Employment indicators in May 2025 present a mixed picture. As per monthly Periodic Labour Force Survey (PLFS), the all-India unemployment rate rose to 5.6 per cent in May from 5.1 per cent last month, with a sharper increase in rural vis-à-vis urban areas. Increase in unemployment was partly driven by seasonal agricultural patterns and extreme heat in some regions, limiting outdoor work.4 Organised job listings, as per the Naukri JobSpeak Index, moderated – dragged down by information technology (IT), retail, and banking and financial services – while sectors like insurance, real estate, oil and gas and emerging technologies recorded growth. However, the PMI employment diffusion indices signalled strong job creation in organised manufacturing and services, with 14 per cent of firms reporting increased payrolls (Table III.2). Overall economic activity remained robust in May 2025, with key high-frequency indicators like E-way bills, Goods and Services Tax (GST) revenue, toll collections, and digital payments showing strong growth (Table III.3). GST revenue collections surpassed the ₹2 lakh crore mark for the second consecutive month in May, boosted by import-related GST receipts.5 Petroleum consumption expanded for the first time in the last four months, driven by petrol. Unseasonal rains and premature onset of monsoon, however, led to a reduction in electricity demand.6 Government Finances The provisional accounts (PA) for 2024-25 released on May 30, 2025, confirmed that the fiscal indicators are more or less in line with the revised estimates (RE). The gross fiscal deficit (GFD) of the union government stood at 4.8 per cent of GDP, lower than the initially budgeted estimate (BE) but slightly above the revised estimate (RE). On the other hand, the revenue deficit (RD), at 1.7 per cent of GDP, was lower than BE and RE. The moderation in revenue expenditure, along with robust growth in revenue receipts paved the way for fiscal consolidation (Table III.4).   On the receipts side, the gross and net tax revenue posted healthy growth of 9.5 per cent and 7.4 per cent, respectively. Gross tax revenue stood at 11.5 per cent of GDP in 2024-25 (PA) [Annex Chart A5]. While the growth in the corporation tax was higher than RE, the growth in income tax was slightly lower than RE. Although the union excise duty and custom duty collections were broadly in line with RE, their growth rate contracted from the previous year. Apart from higher surplus transfer from the Reserve Bank, higher dividend transfer from central public sector enterprises (CPSEs) pushed non-tax revenue growth in 2024-25 above RE. The total expenditure of the union government registered a growth of 4.8 per cent in 2024-25 (PA) over 2023-24. As per cent of GDP, while revenue expenditure declined in 2024-25 (PA) vis-à-vis RE, capital expenditure remained broadly unchanged (Annex Chart A6). The growth in interest payments moderated, while that of subsidy outgo saw a contraction during 2024-25 (PA) in line with RE. Furthermore, the ratio of revenue expenditure to capital outlay (RECO) declined to 4.2, lower than RE (from 4.4 in 2023-24), which bodes well for the quality of public expenditure. Central government finances for April 2025 indicated an improvement in GFD and RD – both in absolute terms and as per cent of BE – vis-à-vis the corresponding period of the previous year, aided by substantial growth in non-tax revenue, and non-debt capital receipts (including disinvestment receipts). While revenue expenditure recorded a contraction due to a decline in interest payments, capital outlay grew by 20.9 per cent. Consolidated state government finances for 2024-25 (PA)7 witnessed some deterioration. The consolidated GFD to gross state domestic product (GFD-GSDP) ratio of states rose in 2024-25 owing to a shortfall in tax revenue and lower grants from the centre. The moderation in revenue receipts outweighed the decline in revenue expenditure, leading to a widening of the revenue deficit. Meanwhile, capital expenditure, as a per cent of GSDP, remained stable, aided by a significant year-end surge in most states. For 2025-26, states have budgeted a GFD-GDP ratio of 3.3 per cent, along with a rise in capital outlay to 3.0 per cent of GDP, reflecting a continued focus on enhancing the quality of expenditure within a calibrated fiscal path (Table III.5). Trade India’s merchandise exports contracted by (-) 2.2 per cent (y-o-y) to US$38.7 billion in May 2025 due to an unfavourable base effect (Chart III.2). Exports of 13 out of 30 major commodities (accounting for 59.0 per cent of the export basket in 2024-25) contracted on a y-o-y basis in May. Petroleum products, gems and jewellery, iron ore, engineering goods and cotton yarn/fabrics contributed negatively while electronic goods, organic and inorganic chemicals, drugs and pharmaceuticals, marine products and readymade garments (RMG) of all textiles supported export growth in May. Exports to 10 out of 20 major destinations expanded in May 2025, including to the US, China and Singapore.  Merchandise imports also contracted by (-) 1.7 per cent (y-o-y) to US$60.6 billion in May 2025 (Chart III.3). Imports of 10 out of 30 major commodities (accounting for 51.5 per cent of import basket in 2024-25) contracted on y-o-y basis in May. Petroleum, crude and products, transport equipment, coke, coal and briquittes, gold and pearls, precious and semi-precious stones pulled down import growth, while chemical material and products, electronic goods, machinery, silver, and non-ferrous metals supported import growth during May. Imports from 9 out of 20 major source countries contracted. Among major trading partners, imports from China, the UAE, and the US expanded in May.   Merchandise trade deficit narrowed to US$21.9 billion in May 2025 from US$22.1 billion in May 2024. Oil deficit narrowed to US$9.1 billion in May from US$11.9 billion a year ago. Consequently, its share in total trade deficit declined to 41.6 per cent in May from 53.8 per cent a year ago. In contrast, non-oil deficit widened to US$12.8 billion in May from US$10.2 billion a year ago. In April 2025, net services export earnings expanded by 18.8 per cent (y-o-y). While imports increased modestly by 0.9 per cent to US$16.9 billion, exports rose by 8.8 per cent to US$32.8 billion, driven by software and business services (Chart III.4). Aggregate Supply On the supply side, real gross value added (GVA) at basic prices registered a growth of 6.4 per cent in 2024-25, unchanged from the SAE. In terms of quarterly estimates, Q4:2024-25 registered an acceleration of GVA to 6.8 per cent from 6.5 per cent in the preceding quarter. The momentum in quarterly GVA growth was driven by the industrial and services sector (Chart III.5). Agriculture The third advance estimates (AE) released on May 29, 2025 reflected a broad-based increase in production over the previous year, across almost all major crops, barring sugarcane and cotton (Chart III.6). The rise in crop production was mainly attributed to good rainfall along with comfortable reservoir positions throughout the year.   High-frequency indicators for the ongoing kharif agricultural season indicate largely favourable conditions for good sowing, though uncertainties remain on the spatiotemporal distribution of monsoon.8 The early onset of the monsoon has helped in reducing the incidence of heat waves on standing crops. However, it was followed by a monsoon break in the first half of June. Rainfall has picked up again leading to an increase in the reservoir storage to 32 per cent of its full capacity, which is higher than its decadal average9 (as on June 19, 2025). The cumulative deficit in south-west monsoon (SWM) rainfall (June 1-20, 2025) has reduced to just 1 per cent of the long-period average (LPA), with central and northwest India receiving above normal rainfall. The combined public stock of rice and wheat remains comfortable at 4.6 times the buffer norm and higher by 20.1 per cent over the last year on account of bumper rabi and kharif harvests (as on June 01, 2025). On May 28, 2025, the government announced minimum support prices (MSPs) for kharif marketing season (KMS) of 2025-26 for 14 major crops (Chart III.7). The announcement was in line with the government’s efforts for the past few years to align MSPs in favour of oilseeds, pulses, and nutri-cereals to encourage crop diversification, correct the demand-supply imbalance and promote sustainable agriculture.  Industry and Services Quarterly results of listed private non-financial companies for Q4:2024-25 suggest slower revenue growth accompanied by increased profitability. At the aggregate level, sales growth of listed non-government non-financial companies witnessed a slight moderation as compared to the previous quarter, with listed private manufacturing companies experiencing an easing in sales performance amidst subdued demand conditions (Chart III.8).10 Amid macroeconomic and global uncertainties, sales growth improved for IT companies, whereas non-IT services companies experienced a slowdown during the same period. Although major industries continued to record double-digit sales growth, weaker performance of petroleum industry weighed on the overall performance of the manufacturing sector. Excluding petroleum, sales growth in the manufacturing sector remained steady at 9.0 per cent (Chart III.9). Industrial activity, as measured by the Index of Industrial Production (IIP), slowed to an eight-month low of 2.7 per cent in April 2025, with a major drag emanating from mining and quarrying, while manufacturing posted a modest growth. Within the use-based categories, capital goods and consumer durables expanded while consumer non-durables and primary goods dragged down growth. The growth of Eight Core Industries (ECI) Index also slowed to a nine-month low of 0.7 per cent y-o-y in May 2025 as compared to 6.9 per cent in May 2024.    Available high-frequency indicators for May point to resilient industrial activity, with steady expansion in PMI manufacturing and strong growth in capital goods and steel output. Automobile production rebounded in May, with two-wheeler output recovering from last month’s contraction and three-wheeler production recording a sharp acceleration. However, conventional electricity generation showed intermittent weakness for the second consecutive month (Table III.6). Supply chain pressures eased further to below their historical average levels due to improvements in both suppliers’ delivery time and semiconductor supplies and a decline in new orders (Annex Chart A7). In pursuit of its net zero targets, India’s push for renewable energy capacity, gathered further momentum in FY 2024-25. The total installed renewable energy capacity increased by 29.52 gigawatts, driven mainly by the rise in the installed capacity under solar, wind and hydro energy projects (Chart III.10).  Capacity Composition") India’s services sector sustained a strong growth momentum in May, driven by a robust export demand and a record surge in hiring (Table III.7). Port traffic expanded for the sixth consecutive month in May, led by a higher growth in containerised cargo, iron ore and petroleum, oil and lubricants (POL). Growth in construction sector indicators – steel consumption and cement production – inched up in May.  Inflation Headline inflation, as measured by y-o-y changes in the all-India consumer price index (CPI),11 moderated to 2.8 per cent in May 2025 (the lowest since February 2019) from 3.2 per cent in April (Chart III.11). The decline in headline inflation by 34 bps came from a negative base effect of 54 bps, which more than offset a positive price momentum of 20 bps. A positive momentum was recorded across all groups within CPI.12 Food inflation (y-o-y) decelerated to 1.5 per cent in May, the lowest in 73 months. Within subgroups, vegetables, pulses, and meat and fish continued to record deflation. A moderation in inflation was also observed in cereals, eggs, sugar, and fruits. Inflation, however, picked up in milk and products, oils and fats, and non-alcoholic beverages. Spices continued to record deflation, albeit at a slower pace, while inflation in prepared meals remained steady (Chart III.12). Fuel and light inflation softened marginally to 2.8 per cent in May from 2.9 per cent in April. While kerosene prices continued to remain in deflation and inflation for electricity moderated, it increased for LPG, firewood, and chips. Core CPI inflation remained steady at 4.2 per cent in May, same as in April. An increase in inflation in its subgroups, such as pan, tobacco and intoxicants, housing, transport and communication, and personal care and effects, was offset by a moderation in household goods and services, and recreation and amusement. Inflation in clothing and footwear, and health remained steady. In terms of regional distribution, rural and urban inflation eased to 2.6 per cent and 3.1 per cent, respectively, in May 2025. At the state level, inflation ranged from 0.6 per cent to 6.8 per cent. Majority of the states experienced inflation between 2 - 4 per cent (Chart III.13).   High-frequency food price data for June so far (up to June 20, 2025) shows a moderation in prices of pulses while prices of cereals have risen marginally. Edible oil prices, on the other hand, have firmed up-driven by soybean, sunflower, and mustard oil, while palm and groundnut oil prices have moderated. Among the key vegetables, prices of onion have recorded further correction, while potato and tomato prices have increased (Chart III.14). ") Retail selling prices of petrol and diesel have remained broadly unchanged in June so far (up to June 20, 2025). Kerosene prices declined while LPG prices remained unchanged (Table III.8). The PMIs for May 2025 recorded an uptick in the rate of expansion of input prices for manufacturing and services. Selling price pressures, however, firmed up in services but moderated for manufacturing firms (Annex Chart A8). Rural labour wage growth continued to increase in April 2025, driven by occupations in the agricultural sector. Within agriculture, a pick-up in wage rates for harvesting, picking and horticulture workers drove the overall wage growth. Non-agricultural wage growth has remained stable since January 2025 (Chart III.15).   System liquidity continued to be in surplus during May and June (up to June 20, 2025). While the increase in currency in circulation (CiC) has exerted some pressure on banking system liquidity in FY:2025-26 so far, it has been offset by the expansion in liquidity from RBI’s durable liquidity measures since January 2025. The Reserve Bank injected a cumulative amount of ₹0.81 lakh crore into the banking system through 18 fine-tuning variable rate repo (VRR) operations with maturities ranging from 1 to 3 days during the period May 16 to June 10, 2025. Reflecting these developments, the average daily net absorption under the liquidity adjustment facility (LAF) stood at ₹2.47 lakh crore during the period May 16 to June 20, 2025, as compared to ₹1.42 lakh crore during the period April 16 to May 15, 2025 (Chart IV.1). Amidst surplus liquidity conditions, the average balances under the standing deposit facility (SDF) continued to remain elevated and stood at ₹2.62 lakh crore during the period May 16 to June 20, 2025, as compared to ₹1.77 lakh crore during the period April 16 to May 15, 2025. Banks’ recourse to the marginal standing facility (MSF) was marginally lower, averaging ₹0.01 lakh crore during the period May 16 to June 20, 2025, as against ₹0.02 lakh crore during the period April 16 to May 15, 2025. High SDF balances, coupled with tepid response to daily VRR auctions in the recent period amidst muted credit offtake, suggest comfortable liquidity conditions. In view of this, the Reserve Bank decided to discontinue daily VRR auctions effective June 11, 2025. The RBI also announced a reduction in the cash reserve ratio (CRR) by 100 bps to 3.0 per cent of net demand and time liabilities (NDTL) in a staggered manner during the latter half of the year. This reduction will be carried out in four equal tranches of 25 bps each with effect from the fortnights beginning September 6, October 4, November 1 and November 29, 2025. The reduction in CRR would release primary liquidity of about ₹2.5 lakh crore into the banking system by December 2025. Besides providing durable liquidity, it will reduce the cost of funds for banks, thereby facilitating monetary policy transmission to the credit market.  Money Market In the overnight money market, rates have reflected the evolving liquidity conditions. The weighted average call rate (WACR) – the operating target of monetary policy – moderated further and hovered near the floor of the LAF corridor. The spread of WACR over the policy repo rate averaged (-) 20 bps during the period May 16 to June 20, 2025, as against (-) 14 bps during the period April 16 to May 15, 2025 (Chart IV.2a). Overnight rates in the collateralised segments, the triparty repo and market repo, moved in tandem with the WACR. The comfortable liquidity surplus in the banking system has reinforced transmission of policy repo rate cuts to the term money market segments. Yields on three-month treasury bills (T-bills), certificates of deposit (CDs), and three-month commercial papers (CPs) issued by non-banking financial companies (NBFCs) moderated during the period May 16 to June 20, 2025, as compared to the period April 16 to May 15, 2025 (Chart IV.2b). The average risk premium in the money market – measured by the spread between the three-month CP and 91-day T-bill yields – narrowed to 79 bps during this period from 85 bps in the preceding period, indicating improved funding conditions and lower credit risk in the short-term market. Government Securities (G-Sec) Market In the fixed income segment, bond yields traded with a softening bias relative to the preceding month, on account of lower-than-expected CPI inflation prints and RBI’s OMOs. The yield on the 10-year G-sec benchmark declined to 6.25 per cent on June 5, 2025 from 6.27 per cent on May 15, 2025. Since then, however, it has edged up and was placed at 6.38 per cent on June 20, 2025 (Chart IV.3a). In comparison to a month ago, the domestic yield curve shifted downwards across the short end of the term structure, while it shifted upwards at the long end (Chart IV.3b). Between May 16 and June 20, 2025, the average term spread (10-year G-sec yield minus 91-day T-bills yield) increased by 29 bps over the period April 16 to May 15, 2025, indicating a steepening of the yield curve.   Corporate Bond Market Corporate bond issuances remained high at ₹0.93 lakh crore in April 2025, nearly three times the funds raised in April 2024. The sharp fall in bond yields amidst a slow pass-through to lending rates has prompted corporates to increasingly take recourse to the bond market for mobilizing resources. Corporate bond yields and the corresponding risk premia (except for AAA one-year) generally softened across tenors and rating spectrums during the period May 16 - June 19, 2025 (Table IV.1). Money and Credit Adjusting for the first-round impact of change in CRR, reserve money (RM) recorded a growth of 7.3 per cent (y-o-y) as on June 13, 2025 (8.1 per cent a year ago). During the current financial year, the growth in currency in circulation (CiC), the largest component of RM, was significantly higher at 7.3 per cent (y-o-y), as compared with 5.9 per cent a year ago (Chart IV.4). On the sources side (assets), growth in foreign currency assets accelerated to 5.6 per cent (y-o-y) as on June 13, 2025. Gold – the other major component of net foreign assets (NFA) – grew by 58.9 per cent, mainly due to increase in gold prices, leading to a steady rise in its share in NFA, from 8.3 per cent as of end-March 2024 to 12.7 per cent as of June 13, 2025. As on May 30, 2025, money supply (M3) rose by 9.5 per cent (y-o-y) [10.9 per cent a year ago].13  Scheduled commercial banks (SCBs) credit growth14 moderated to 9.9 per cent, as on May 30, 2025 (16.2 per cent a year ago) due to weaker momentum as well as unfavourable base effects (Chart IV.5a). SCBs’ deposit growth (excluding the impact of the merger) decelerated from 10.6 per cent, as on March 21, 2025 to 10.1 per cent, as on May 30, 2025, with the base and momentum effects offsetting each other (Chart IV.5b). Banks are increasingly relying on CDs to meet funding needs as competition intensified in the bulk deposit space.  Average bank credit growth to various sectors of the economy softened significantly during the period April 2024 to April 2025.15 Growth in non-food bank credit declined to 11.2 per cent during the fortnight ending April 18, 2025, from 15.3 per cent during the corresponding fortnight of the previous year.16 This was primarily driven by a moderation in growth of credit to services sector and agriculture and allied activities. Personal loans growth also showed deceleration over a year ago, though on a sequential basis, it witnessed an uptick after witnessing a softening in the last four months (Annex Chart A9). Deposit and Lending Rates The 50-bps cut in the policy repo rate during February-April 2025 reflected in banks’ repo-linked external benchmark-based lending rates (EBLRs) and marginal cost of funds-based lending rate (MCLR). Consequently, the weighted average lending rate (WALR) on fresh and outstanding rupee loans of SCBs declined by 6 bps and 17 bps, respectively, during the period February-April 2025 (Table IV.2). On the deposit side, the weighted average domestic term deposit rates (WADTDRs) on fresh and outstanding deposits moderated by 27 bps and 1 bp, respectively, during the same period. During the current easing cycle (February-April 2025), the decline in the WALR on fresh rupee loans was marginally higher for public sector banks (PSBs) as compared to private sector banks (PVBs). For outstanding loans, the transmission was higher for PVBs (Chart IV.6a). In case of deposits, PSBs reduced their fresh term deposit rates by a higher magnitude as compared to PVBs (Chart IV.6b). Equity Markets Indian equity markets remained range-bound in the second half of May amidst weak global cues, following the downgrade in US sovereign credit rating, caution on the possible India-US trade deal, and profit booking. Markets rose subsequently following the announcement of a record surplus transfer by the Reserve Bank to the government. Global tariff and geopolitical uncertainty imparted volatility thereafter; however, larger-than-expected policy rate easing by the Reserve Bank led to an upward swing in markets, boosting the banking and financial sector stocks. Markets turned volatile subsequently amidst geopolitical tensions in the Middle East. Overall, Indian equity markets registered modest gains during the period May-June (up to June 20, 2025), with the BSE Sensex increasing by 2.7 per cent to close at 82,408 (Chart IV.7). The broader market indices outperformed the benchmark, with the BSE Midcap and BSE Smallcap indices gaining by 6.1 per cent and 10.5 per cent, respectively, during May-June (up to June 20, 2025). ") 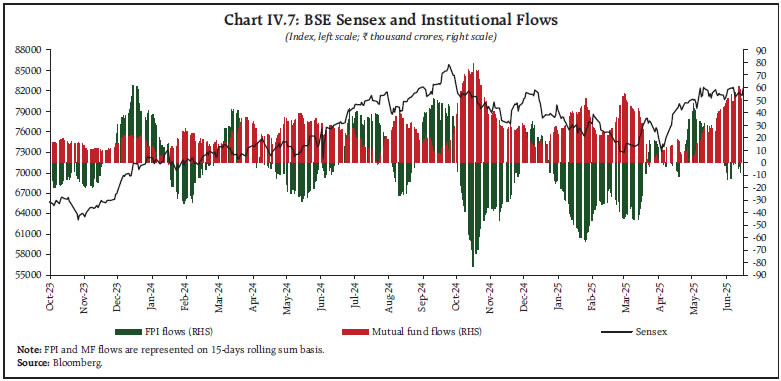  Foreign portfolio investors (FPIs) remained net buyers to the tune of ₹24,966 crore during May-June (up to June 20, 2025). Domestic institutional investors (DIIs), including mutual funds and insurance companies, also remained net buyers in the domestic equity markets to the tune of ₹1,24,429 crore during May-June (up to June 20, 2025). External Sources of Finance Gross inward foreign direct investment (FDI) amounted to US$8.8 billion in April 2025, higher than US$5.9 billion in March 2025 and US$7.2 billion in April 2024 (Chart IV.8a). Manufacturing and business services accounted for nearly half of the gross FDI inflows in this month. Net outward FDI also increased, along with a moderation in repatriation. Top sectors for outward FDI included electricity, gas and water, and financial, insurance and business services, while major destinations included Singapore, Mauritius, and Germany (Chart IV.8b). Together, these movements resulted in net FDI inflows of US$3.9 billion in April 2025, more than double the level in April 2024. Furthermore, India ranked 16th globally in FDI inflows and recorded US$114 billion in greenfield investment in digital economy sectors over the last five years (2020-2024), the highest among all countries in the Global South.17 Foreign portfolio investment (FPI) recorded net inflows of US$1.7 billion in May 2025, driven by the equity segment (Chart IV.9). Equities gained for the third consecutive month as the India-Pakistan ceasefire, the US-China trade truce, and better-than-expected corporate earnings results in Q4:2024-25 lifted investor sentiment and spurred portfolio rebalancing towards Indian assets. Telecommunication, services, and capital goods emerged as the top recipient sectors. The debt segment, which had experienced outflows in the previous month, observed a pause in net withdrawals in May, even as the yield differential between Indian and US government bonds remained below 2 per cent for most of the month.  External commercial borrowing (ECB) registrations slowed to US$2.9 billion during April 2025, down from US$11 billion in March 2025 and US$4.3 billion in April 2024. Despite the slowdown, inflows outpaced outflows, resulting in positive net flows of US$3.2 billion in April 2025 (Chart IV.10). Notably, 72 per cent of the total ECBs raised during April 2025 were intended for capital expenditure (capex), including on-lending and sub-lending for capex.  Foreign Exchange Market The Indian rupee (INR) appreciated by 0.4 per cent (m-o-m) vis-à-vis the US dollar and exhibited low volatility during May 2025 (Chart IV.11). Uncertainty surrounding the US trade and its fiscal policy contributed to a general strengthening of EME currencies vis-à-vis the US dollar.   In real effective terms, the INR appreciated (m-o-m) by 0.3 per cent in May 2025 as India’s inflation (on a m-o-m basis) was 0.9 percentage points higher than the weighted average inflation of its major trading partners, more than offsetting the depreciation in the nominal effective exchange rate (NEER) [Chart IV.12]. As on June 13, 2025, India’s foreign exchange reserves stood at US$699 billion, providing a cover for more than 11 months of goods imports,18 and for 97 per cent of external debt outstanding at end-December 2024 (Chart IV.13).  Protracted trade policy uncertainties and rising trade barriers pose the risk of significantly scarring the global economy. The intensifying geopolitical tensions too may further debilitate the already-weakened growth impulses. In this context, the trade policy outcomes in July, after the temporary tariff hiatus is over, and the future course of geo-political events would likely shape the medium-term economic prospects. Amidst a challenging global environment and heightened uncertainty, the Monetary Policy Committee (MPC) in its meeting held during June 4-6, 2025, decided by a majority vote (5-1) to reduce the policy repo rate by 50 bps to 5.50 per cent to stimulate domestic private consumption and investment. A likely undershoot of inflation to below the target rate, at the margin, during the current financial year and evidence of further anchoring of inflation expectations provided the MPC with the policy space to decisively focus on growth by frontloading the rate cut.19 The MPC also decided to change the stance from accommodative to neutral, considering the very limited space to further support growth in current circumstances after the cumulative 100 bps reduction in the policy repo rate since February 2025. Going forward, as noted by the MPC in its resolution, the MPC decided to remain data-dependent to chart the future course of monetary policy and strike the appropriate growth-inflation balance. Annex    ")        * This article has been prepared by Rekha Misra, Asish Thomas George, Shashi Kant, Shahbaaz Khan, Biswajeet Mohanty, Durga G, Yamini Jhamb, Harshita Keshan, Harendra Kumar Behera, Sanjana Sejwal, Satyarth Singh, Aayushi Khandelwal, Amrita Basu, Radhika Singh, Love Kumar Shandilya, Prashant Kumar, Sritama Ray, Shivam, Parul Arora, Ashish Santosh Khobragade, Ayushi Agarwal, Shreya Bhan, Shubham Agnihotri, Avnish Kumar, Supriyo Mondal, Yuvraj Kashyap, Amit Pawar, Rajas Saroy and Samridhi. The guidance and comments provided by Dr. Poonam Gupta, Deputy Governor, is gratefully acknowledged. Peer review by Pallavi Chavan, Snehal S Herwadkar, Joice John and Pawan Gopalakrishnan is also acknowledged. Views expressed in this article are those of the authors and do not represent the views of the Reserve Bank of India. 1 Reserve Bank of India’s Urban Consumer Confidence Survey (UCCS) and Rural Consumer Confidence Survey (RCCS) for May 2025 (Annex Chart A1 and A2). 2 Measured by the FAO’s Food Price Index. 3 The retail sales of two-wheelers in rural areas increased by 9.9 per cent as compared to 3.6 per cent in urban areas in May, 2025 (FADA press release). 4 https://www.mospi.gov.in/sites/default/files/press_release/Press_note_MB05_Monthly_bulletin%20-Final_1.pdf 5 https://economictimes.indiatimes.com/news/economy/finance/gst-collections-jump-16-4-to-rs-2-01-lk-cr-in-may/articleshow/121547915.cms?from=mdr 6 https://www.thehindu.com/business/Industry/spot-electricity-prices-declined-substantially-in-may-amid-reduced-demand-indian-energy-exchange/article69655753.ece 7 Data for Provisional Accounts (PA) pertain to 27 states/union territories (UTs). 8 As per the updated forecast by the Indian Meteorological Department (IMD) released on May 27, 2025, the southwest monsoon (SWM) rainfall is likely to be above normal this year at 106 per cent of the LPA. 9 The decadal average for the corresponding period is 22.9 per cent of full reservoir capacity. 10 Based on quarterly results of 2,936 listed non-government non-financial (NGNF) companies. 11 As per the provisional data released by the National Statistical Office (NSO) on June 12, 2025. 12 The positive momentum recorded in CPI Food, Fuel and Core was 10, 80 and 30 bps, respectively. 13 Excluding the impact of the merger of a non-bank with a bank (with effect from July 1, 2023). 14 Data are based on fortnightly Section 42 returns. Data exclude the impact of the merger of a non-bank with a bank. 15 Data are provisional. Sectoral non-food credit data is based on sector-wise and industry-wise bank credit (SIBC) return, which covers select banks accounting for about 95 per cent of total non-food credit extended by all SCBs, pertaining to the last reporting Friday of the month. Data exclude the impact of the merger of a non-bank with a bank. 16 For further details, refer to Sectoral Deployment of Bank Credit – April 2025 [https://www.rbi.org.in/Scripts/BS_PressReleaseDisplay.aspx?prid=60554] 17 World Investment Report, UNCTAD, 2025. 18 However, the import cover for goods and services was around nine months. 19 The MPC retained the real GDP growth projection for FY 2025-26 at 6.5 per cent. The headline CPI inflation projection for FY 2025-26 was revised downwards by 30 bps to 3.7 per cent. As per the survey of professional forecasters held in May 2025, headline CPI inflation is projected at 3.8 per cent for 2025-26 and at 4.2 per cent for 2026-27. The May 2025 round of the inflation expectations survey of households showed one-year ahead inflation expectations moderating by 20 bps. The May 2025 round of the rural consumer confidence survey also showed a moderation in the one year ahead inflation expectations by 40 bps (Annex Charts 10 and 11). |

इस पेज को शेयर करें:


आरबीआई मोबाइल एप्लीकेशन इंस्टॉल करें और लेटेस्ट न्यूज़ का तुरंत एक्सेस पाएं!
हमारा ऐप इंस्टॉल करने के लिए QR कोड स्कैन करें


पृष्ठ अंतिम बार अपडेट किया गया: नवंबर 23, 2022


