 IST,
IST,
Benchmarking India’s Payment Systems
The payments landscape across the world is developing at a rapid pace with various innovative payment systems and instruments being introduced on a frequent basis. This exercise of benchmarking India’s payment systems aims to assess the progress of India’s payments ecosystem against other major countries as also ascertain the strengths and shortcomings of the Indian payments ecosystem. The exercise also seeks to examine the user preferences for payment systems and instruments vis-a-vis other jurisdictions. Learnings from the exercise are expected to further facilitate improvements in the payments landscape in India. 2. The pilot exercise for benchmarking India’s payment systems was undertaken in 2019. The exercise was conducted for 21 countries, (including advanced economy countries, Asian economies and BRICS (Brazil, Russia, India, China and South Africa) nations), where payment systems were considered robust, diverse and efficient. The present exercise is a follow-on benchmarking exercise undertaken to examine the present relative position of the benchmarked countries and progress since publication of the last report. 3. Reserve Bank of India (RBI) has relied on publicly available information and made all reasonable efforts to ensure that the information in the report is accurate. However, any changes in data / information pertaining to jurisdictions covered in the exercise, after the finalisation of the report, may not be reflected herein. 4. For each indicator, rating has been done considering countries for which data was available and only India has been rated. The rating categories are as follows:
5. The benchmarking has been carried out over a range of 20 areas and 40 indicators as indicated below. A snapshot of India’s position, details of which are in the report, is as follows:
6. A comparison of India’s performance across the rating categories in the current exercise vis-à-vis the last exercise is given below:
1.1 The payments ecosystem in India has witnessed rapid development with the availability of multiple payment systems and platforms, payment products and services for different categories of consumers – individuals, firms, corporates, government and other economic agents alike. The payments landscape has expanded with the launch and acceptance of new modes of payment in the retail payment segment, which include (a) mobile phones as a channel for making and receiving payments (mobile payments), (b) internet for making purchases over different types of devices (internet payments), (c) payment cards in ATM / PoS including using contactless technology (card payments and tokenisation), and (d) various systems and platforms for making instant payments and electronic billing. Over the years, payment system features, viz. availability, repetitive payments, contactless payments, offline payments, tokenisation, etc., have been enriched to enhance customer convenience while maintaining confidence in payment systems by ensuring requisite safety, security and efficiency measures. 1.2 The benchmarking exercise compares the payments ecosystem in India vis-à-vis other jurisdictions to ascertain the position of the payments landscape in India and examine how it fares when compared with other countries. In this context, benchmarking of India’s payment systems was initiated in 2019 and this follow-on exercise is being undertaken to measure the progress since the initial exercise and examine the recent trends in payments, both in India and the world. 2.1 RBI published a report in 2019 on “Benchmarking India’s Payment Systems”, which compared the payments ecosystem in India relative to comparable payment systems and usage trends in other major countries. The exercise covered 21 countries, (including advanced economy countries, Asian economies and BRICS nations) spread across all the continents, where payment systems were considered robust, diverse and efficient. The comparison was undertaken for the year 2017 with CAGR for relevant indicators considered over a period of 5 years from 2012 to 2017. 2.2 The analysis covered 41 indicators over 21 broad areas including regulation, oversight, individual payment system categories, payment instruments, payment infrastructure, utility payments, government payments, customer protection and grievance redressal, securities settlement and clearing systems and cross-border personal remittances. 2.3 The exercise provided an understanding of the relative position of systems in India for making and receiving payments and how their usage preferences compare with other countries. It was also a starting point for a meaningful analysis of the efficiency levels of India’s payment systems. 3.1 This is a follow-on benchmarking exercise and aims to measure India’s standing vis-à-vis twenty other countries, as well as the progress since the last exercise, across payment systems and payment instruments. The exercise seeks to provide insights about user preferences and identify strengths and shortcomings of India’s payments ecosystem relative to comparable payment systems in other countries. It, therefore, seeks to (a) arrive at an understanding of the preferences Indians have for making and receiving payments and how these preferences compare with other countries, (b) assess the efficiency of India’s payment systems, and (c) measure the progress in the parameters since the last exercise. 3.2 The data used for the exercise is for the year 2020 with CAGR for relevant indicators considered over the three-year period since the last benchmarking exercise, viz. from 2017 to 2020. (Although the data for 2021 is available for India, the same is not available in public domain for other jurisdictions). 3.3 A few of the parameters included in the last exercise are based on publications for which, subsequent editions have not been released. Every attempt has been made to retain the parameters as used in the previous exercise using other available data points. However, in cases where data points are not available, the parameters have been excluded from the present benchmarking exercise. 3.4 India has also started publishing a Digital Payments Index (DPI) to effectively capture the extent of digitisation of payments in the country. The DPI is based on multiple parameters and measures the penetration and deepening of various digital payment modes. While DPI is used to measure the deepening of digital payments across the country, benchmarking facilitates a meaningful comparison with other jurisdictions. 4.1 The data sources considered for the benchmarking exercise are as follows: (a) BIS Red Book ‘country tables’ compiled by the Bank for International Settlements1 (BIS) for the years ended 2017 and 2020 (b) Worldpay Global Payments Report 20222 (c) RBI data (d) World Bank Fast Payments Toolkit3 (e) Global Findex Survey, 2017 conducted for World Bank4 (f) World Bank – World Development Indicators5 (g) Advancing Public Transport Report on Demystifying Ticketing and Payment in Public Transport – November 20206 (h) FSB Stage 1 Report on Enhancing cross-border payment arrangements7 (i) FSB Consultative Report on Targets for Addressing the Four Challenges of Cross-border Payments8 (j) ACI Worldwide – Prime Time for Real-Time Global Payments Report 20229 (k) Websites of Central Banks, Ombudsman, etc., of other benchmarked countries10 (l) Interchange Fees in Various Countries: Developments and Determinants (Stuart E. Weiner and Julian Wright)11 (m) Report of the Working Group on Innovations in retail payments 201212 (n) The Global Knowledge Partnership on Migration and Development (KNOMAD) – Remittances data13 4.2 RBI has relied on publicly available information and made all reasonable efforts to ensure that the information in the report is accurate. Further, any changes in data / information pertaining to jurisdictions covered in the exercise, after the finalisation of the report, may not be reflected herein. 5. Countries selected for benchmarking 5.1 The countries included in this exercise are the same as those selected for the 2019 exercise to ensure consistency. Like the last exercise, the countries include a mix of advanced economies, Asian economies and all the BRICS nations viz. Australia, Brazil, Canada, China, France, Germany, Hong Kong, Indonesia, Italy, Japan, Mexico, Russia, Saudi Arabia, Singapore, South Africa, South Korea, Sweden, Turkey, United Kingdom and the United States of America. European Central Bank (ECB) has been included for the indicators on “Regulation” and “Oversight”. These countries have been chosen not only because they are spread across all continents but also because payment systems in these countries are considered to be robust, diverse and efficient. Further, most of the countries are at the upper end of the income spectrum in terms of World Bank socio-economic indicators. 6.1 The benchmarking has been done for indicators ranging from regulation of payment systems to payment instruments and infrastructure. For ranking a particular indicator, only those countries have been considered for which data is available for the respective indicator. For each indicator, the rationale for rating, along with the practices followed by leaders, is provided at Annex. The rating 14categories are on similar lines as the rating in the last exercise:
6.2 The rating for an indicator is given without accounting for the correlation with other indicators, if any. The purpose of assigning a ‘rating’ for a parameter / indicator is limited to providing a scale, for understanding India’s relative position amongst the countries covered under this exercise. Further, for some parameters, the relative position and rating thereof indicate consumer preferences (share of different payment categories, cash withdrawals from ATM, etc.) in the benchmarked countries. The parameters / areas for which a jurisdiction may like to initiate action to improve its relative position, would be driven by the strengths and shortcomings of their payments ecosystem, consumer preferences, geo-political realities, etc. Thus, a relatively low ranking in a particular parameter may not be a reason by itself for initiating action. 7.1 The benchmarking exercise compared various aspects of the payments landscape in India with that of other countries and provided insights on consumer preferences for payment instruments / systems vis-à-vis other countries. The selection of parameters was constrained by non-availability of data for certain parameters across jurisdictions since certain initiatives / products / systems may be key for a jurisdiction but may not be implemented across all jurisdictions e.g., use of Quick Response (QR) codes. The exercise captured some of the developments since 2019 and helped highlight areas where India was strong and identify areas where further initiatives / developments were desirable. The key findings from the exercise are summarised below:
Way Forward 7.2 India has an efficient payments ecosystem that has been strengthened by operationalising the CPS, comprising RTGS and NEFT, round the clock. RTGS 24x7 has laid the foundation for extension of market hours, which would enhance efficiency of Indian markets and increase payment transactions. Further, expanding the scope of RTGS, to settle transactions in major trade currencies such as USD, Euro, Pound, etc., could be explored to facilitate processing of foreign currency transactions and establish India as a major centre for international financial trades. 7.3 With global focus on enhancing cross-border payment arrangements, it is essential that India explores further actions in this arena, which would further its relative position and remove frictions in such transactions. These measures could include, building on the UPI-PayNow interface and exploring avenues for interlinking UPI with fast payment systems in other jurisdictions, enhancing / reviewing the prescribed limits for inward remittances using the Money Transfer Service Scheme (MTSS) to improve customer convenience, adopting differential screening requirements for foreign inward remittances in line with the risk-based regime provided in the Financial Action Task Force (FATF) framework, etc. While enhancing cross-border transactions is a focus area, it is essential to ensure safety and security of such transactions. The Additional Factor of Authentication (AFA) mandated for online card transactions in India has reduced payment frauds and enhanced confidence of customers in card transactions. With the evolution of technology and rise in cross-border payments, the possibility of extending AFA requirement to cross-border card transactions undertaken using cards issued in India may be explored. 7.4 From a domestic perspective, the robust payments infrastructure has facilitated considerable growth in Indian economy. The time is opportune to leverage these learnings at a global level. Internationalisation of Indian Rupee will facilitate greater degree of integration of Indian economy with rest of the world, in terms of foreign trade and international capital flows. Along with other global outreach initiatives, this will also help bring down cost of cross-border transactions, including remittances, and help in rapid acceptance of Indian Rupee. The inclusion of Indian Rupee as a currency in Continuous Linked Settlement (CLS) could be a step in this direction. The CPSs could also be extended to SAARC member countries to facilitate trade invoicing and settlement in Indian Rupee. Opening of current accounts, both by other central banks with RBI and by RBI with other central banks, to faciliate faster settlements could be another aspect for consideration. 8. Benchmarking exercise summary
Glossary
Benchmarking assessment 1. Laws in place and scope of regulation 1.1 Key insight: The Reserve Bank’s scope of regulation extends to the whole gamut of payment systems and instruments as also services provided by banks and non-banks. India is one of the few countries that has a designated law on payment systems. In order to maintain public confidence in the payment systems, entry and exit of operators is regulated in India, unlike certain other jurisdictions. 1.2 Benchmark rating: Strong 1.3 Analysis: A sound and appropriate legal framework is generally considered the basis for an efficient payment system. In India, considering the importance of regulation for the development and orderly functioning of payment systems, the PSS Act was legislated in 2007. The legal basis for regulation of payment systems emanates from Section 3 of the PSS Act, which states that RBI shall be the designated authority for the regulation and supervision of payment systems under this Act. In RBI, a sub-committee of its Central Board is responsible for the general superintendence of the regulation, reflecting the importance accorded to the task. Proactive regulation with safety and customer centric initiatives have been the hallmark of developments in retail payment systems. The activities undertaken by payment aggregators have also been included under the regulatory purview with existing payment aggregators being required to apply for authorisation by September 2021. Payment gateways that provide technology infrastructure and facilitate processing of online payment transactions without handling funds have been issued recommendations for baseline technology and do not require authorisation from the regulator. In recent years, to reduce licensing uncertainties and facilitate long term strategic planning by PSOs, RBI is authorising entities on a perpetual basis, subject to certain conditions. Further, to inculcate discipline and encourage submission of applications by serious players only, the concept of cooling period was introduced where an entity cannot apply for authorisation within one year from the date of revocation / non-renewal / acceptance of voluntary surrender / rejection of application.
2. Regulation of costs of payment systems 2.1 Key insight: Processing charges have been waived by RBI on the payment systems it operates, viz. RTGS and NEFT. In addition, with effect from January 1, 2020 banks were directed not to levy any charges on NEFT funds transfers initiated online by their savings bank account holders. Further, with effect from January 1, 2020, the Government has directed that MDR shall not be collected for transactions put through UPI and RuPay debit cards. Currently, for businesses with annual turnover of ₹2 million or more, the MDR for debit cards (other than RuPay) is capped at 0.9% of the transaction value or ₹1,000, whichever is lower. 2.2 Benchmark rating: Leader 2.3 Analysis: While cash is perceived to be ‘free’ by the consumers, it has significant social costs as also the costs of printing, distributing and maintaining currency, which are borne by RBI. RBI has been regulating the cost of payment systems for the end consumers to ensure the availability of e-payments at low costs. Reduction in transaction cost for participants in the ecosystem would serve as a catalyst to onboard additional merchants on to the digital payments’ platform. Regulation of the costs of payment systems requires a fine balance. High costs will discourage consumers / merchants from shifting to digital payments, while low costs may not be remunerative and would discourage investments. RBI’s endeavour is to make the payments space a large-volume, low-average-value and low-cost game for sustained presence and continuance.
3. Currency in Circulation (CIC) per capita 3.1 Key insight: The CIC per capita in India increased from USD 218 in 2017 to USD 288 in 2020. However, CIC per capita in India continues to be considerably lower than most of the countries included in the benchmarking exercise. The CIC per capita is observed to vary significantly among the advanced economies and emerging economies. 3.2 Benchmark rating: Leader 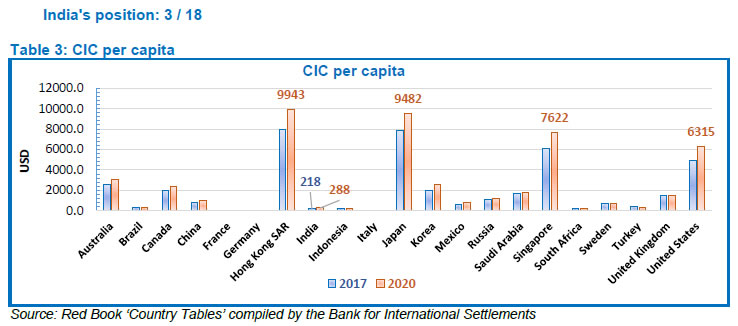 3.3 Analysis: CIC per capita provides an indication of the use of cash and hence low levels of CIC per capita imply migration to digital payment modes. However, CIC per capita could also reflect income levels per capita in a country, which is demonstrated by the significant variation in levels of CIC per capita in advanced economies as compared to emerging market economies. CIC per capita is observed to have increased in most of the countries (except Brazil, South Africa, Sweden, and Turkey) in 2020 when compared to 2017. The increase in CIC per capita in 2020 could be attributed to the holding of cash by individuals due to the uncertainties being experienced during the challenging times of the CoVID pandemic. High level of CIC does not necessarily indicate the usage of cash for payment transactions, and it can represent the use of currency as a store of value. This is demonstrated by the robust demand observed for higher value denomination of currency across jurisdictions, as depicted in table below. 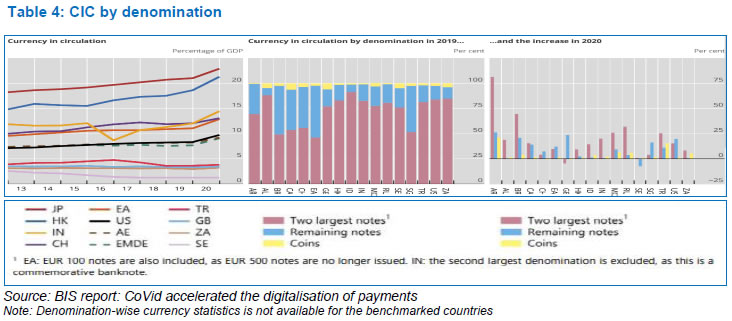 4.1 Key insight: The CIC as percent of GDP is observed to be the third highest for India out of the countries included in the benchmarking exercise. CIC in India increased to 14.4% of GDP in 2020 from 10.7% of GDP in 2017, consistent with the trend observed across jurisdictions. Only China and Turkey witnessed a decline in the CIC as percent of GDP in 2020 as compared to 2017. 4.2 Benchmark rating: Weak 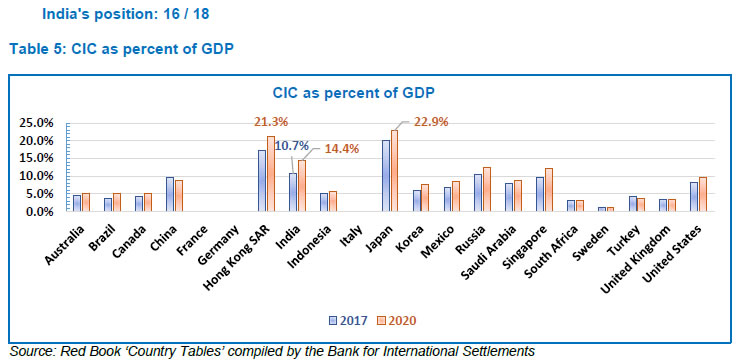 4.3 Analysis: Demand for currency depends upon several macro-economic factors including economic growth, interest rate level and demographic profile of the country. The ratio of CIC as percent of GDP provides an indicator of the dependence of cash in an economy. Cash is, however, used both as a means of payment and store of value. The usage of currency as a store of value gained further significance during the challenging times of the CoVID pandemic. With the onset of CoVID pandemic, there was a dash for cash across all jurisdictions. Lockdowns were severe in India, as a result of which economic activity slowed down and there was contraction in GDP, relative to other countries. The decline in GDP (denominator) contributed considerably to increase in CIC as percent of GDP for India in 2020. Among the benchmarked countries, only Hong Kong (21.3%) and Japan (22.9%) had a higher ratio of CIC as a percentage of GDP as compared to India. A low crime rate, years of ultra-low interest rates and a nationwide network of ATMs have made cash appealing in Japan, giving people few reasons to shift to other modes of payments C. Payment systems transactions 5. Payment systems transactions volume and growth 5.1 Key insight: The volume of payment systems transactions in India grew strongly at a CAGR of 21% between 2017 and 2020, indicating rapid adoption of non-cash payment modes. The CAGR observed in India was second highest amongst countries included in the benchmarking exercise, behind only Saudi Arabia (26%). 5.2 Benchmark rating: Volume – Strong; CAGR – Leader 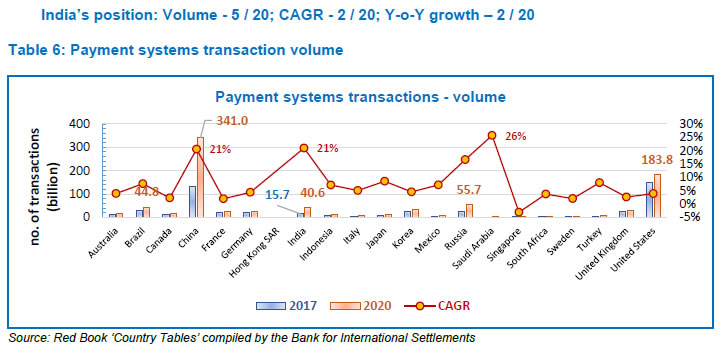 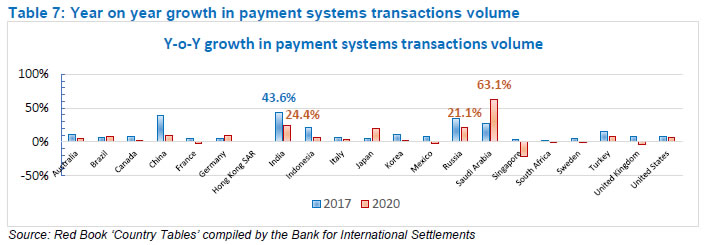 5.3 Analysis: The volume of payment systems transactions provides an indication of the adoption of non-cash payments and movement away from cash. Further, the year-on-year growth provides an indication of the pace of movement to non-cash payment systems transactions. India’s push towards its vision of Digital India combined with the efforts of RBI towards ‘Empowering Exceptional (E)payment Experience’, has led to a rapid adoption and deepening of digital payments in the last few years. The number of cash-less payments has grown rapidly, to over 40 billion transactions in 2020, with a CAGR of 21% between 2017 and 2020. Payment systems transactions in India grew by 24.4% in 2020 over the previous year. Amongst the benchmarked countries, only Saudi Arabia demonstrated a higher year-on-year growth of 63% in 2020. In the journey of migrating from cash to other modes of payment, the year-on-year growth in payment transactions across jurisdictions tends to moderate once significant population has embraced payment systems transactions. In terms of the number of payment systems transactions, Brazil (45 billion), China (341 billion), Russia (56 billion) and United States (184 billion) witnessed higher number of transactions than India in 2020. China’s progress in non-cash payments in recent years has been propelled by Alibaba’s Alipay and Tencent’s WeChat Pay. 6. Value of payment systems transactions to CIC 6.1 Key insight: The value of payment systems transactions to CIC was one of the lowest in India (44.9) in 2020 as compared to other countries included in the benchmarking exercise. Indonesia, South Africa, Turkey and United Kingdom are the few countries that witnessed a growth in the ratio from 2017 to 2020. 6.2 Benchmark rating: Weak 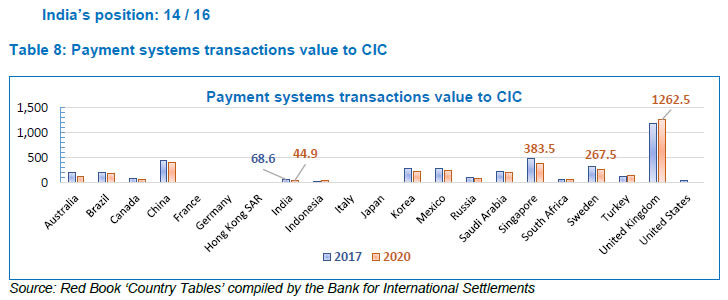 6.3 Analysis: A higher ratio of value of transactions processed by payment systems to CIC tends to indicate migration of an economy from using cash to payment systems. India stands at 14th position in the benchmarked countries with the total value of payment systems transactions to CIC standing at 44.9 in 2020. United Kingdom is the leader with a ratio of 1262.5 in 2020, followed by China and Singapore with 414.7 and 383.5, respectively. In India, retail payment systems drive the volume of payment transactions and the large value system, viz. RTGS, takes the major share in terms of value. RTGS also facilitates customer transactions whose individual transaction value is comparable to other retail payment systems; hence, these transactions have been considered as retail payments. The ratio is low for India as retail payments primarily comprise large volume and low value transactions. 7.1 Key insight: In India, the volume of cheque payments in 2020 (708 million) was high, as compared to other countries. Cheque-based payment transactions in India declined at a CAGR of 15.4% from 2017 to 2020. 7.2 Benchmark rating: Moderate 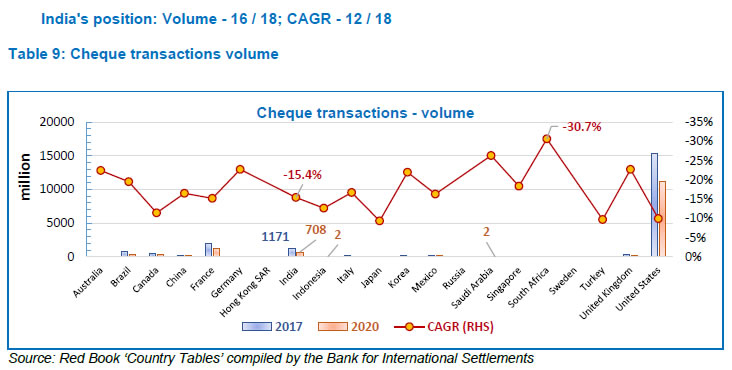 7.3 Analysis: With migration to digital payments, volume of paper-based transactions is declining across jurisdictions. Majority of the benchmarked countries are close to eliminating the use of cheques, with Australia, Germany, Korea, Saudi Arabia, South Africa and the United Kingdom most successful in reducing usage of cheques. In 2020, volume of cheque payments in India was 708 million. In advanced economies, even though volume of cheque payments is low, value of transactions involving cheques is significantly high. Cheques are mostly used for high value transactions including government payments in these countries. Further, in France and USA, people in general have a strong preference towards paper instruments, especially for high value payments and hence usage of cheques is still widespread. 8. Share of cheques in payment systems (volume) 8.1 Key insight: The share of cheque payments in total payment systems transactions in India has reduced to 1.7% in 2020 from 7.5% in 2017. 8.2 Benchmark rating: Weak 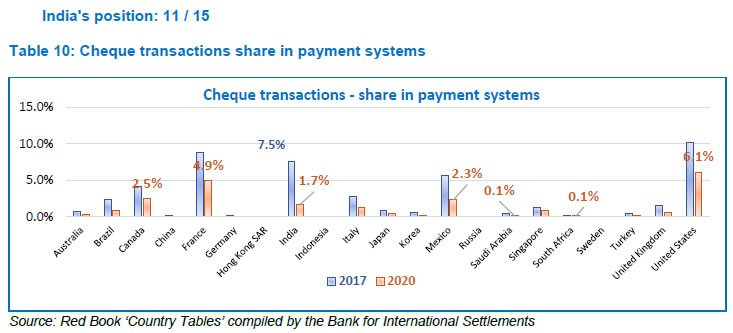 8.3 Analysis: The reducing share of cheque transactions in the overall payment transactions indicates the adoption of digital payments and migration from paper to digital forms of payments. Although the share of cheque payments in India demonstrated significant reduction and cheques comprised only 1.7% of total payment transactions in 2020, the share of cheques was observed to be high when compared with other countries covered in the benchmarking exercise, except for Canada (2.5%), France (4.9%), Mexico (2.3%) and United States (6.1%). Germany, Saudi Arabia and South Africa are some of the countries that are close to eliminating cheques as a mode of payment. 9.1 Key insight: In 2021, India brought all bank branches under the image-based CTS clearing mechanism ensuring T+1 settlement for all instruments across the country. Further, to provide additional security, a mechanism of positive pay was made available for all high value cheques, i.e., above ₹ 50,000. 9.2 Benchmark rating: Leader 9.3 Analysis: Globally, most of the countries have a cheque clearing house in place which may entail significant involvement of the central bank as the clearing house operator. Further, cheques are standardised in majority of the jurisdictions with automated cheque processing in place. In India, cheque standard "CTS-2010" prescribes certain mandatory features such as quality of paper, watermark, bank’s logo in invisible ink, void pantograph, etc., and standardisation of field placements on cheques. In addition, certain desirable features have also been suggested for implementation by banks based on their need and risk perception. The implementation of pan-India CTS has enhanced operational efficiency in paper-based clearing and made the process of collection and settlement of cheques faster resulting in better customer service. The implementation of risk management practices for cheque processing in countries across the world is still relatively weak. However, the use of cheques is still prevalent for high value transactions in various jurisdictions. To further augment customer safety in high value cheque payments and reduce instances of fraud occurring on account of tampering of cheque leaves, India introduced the concept of positive pay in 2021, which involved a process of reconfirming key details of large value cheques. Under the positive pay mechanism, the issuer of the cheque is required to submit electronically (through SMS, mobile app, internet banking, ATM, etc.) certain minimum details of the cheque (date, name of the beneficiary / payee, amount, etc.) to the drawee bank, which are cross-checked with the presented cheque by CTS. 10. Number of debit and credit cards issued 10.1 Key insight: India, with 886 million debit cards at the end of 2020, was behind only China (8178 million) in terms of number of debit cards issued. In terms of number of credit cards issued, India with 60.4 million credit cards, was behind Brazil, Canada, China, Korea, Turkey and USA. 10.2 Benchmark rating: Debit cards issued – Leader ; Credit cards issued – Strong 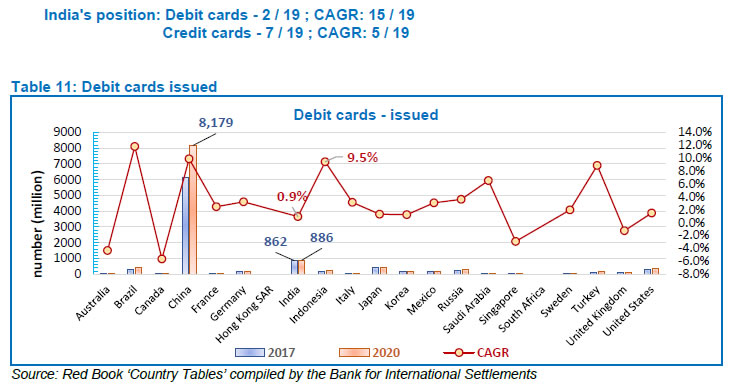 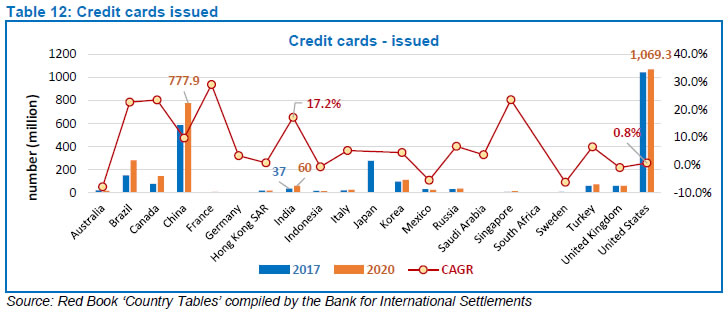 10.3 Analysis: The number of credit and debit cards issued in a jurisdiction provide an indication of the adoption of card payments. China is the leader in debit cards issuance followed by India with 8.1 billion and 0.88 billion debit cards issued, respectively, as at the end of 2020. In India, the debit cards and credit cards issued increased to 0.92 billion and 73.6 million respectively, as at end March 2022. India recorded a CAGR of 1% in debit card issuance between 2017 and 2020, despite 150 million debit cards going out of the market due to the planned migration from magnetic strip cards to EMV chip and PIN based cards in 2019. In terms of credit card issuance, India demonstrated a strong CAGR of 17.2% between 2017 and 2020. The growth in credit cards can be attributed to innovative products, co-branded partnerships (such as those of non-bank financial companies (NBFCs) / Fintech Companies with banks), e-commerce, cashback programs and technology. The increase in number of credit cards is also an indication of the expansion of retail borrowers in the ecosystem. In absolute terms, however, the number of credit cards in India are significantly low as compared to China (778 million) and United States (1069 million) as at end December 2020. 11. Share of debit and credit card payments in payment systems (volume) 11.1 Key insight: In 2020, the share of card payments in total payment systems transactions was the second lowest in India (14.7%), with only Indonesia witnessing a lower share (7.2%). Further, in 2020 India was one of the few countries along with Indonesia, Korea, Sweden, Turkey and United Kingdom to witness a decline in share of card payments as compared to 2017. 11.2 Benchmark rating: Weak 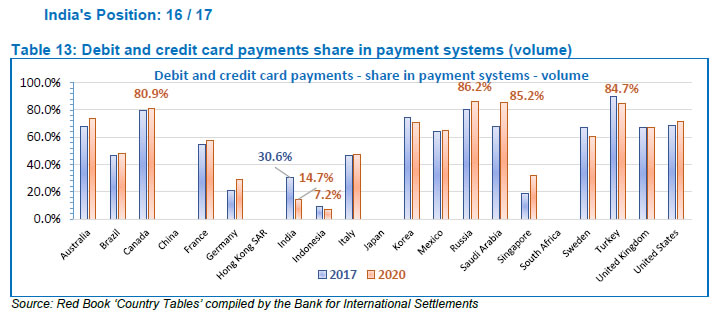 11.3 Analysis: A high share of card payments indicates adoption of credit cards and debit cards as preferred modes of payments. Among the benchmarked countries, card payments dominated payment systems transactions in Canada, Russia, Saudi Arabia and Turkey in volume terms in 2020. The share of card transactions in overall payment systems transactions in India decreased from 30.6% in 2017 to 14.7% in 2020. The decline in share of card transactions in 2020 can be attributed to, (a) the presence of ubiquitous, interoperable systems facilitating immediate payments such as UPI; and (b) lesser use of cards at PoS terminals due to the restrictions in place on account of the CoVID pandemic. 12. Points of Sale (PoS) terminals deployed 12.1 Key insight: The number of PoS terminals available in India (4.6 million) as at the end of 2020 was higher than the countries considered in the benchmarking exercise with the exception of Brazil (13.4 million) and China (38.3 million) 12.2 Benchmark rating: Leader 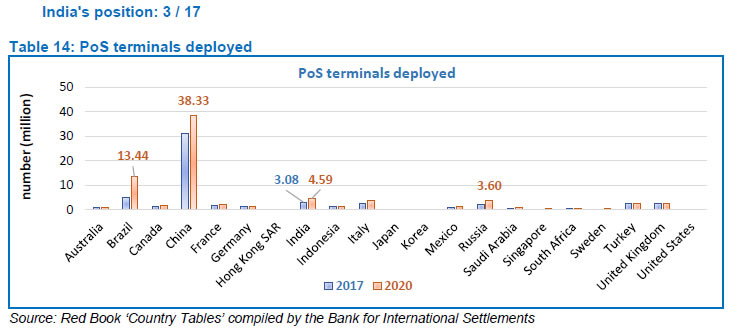 12.3 Analysis: The availability of payment acceptance infrastructure, such as PoS terminals, is essential to facilitate migration to digital payments using credit cards, debit cards and prepaid cards. The number of PoS terminals in India increased from 3.08 million in 2017 to 4.59 million in 2020 and has grown at a CAGR of 14%. The cards segment in India has also seen mobility from physical PoS to virtual / digital PoS with the evolution of standardised Bharat QR, used to facilitate merchant payments. Customers can directly scan the Bharat QR code deployed by the merchant to initiate card payments. 13.1 Key insight: India has made significant progress in terms of the absolute number of PoS terminals deployed at the end of 2020. However, in terms of people per PoS terminal deployed, there is scope for improvement with one PoS terminal catering to 296 people as at end 2020. 13.2 Benchmark rating: Weak 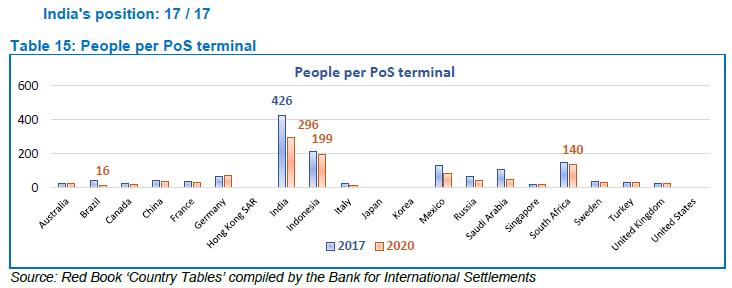 13.3 Analysis: The availability of payment acceptance infrastructure across the country can be measured by considering the people catered to by a single PoS terminal. In order to ensure deepening of digital payments, it is essential to increase the density of acceptance infrastructure across the country. The number of persons served by a PoS terminal improved from 426 people per PoS terminal in 2017 to 296 people per PoS terminal in 2020. However, the figure is still highest amongst the benchmarked countries. To address the supply side issues in acceptance infrastructure and provide fillip to deployment of PoS terminals in the country, RBI operationalised the PIDF in January 2021 with emphasis on enhancing acceptance infrastructure in rural areas. As at end March 2022, 9.1 million and 0.39 million digital and physical payment acceptance devices, respectively, were deployed under the PIDF scheme. Brazil is one of the developing countries with low people per PoS terminal (16). In Brazil, high mobile penetration and large number of SMEs and micro businesses have paved the way for widespread use of mobile PoS / Smart PoS across the country. 14. Debit and credit card payments 14.1 Key insight: The debit card and credit card payments in India have grown at a respectable rate from 2017 to 2020 with a CAGR of 7.3% and 8.5%, respectively. However, in absolute terms, the volume of debit and credit card payments in India in 2020 was considerably low as compared to other countries. 14.2 Benchmark rating: Moderate 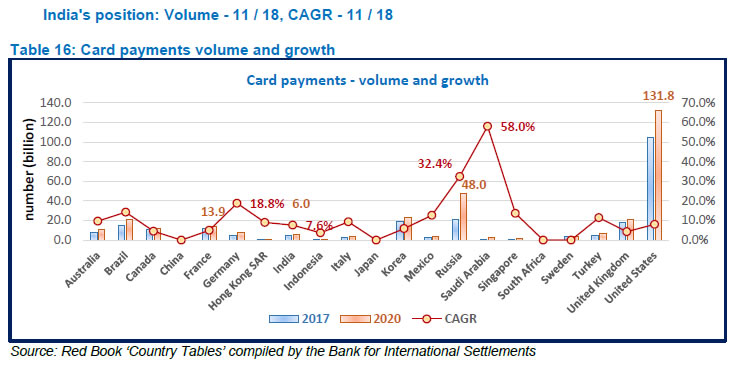 14.3 Analysis: High volume of card payments indicates adoption of cards as the preferred means of making payments. Volume of card payments in India increased at a CAGR of 7.6% from 4.8 billion transactions in 2017 to 5.98 billion transactions in 2020. However, in absolute terms, the card payment transactions in India remains significantly lower than countries like Brazil, Korea, Russia, United Kingdom and United States of America. Saudi Arabia and Russia have witnessed the highest growth of 58% and 32%, respectively, in card payments during the period from 2017 to 2020. The card payments in Saudi Arabia are majorly driven by issuance of sharia compliant Islamic cards and increasing e-commerce industry coupled with increasing income levels and urbanisation, leading to changes in consumer preferences and increased consumer spending. In Russia, government initiatives such as regulations to cap cash payments and the introduction of the National Payment Card System (NPCS) are instrumental in the rise in card payments. This growth is underpinned by increase in banked population, consumer awareness about the benefits of cards and improved acceptance infrastructure. On the other hand, the fear of fraud, fees / charges paid by small establishments while accepting cards may be some of the reasons inhibiting increase in card payments in some jurisdictions. F. Cash vs debit and credit cards 15. Debit and credit card payments vs CIC 15.1 Key insight: The value of card payments to CIC for India, at 0.4, was the lowest amongst the benchmarked countries, indicating a lower preference for using debit and credit cards. 15.2 Benchmark rating: Weak 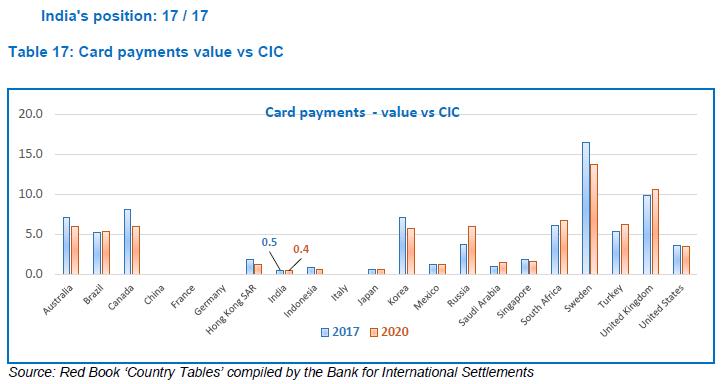 15.3 Analysis: India, Indonesia, and Japan are the countries where the ratio of card payments to CIC was observed to be less than 1. This could be because in India and Indonesia, the volume of card payments is observed to be considerably low, indicating lower preference for cards in payment transactions, which is likely to result in lower value of card payments. In Japan, although alternate payment systems are available, the usage of cash is substantially high. The trends in Indian payment systems indicate that Indians prefer alternate forms of payments as compared to credit and debit cards. G. Cash and Automated Teller Machines (ATMs) 16.3 Key insight: As at the end of 2020, India was next to only China and Russia in terms of the number of ATMs deployed. However, over the period from 2017 to 2020, the ATMs deployed in India increased at a CAGR of 2% as compared to 17% in Russia. 16.2 Benchmark rating: Leader 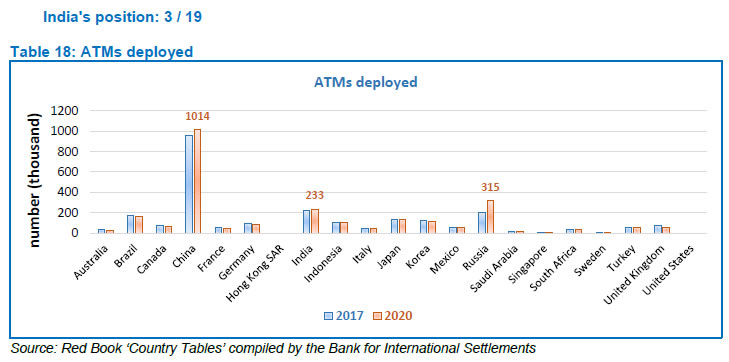 16.3 Analysis: ATMs primarily form a part of the cash infrastructure. However, they are increasingly being used to conduct other activities like card to card transfers, bill payments, etc., obviating the need to visit a bank branch and thereby acting as a means of undertaking ‘digital transactions’ albeit at a restricted scale. In India, authorised non-bank entities are also permitted to deploy ATMs, known as White Label ATMs to support proliferation of ATM infrastructure across the country. As at the end of 2020, 233 thousand ATMs were deployed across India, with approximately 11 thousand new ATMs deployed between 2017 and 2020. This is significantly lower than the 53 thousand and 116 thousand new ATMs deployed by China and Russia, respectively, during the same period. In India, account holders in rural areas often withdraw cash from PoS terminals with Business Correspondents (BCs) and merchants in their neighborhood, which act as “micro-ATMs”. These BCs use AePS, which allows online interoperable transactions at micro-ATMs using Aadhaar based authentication. As at end December 2020, there were close to 356 thousand micro-ATMs deployed in India. In China, customer demand was the main driver of growth in ATMs and the government encourages the deployment of ATMs provision as they attract new cardholders. Further, China has also deployed Interactive Teller Machines (ITM) wherein a video facilitates user interaction with a teller on a screen. ITMs provide convenience for customers similar to an in-branch experience but through a digital screen. 17.1 Key insight: India has the third largest number of ATMs deployed in absolute terms amongst the benchmarked countries. However, it fares poorly when we measure the reach of ATMs; with a single ATM catering to over 5800 people as at end 2020. 17.2 Benchmark rating: Weak 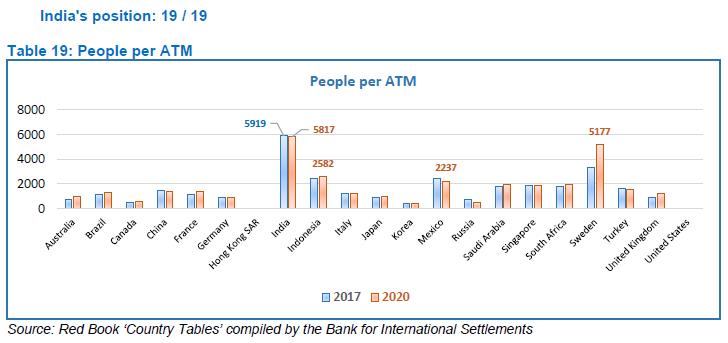 17.3 Analysis: The ATM density, i.e., people per ATM is an important indicator representing the availability of ATMs across the country. A high number of people per ATM indicates that the existing ATM infrastructure may not be able to cater to the demands of the population. The ATM density in India has reduced marginally from 5919 in 2017 to 5817 in 2020 and India stands at the bottom when compared with other benchmarked countries. The ATM infrastructure is supplemented by micro-ATMs, which are primarily available to the rural / unbanked population and play a crucial role in facilitating financial inclusion in India. In Sweden, a bellwether of developments in payment systems, cash demand has fallen for the better part of the last decade. Consumers and retailers have been embracing electronic means for payments, and merchants are increasingly reluctant to accept paper money. The number of ATMs deployed are observed to have declined over the years. Hence, a high number of people per ATM may not always be a cause for concern. 18. Cash withdrawal at ATMs per capita 18.1 Key insight: The cash withdrawals undertaken per person in India in 2020 was 5, which was the lowest amongst the benchmarked countries. This has fallen from 7 cash withdrawals per person in 2017. While this ratio normally indicates lower cash dependency, the reason for a low ratio may be more due to a large population (denominator) having low accessibility due to lesser number of ATMs (numerator). In addition, there is a limit on the number of times cash can be withdrawn from ATMs without any charges, which acts as a deterrent at times. 18.2 Benchmark rating: Leader 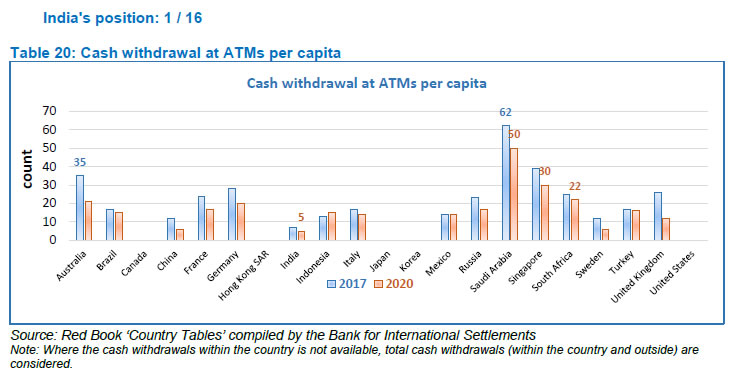 18.3 Analysis: A higher number of cash withdrawals at ATMs per capita indicates higher dependence on cash. However, cash withdrawals are likely to depend on the ATM density as well, and limited availability of ATMs may impact the number of withdrawals. Further, disruptions caused by the Covid pandemic and restrictions in place on public movement have lowered cash withdrawals in most jurisdictions (except Indonesia). In India, apart from the low ATM density, due to limited availability of ATMs to cater to a huge population there is a restriction on the number of free ATM transactions (financial and non-financial) per month. This is likely to have resulted in lower per capita cash withdrawals at ATMs. In some jurisdictions, cash is still widely used as a means of payment, which would result in higher cash withdrawals per capita. Singapore and Sweden have made significant progress in reducing withdrawals through ATMs. Cash is mainly used for low-value payments in Europe, while cards are used for larger-value payments. 19. ATM withdrawal vs CIC19 19.1 Key insight: India has one of the lowest ratios of cash withdrawal at ATM to CIC. This is likely to be the result of low ATM density coupled with low number of ATM transactions per capita. 19.2 Benchmark rating: Leader 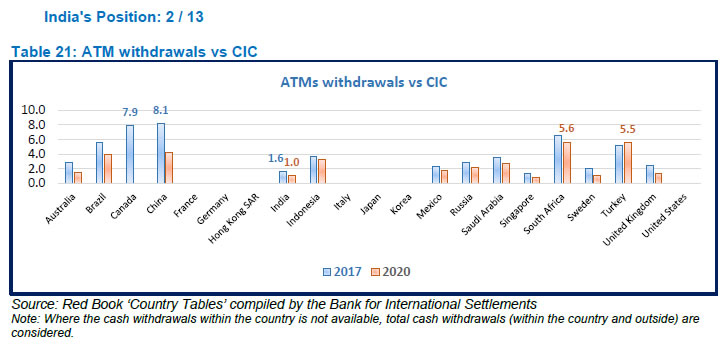 19.3 Analysis: The ratio of value of cash withdrawals to CIC declined in most countries (except Turkey) in the year 2020. This is likely to be on account of the restrictions in place due to the CoVID pandemic limiting the number of visits to ATMs and hence impacting the overall value of withdrawals. The value of withdrawal from ATMs was same as the amount of CIC for India in 2020. This has dropped from 1.6 times CIC in 2017. In India, in addition to the low ATM density which has limited the number of transactions at ATM, there are limits enforced on the amount that can be withdrawn from ATMs. These factors have resulted in low ratio of cash withdrawal at ATM to CIC. 20. Presence of domestic card network and its share 20.1 Key insight: In India, the domestic card network, RuPay was launched by NPCI in 2012. As at end of March 2022, there were over 652 million RuPay debit cards dominating the market with a share of over 65% of total debit cards issued. However, RuPay cards comprise less than 3% share in the credit card segment in India. 20.2 Benchmark rating: Moderate
20.3 Analysis: Card payments are one of the primary alternatives to cash and most jurisdictions have their own domestic card network to promote card transactions. The domestic card networks are observed to dominate the share of card usage in China (99%), France (84%), Germany (37%) and Saudi Arabia (45%). In India, there has been a significant growth in the usage of RuPay cards in the recent past. Jurisdictions with a domestic card network are usually observed to promote the usage of domestic cards for transactions and establish tie-ups with international card schemes for international transactions. The domestic card network in India received a fillip from the Central Government’s efforts to support financial inclusion by promoting issuance of Rupay debit cards to Basic Savings Bank Deposit (BSBD) account holders. In addition, to promote its usage, MDR has been waived for RuPay debit cards. NPCI is working on building regional partnerships to enhance the international acceptance of RuPay Cards. NPCI's alliance with international network partners (China Union Pay (CUP), Discover Financial Services (DFS) and Japan Credit Bureau (JCB) has paved the way for international acceptance of RuPay. RuPay co-branded international cards using DFS & JCBI BINs are accepted at over 195 countries. Further, NPCI has entered into arrangements with Bhutan and Singapore to accept RuPay cards without co-branding with other international card schemes. This is expected to promote more demand for RuPay cards by residents, boosting its market share. 21. Volume and growth of credit transfers 21.1 Key insight: India dominates credit transfers, both in terms of number of transactions in 2020 and CAGR over the 3-year period between 2017 and 2020. This can be attributed to the plethora of credit transfer systems available round the clock facilitating immediate funds transfers. 21.2 Benchmark rating: Leader 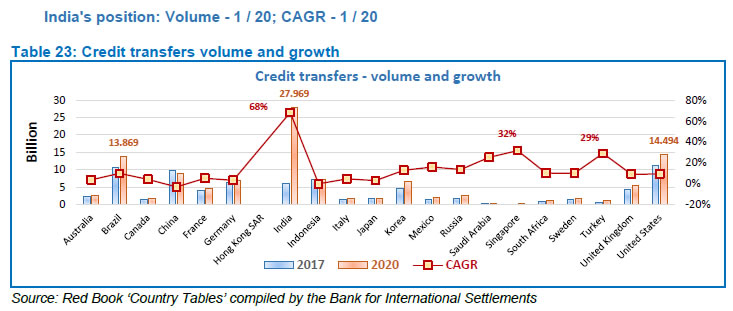 21.3 Analysis: India has witnessed a robust growth in credit transfer volumes between 2017 and 2020 compared to the other benchmarked countries. The volume stands at a staggering 27.97 billion during the year 2020 which grew at a CAGR of 68% between 2017 and 2020. In India, retail credit transfers are undertaken through NEFT, NACH Credit, IMPS and UPI. The growth in credit transfer payments in India can be attributed to the ‘interoperable payment systems’ which have revolutionised the payments landscape. Interoperability has facilitated use of payments infrastructure by banks and third-party application providers, bringing convenience to the consumers. The credit transfer systems are used for effecting funds transfers to beneficiaries, as an alternative to cash and cards for making payments and also to scan QR codes and undertake merchant payments. 22. Share of credit transfers in payment systems (volume) 22.1 Key insight: The share of credit transfers in overall payment systems transactions grew from 37.5% in 2017 to 68.8% in 2020 and is now the highest amongst the benchmarked countries. 22.2 Benchmark rating: Leader 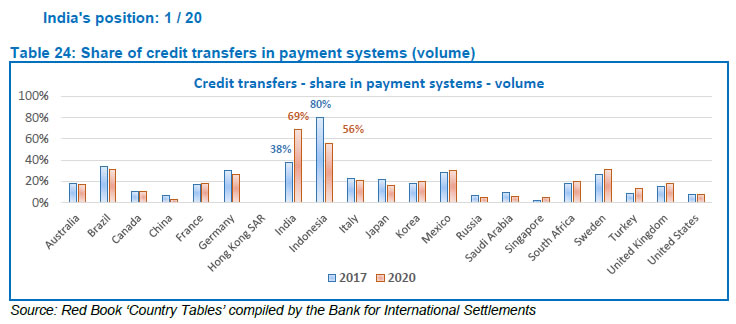 22.3 Analysis: A high share of credit transfers in total payment transactions indicates consumer preference for credit transfer systems over other forms of payment systems (direct debits, paper clearing) and instruments (Cards, e-Money) for making payments. India has a bouquet of retail credit transfer systems (NEFT, IMPS, UPI, AePS, NACH) with many of the systems (NEFT, IMPS, UPI) available round the clock and facilitating real time payments. This has contributed to India emerging as the leader as far as share of credit transfers in 2020 is concerned. Credit transfers are also observed to dominate the payments in Indonesia, with a 56% share in 2020. 23. Real Time Gross Settlement (RTGS) 23.1 Key insight: In India, the RTGS system, owned and operated by RBI, was introduced in 2004 and has undergone various changes over the years. The RTGS system is running round the clock from December 14, 2020; making India one of the few countries in the world to have its large value payment system operating 24x7. 23.2 Benchmark rating: Leader
23.3 Analysis: Large value payment systems are systemically important FMIs that are critical elements of a country’s national payment system. RTGS facilitates real time large value funds transfers on a gross settlement basis, which helps reduce credit risk. However, gross settlement is liquidity intensive and requires payment, irrespective of its nature, to be pre-funded to ensure settlement. In view of the significance of RTGS, countries have adopted different criteria for granting access to this system. In most jurisdictions RTGS is owned and operated by the central bank and is used for customer and inter-bank payments. To ensure settlement in central bank money, settlement files of ancillary payment systems are posted to RTGS for final settlement. RTGS operating hours have a significant impact on the economy as the system processes large value corporate transactions. Extension of operating hours of RTGS can facilitate an increase in market timings. Further, extended availability of RTGS can ensure posting of additional settlement cycles for ancillary payment systems and reduce the build-up of settlement, credit, and default risks, thus enhancing the efficiency of payments ecosystem. A wide overlap in operations of RTGS systems across jurisdictions can also be leveraged to integrate payment systems and enhance cross-border payment arrangements. In India, RTGS was made available round the clock from December 14, 2020. This initiative provided increased flexibility for corporates and individuals to undertake payments and ensured posting of additional settlement cycles of ancillary payment systems. In India access to RTGS was earlier permitted to domestically located banks, clearing houses and broker dealers. The membership criteria for RTGS was reviewed in July 2021 and PSOs, viz. prepaid payment instrument Issuers, card networks and white label ATM operators were permitted to participate in RTGS as direct members. Granting access to non-banks helps reduce costs for members, minimise their dependence on banks, reduce time taken for undertaking payments and eliminates uncertainty in finality of payments. 24. Channels in which fast payments are available 24.1 Key insight: India is one of the few countries that has two fast payment systems, viz. IMPS and UPI. The adoption of instant payments in India has been remarkable, with India dominating the number of transactions undertaken using fast payment systems as compared to other countries for which data is available. In addition, India also has another retail payment system operated by RBI, viz. NEFT, which though not a fast payment system (as it is settled in half-hourly batches), runs 24x7, without settlement risk as payment is made to the beneficiary only after the settlement. 24.2 Benchmark rating: Leader
24.3 Analysis: Fast payments are payments in which the transmission of the payment message and the availability of “final” funds to the payee occur in real time or near-real time and the systems run as near to a ‘24-hour and seven-day (24x7)’ basis as possible. The introduction of fast payment systems has led to various innovations and revolutionised the way payments are undertaken. Across jurisdictions, fast payment systems support multiple functionalities such as bill payments, QR based payments, NFC based payments, request to pay, etc. Fast payment systems are also leveraged to provide non-financial services such as account alias services, balance enquiry, payment scheduling, etc. Various jurisdictions are engaged in establishing linkages between their fast payment systems and payment systems in other jurisdictions to facilitate instant cross-border payments. Jurisdictions have followed different approaches to granting access to non-banks to their fast payment systems with some granting direct access (Mexico, Singapore, United Kingdom) and others permitting indirect access (Australia, Europe, India, Hong Kong). Among the benchmarked countries, only IBPS in China did not permit access to non-banks and only the SPEI system in Mexico followed a hybrid settlement model. The settlement method adopted also varied across systems with some following real time gross settlement and others adopting deferred net settlement. Fast payment systems are driving the overall retail payments in India, atleast in terms of volume. Fast payments constituted over 73% of the total retail payment transactions in India in March 2022. UPI alone processed 5.4 billion transactions in March 2022 accounting for 64% of the retail payment transactions. The UPI system powers multiple bank accounts into a single mobile application of any participating bank / non-bank Third Party Application Provider (TPAP). Further, at present, there are 20 TPAPs (Google, WhatsApp, Amazon, etc.) partnering with banks to facilitate UPI transactions. 25. Volume and growth of direct debits 25.1 Key insight: Direct debits in India, at a CAGR of 38.6% between 2017 and 2020, have registered the fastest growth amongst the benchmarked countries. However, in terms of volume, the direct debits in India are lower than countries like United States of America, Germany, Brazil, United Kingdom, France and South Korea. 25.2 Benchmark rating: Volume - Strong; CAGR – Leader 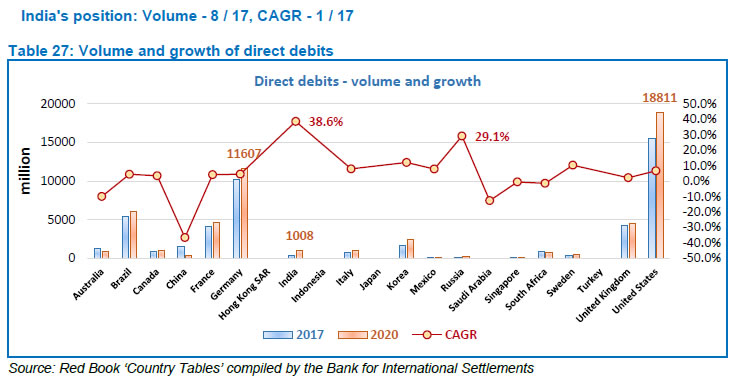 25.3 Analysis: Direct debits are payments based on a prior mandate, which are typically used for recurring payments, such as credit card and utility bills. In India, direct debit payments primarily comprise NACH debit payments. Despite the highest CAGR of 38.6% amongst the benchmarked countries, the volume of direct debit transactions in India is low. Direct debits increased during the CoVID pandemic as they were used to facilitate direct benefit transfer (DBT) payments to the poor and marginalised individuals across the country. The direct debit transactions are observed to have increased between 2017 and 2020 in most of the benchmarked countries except for Australia, China, Saudi Arabia, Singapore and South Africa. 26. Share of direct debits in payment systems (volume) 26.1 Key insight: India’s share of direct debit transactions in payment systems was 2.5% in 2020. The change in share of direct debit payments in payment systems is insignificant for most of the benchmarked countries. 26.2 Benchmark rating: Moderate 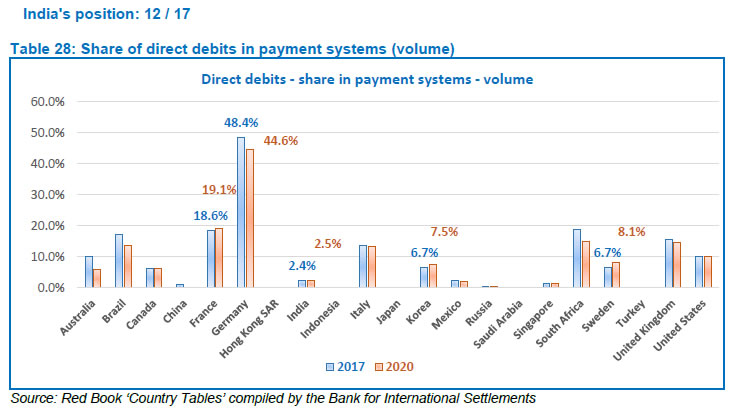 26.3 Analysis: The share of direct debits was observed to have increased, noticeably, from 2017 to 2020 only in France, Korea and Sweden. In India, although the number of direct debit transactions are increasing over the years, the payments landscape is dominated by credit transfer transactions. This explains the considerably low share of direct debit transactions. Direct debit transactions dominate the payments landscape in Germany where the Single Euro Payments Area (SEPA) direct debit is popular. SEPA direct debit is pull-based, wherein merchants can initiate multiple payments on receipt of a mandate from their customer. Payments take place directly between banks and no card networks are involved. SEPA direct debit payments are faster and cheaper for businesses as compared to card-based alternatives. However, the share of direct debits witnessed a drop in Germany from 48.4% in 2017 to 44.6% in 2020. 27. Availability of alternate payment systems 27.1 Key insight: As per the Worldpay Global Payments Report 2022, 45% of the online transactions in India are undertaken using digital / mobile wallets (e-Money). In India, alternative forms of payment, facilitated through UPI third-party applications, are predominantly used for online payment transactions. 27.2 Benchmark rating: Leader
27.3 Analysis: The Worldpay Global Payments Report 2022 defines alternative payment methods as payments using methods other than cash or physical cards linked to the global card brand networks. Alternative payment methods include bank transfers, digital and mobile wallets, direct debit, and buy now, pay later (BNPL). In India, non-bank entities have played a major role in alternate payments with Fintech firms participating in the payments ecosystem as Prepaid Payment Instrument (e-Money) issuers, Bharat Bill Payment Operating Units (Bill payments) and third-party application providers in the UPI platform. BigTech firms also participate in UPI as third-party application providers and facilitate transactions through their platforms - Google Pay, Amazon Pay, WhatsApp, etc. Non-bank PPI issuers also provide the UPI facility in an interoperable manner to their PPI wallet holders. In China, alternate payment methods dominate the payment transactions with over 83% share in online transactions and 54% share in retail store transactions. The dominance of alternate payments in China has been propelled by Alibaba’s Alipay and Tencent’s WeChat Pay. 28. Volume and growth of e-Money 28.1 Key insight: India fares well in terms of the volume of e-Money transactions with over 4950 million transactions in 2020. The transactions are undertaken using pre-paid payment instruments in the form of cards or wallets issued by approved banks as well as authorised non-bank issuers. 28.2 Benchmark rating: Volume - Strong; Growth – Moderate 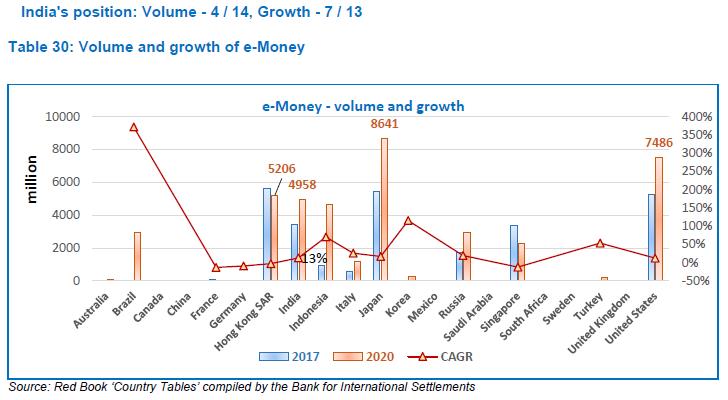 28.3 Analysis: e-Money is prepaid value stored electronically, which represents the liability of the e-Money issuer (a bank, an e-Money institution or any other entity authorised or allowed to issue e-money in the local jurisdiction) and which is denominated in a currency backed by an authority. In India, e-Money comprises of PPIs issued as Wallets and Cards. Security and ease of carrying out a transaction are major factors contributing to the rising usage of digital wallets both by individuals and merchants. In India, to give impetus to small value digital payments, a “small” PPI was introduced in December 2019 with minimum know your customer (KYC) requirement and amount loaded in a month capped at ₹10,000. Further, in May 2021, the limit for amount outstanding in PPIs with full KYC compliance was enhanced to ₹2,00,000. The introduction of interoperability between PPIs has obviated the need for on-boarding customers separately across various issuers and acquirers and has led to increased access and cost-effectiveness for consumers. The initiatives have resulted in a steady growth in volume of e-Money transactions between 2017 and 2020. In 2020, with 4958 million e-Money transactions, India was behind only Japan (8641 million), United States of America (7486 million) and Hong Kong (5206 million), out of the benchmarked countries for which data is available. e-Money transactions in India have increased at a CAGR of 13% between 2017 and 2020. Brazil is observed to be the leader in terms of growth, with CAGR of 372%, in volume terms between 2017 and 2020, primarily because of the low transaction volume in 2017 (28 million). The exponential growth of e-Money transactions during the period was majorly led by rising popularity of e-commerce and the population’s familiarity with smartphones. 29. Share of e-Money in payment systems (volume) 29.1 Key insight: The share of e-Money payment transactions in India decreased from 22.1% in 2017 to 12.2% in 2020 and is substantially lower than other countries, viz. Japan (78.8%), Singapore (60.1%) and Indonesia (36.5%). The fall in the share may also be read with the increase in other modes such as, UPI. 29.2 Benchmark rating: Strong 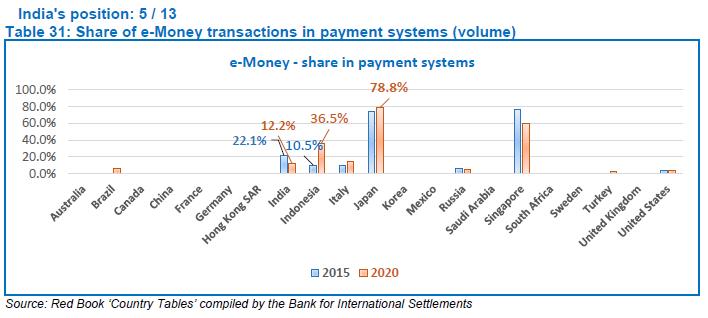 29.3 Analysis: Share of e-Money in payment systems transactions in 2020 was 12.2% for India. While rising availability of mobile infrastructure and interoperability of e-Money instruments has led to growth in e-Money transactions, the dominance of other forms of alternative payments has resulted in a decline in the share of e-Money transactions. Indonesia witnessed the highest percentage increase in share (26%) of e-Money in payment transactions during the period from 2017 to 2020. In Indonesia, a cash driven economy with huge unbanked population and high availability of smartphones, e-wallet transactions have picked up significantly and consumers are moving towards the ease of non-cash options. Singapore’s tech-savvy culture and high smart phone adoption rate has aided use of e-Money methods for low-value day-to-day transactions. 30. Digital payments of utility bills 30.1 Key insights: Bharat Bill Payment System (BBPS) was introduced in October 2017 to offer interoperable and accessible bill payment services to customers using multiple modes and instant confirmation of payment. The system has witnessed remarkable growth in terms of billers and transactions processed. 30.2 Benchmark rating: Moderate 30.3 Analysis: As per the Global Findex survey 2017 conducted for the World Bank, only 3% of the population in India used the internet to pay utility bills in the year 2017. With the introduction of BBPS it is expected that the ratio would increase as there is a migration of utility bill payments to electronic modes. The RBI has taken initiatives to expand the scope and coverage of BBPS to include all billers that raise recurring bills. This has resulted in over 20,000 billers being onboarded in BBPS as at end March 2022. Apart from digitisation of cash-based bill payments, billers onboarded on BBPS also benefit from the standardised bill payment experience for customers, centralised customer grievance redressal mechanism, prescribed customer convenience fee, etc. 31. Public mass transportation 31.1 Key insight: Digital payments are in use to pay for public transportation in most metropolitan cities in India. The metro rails operating across the country employ the use of smart cards that facilitate contactless cash free travel. 31.2 Benchmark rating: Moderate 31.3 Analysis: Ticketing, which involves payment processing, is the key element of a public transport system. The two main types of ticketing systems are instrument-based ticketing (paper / card) and account-based ticketing. In an instrument-based ticketing system, the funds, proof of entitlement to travel and any primary records of travel, are held directly on the card / paper. In an account-based system, the proof of entitlement to travel and any records of travel, are held in the back-office with fare calculated and billed after the trip is complete. With the CoVID pandemic, contactless payment options have gained popularity with many public transportation agencies deploying QR codes for ticketing. NFC devices are other options that have been used by consumers to undertake contactless payments for public transportation.
32. Mobile and broadband subscriptions 32.1 Key insight: The number of mobile and fixed broadband subscriptions per 100 individuals in India was the lowest at 83.6 and 1.6, respectively, in 2020. Further, fixed broadband subscriptions increased at a CAGR of 6.3% over the period from 2017 to 2020, while mobile subscriptions decreased at an annualised rate of 1.4%, during the period. 32.2 Benchmark rating: Weak
32.3 Analysis: Mobile and internet accessibility are key enablers facilitating digital payments. Both banks and non-banks have leveraged on the same to offer payment services using these channels. Banks have been offering internet banking and mobile banking facility to consumers while non-bank PSOs and providers have encouraged payment transactions through mobile applications and digital wallets. Further, mobile and internet connectivity have been used to provide innovative payment solutions such as contactless payments, tokenisation, QR based payments, etc. Mobile connections in India in absolute terms appear lower than other countries, primarily due to lower level of mobile penetration in rural areas. The Telecom Regulatory Authority of India (TRAI) data for March 2022 reported a tele-density of 130.17% in urban areas as compared to 57.85% in rural areas of the country. Further, some individuals with multiple mobile connections are observed to have switched to a single network impacting the number of connections. The drop in mobile connections may be attributed to the shutdown / merger of mobile cellular operators in the country on the supply side and the impact of the CoVID pandemic on small businesses / migrants on the demand side. Similar decline in mobile connections in 2020, as compared to 2017, is observed in other countries as well (Australia, Brazil, Germany, United Kingdom, Indonesia, Italy and Singapore). In India, there were 1.6 fixed and 52.4 wireless broadband connections per 100 people in 2020. On including wireless broadband connections, there is considerable improvement in India’s performance in the indicator. As per the data published by TRAI for March 2022, fixed broadband connections (27.25 million) account for less than 4% of the total broadband connections (788.3 million). Further, efforts are underway by the Bharat Broadband Network Limited to provide high speed digital connectivity to rural India, facilitated through installation of WiFi terminals in gram panchayats and Fiber to the Home (FTTH) connections. This section was drafted based on the Government e-Payments adoption ranking published by Economist Intelligence Unit for the year 2018. There has been no subsequent publication and hence the Government e-payments are not being assessed in this benchmarking exercise. 33. Third party payment service providers / payment gateways / payment aggregators 33.1 Key insight: India recently introduced guidelines to regulate the activities of payment aggregators and mandated all existing payment aggregators to apply for authorisation by September 30, 2021. In India, the activities of payment gateways are not regulated as they do not handle funds and the regulator only issues recommendatory guidelines on baseline technology for their activities. Further, to enable effective management of risks in outsourcing of activities, a framework was prescribed for outsourcing of payment and settlement related activities of PSOs. 33.2 Benchmark rating: Strong 33.3 Analysis: Third party payment service providers / payment gateways / payment aggregators are service providers who process the payment transactions of e-commerce merchants. The regulations relating to third party payment service providers / payment gateways / payment aggregators are pertaining to specific areas such as (i) licensing / authorisation, (ii) requirements for operation, (iii) security of online payments, (iv) settlement of funds and (v) customer protection. Direct regulation of third party payment service providers is in place in China, Brazil, Japan and South Korea. However, in countries such as Singapore there is no direct regulation of payment intermediaries. In India, only the activities of payment aggregators are regulated as they involve handling of funds.
R. Customer protection and complaint redressal 34. Customer safety and authentication standards 34.1 Key insight: India has a framework on limiting liability of customers in unauthorised electronic banking transactions. In addition, the regulator has introduced various measures, since the last exercise, to ensure safety of customer transactions, viz. (a) facility to switch on / switch off card transactions, (b) CoF tokenisation, (c) mandating LEI for high value transactions in CPS, (d) positive pay system for high value cheques. 34.2 Benchmark rating: Strong 34.3 Analysis: In the e-commerce environment, where transactions are undertaken online, it is essential to validate the identity of a payer while undertaking a transaction. Card payment networks have recognized this need and put in place authentication standards to validate the cardholder during card-not-present e-commerce transactions. Further, there are various security features that can be provided to protect consumers and prevent fraudulent transactions. In India, various initiatives are undertaken to enhance security of card transactions. In 2020, India mandated card issuing banks to provide customers the facility to switch on / off and set / modify transaction limits for all types of transactions domestic and international, at PoS / ATMs / online transactions / contactless transactions, etc. Further, card networks were permitted to provide card tokenisation services to enable card holders to benefit from the security of tokenised card transactions. In addition, to disseminate information about safe digital banking, RBI has been conducting Electronic Banking Awareness and Training (e-BAAT) programmes across the country, actively undertaking digital awareness campaigns in the print and Audio-Visual media, including through the Bank’s flagship programme “RBI Kehta Hai”20.
35.1 Key insight: RBI in November 2021 launched the Integrated Ombudsman Scheme to make the alternate dispute redressal mechanism simpler and more responsive to the customers of entities regulated by it. The Integrated Ombudsman Scheme combined the following 3 schemes (i) the Banking Ombudsman Scheme, 2006; (ii) the Ombudsman Scheme for Non-Banking Financial Companies, 2018; and (iii) the Ombudsman Scheme for Digital Transactions, 2019. Further, to ensure a swift, effective and efficient complaint redressal mechanism, an internal ombudsman scheme was introduced for large non-bank PPIs in 2019. 35.2 Benchmark rating: Strong 35.3 Analysis: Jurisdictions should ensure that consumers have access to grievance redressal mechanisms that are accessible, affordable, independent, fair, accountable, timely and efficient. An Ombudsman not only helps to redress the individual wrongs faced by consumers without exhorbitant legal costs but also acts as a feedback mechanism, which helps to inform the regulatory measures. The Ombudsman Scheme for Digital Transactions in India has facilitated the redressal of complaints pertaining to digital transactions undertaken by customers of a Payment System Participant viz. any person other than a bank offering payment services / operating payment systems. It is an expeditious and cost-free apex level mechanism for resolution of complaints regarding digital transactions. These activities are now covered under the Integrated Ombudsman Scheme.
A comparison of similar schemes across countries shows that India is one of the few countries where the entire gamut of digital payment transactions is covered under the Ombudsman scheme. The Ombudsman schemes in other countries do not appear to focus on digital payment transactions. The Ombudsman in many jurisdictions is funded by industry participants, which does not engender trust among the consumers. Further, in some jurisdictions such as Canada the Ombudsman does not have the power to issue binding directions. In addition, to build customer confidence in the payment systems and safeguard the interest of the consumers, RBI mandated large non-bank PPI issuers to put in place an Internal Ombudsman Scheme. The scheme was intended to ensure that majority of the complaints of customers are redressed at the level of the PSO itself by an authority placed at the highest level of the PSOs grievance redressal mechanism. S. Securities settlement and clearing system 36. Central Counterparty (CCP) Although there are multiple CCPs operating in India, for the purpose of this study, we focus on the operations of the CCP regulated by RBI, i.e., CCIL. 36.1 Key insight: CCIL operates as a CCP and provides guaranteed clearing and settlement for transactions in money, Government securities, foreign exchange and derivative markets. In a cross-country comparison CCIL fares strongly with regard to governance arrangements in place for managing the organisation and the risk management practices implemented to manage member defaults and other non-default losses. 36.2 Benchmark rating: Leader 36.3 Analysis: CCPs are critical FMIs that provide guaranteed settlement services in the markets served by them and mitigate counterparty risk for the participants, thereby reducing systemic risk. It is essential to ensure CCPs function in an efficient and effective manner while ensuring appropriate governance. Further, CCPs should have sufficient networth to cover potential general business losses and to enable them to provide services as a going concern. RBI has prescribed Directions for CCPs laying out: (i) directions on governance of domestic CCPs; (ii) directions on net worth requirements and ownership of CCPs; and (iii) directions for recognition of foreign CCPs. CCPs handle high value transactions and any failure can result in wider systemic implications. It is hence essential for CCPs to have appropriate risk management practices in place. In the case of CCIL, participant credit exposures are covered through multilateral netting, DvP / PvP settlements and margin collection. Market risk is managed by using margining models for all products. Initial margin is collected to cover potential future exposures while intra-day and end of day MTM margin is collected to cover current exposures. CCIL undertakes back-testing of margining models and stress testing daily to assess adequacy of resources and procedures are in place to call for additional default fund contributions based on the stress test results. As per the PFMIs, CCIL is subject to Cover 1 requirements for all market segments as it does not operate as systemically important payment system in multiple jurisdictions and products cleared are not of complex risk profile. However, CCIL has implemented Cover 2 requirement for its derivatives segments - forex forward and rupee derivative segments. Losses due to participant defaults are handled by pre-funded resources comprising member contributed default fund and CCIL’s contribution from its Settlement Reserve Fund (SRF). CCIL’s skin in the game for each segment is set at 25% of the default fund contribution but not less than the highest individual member contribution for the segment, which is higher than most other CCPs. CCIL’s total skin in the game across all segments is capped at the balance in the SRF. Further, a Contingency Reserve Fund (CRF) has been put in place by CCIL to take care of losses arising out of non-default events.
37. Oversight of payment systems 37.1 Key insight: In India, the Payment and Settlement Systems Act, 2007 has designated and confers upon RBI the right to regulate and supervise payment systems within the country. In 2020, RBI published the updated oversight framework for FMIs and RPSs that details the oversight objectives and supervisory processes of RBI as well as the assessment methodology of FMIs and SWIPS under PFMIs. 37.2 Benchmark rating: Leader 37.3 Analysis: Oversight of payment and settlement systems is a central bank function whereby the objectives of safety and efficiency are promoted by monitoring existing and planned systems, assessing them against these objectives and, where necessary, inducing change. In India, the three key ways in which oversight activity is carried out are through (i) monitoring existing and planned systems; (ii) assessment of the FMIs and RPSs against the oversight objectives; and (iii) inducing change for improvements, where necessary. In India, the off-site surveillance and monitoring of FMIs and authorised RPSs is conducted by way of various tools, such as (a) submission of prescribed data / information by the regulated entities, (b) fraud monitoring / system of alerts, (c) regular meetings with authorised PSOs, (d) market intelligence, and (e) oversight reports and surveys. Further, onsite inspection / audit complements the offsite monitoring and surveillance mechanism put in place for the FMIs / RPSs. The onsite inspection activity is based on the risk profile of the entity derived from the annual self-assessment carried out by the entity and the information furnished by the entity and market intelligence, if any. FMIs and RPSs are subjected to periodic onsite inspection as determined by RBI from time to time.
U. Cross-border personal remittances 38.1 Key insight: In India, the major share of cross-border remittances is undertaken through banks. The non-bank players are permitted to facilitate inward remittances only. 38.2 Benchmark rating: Moderate 38.3 Analysis: Authorised Dealer banks facilitate remittances through different schemes of payment transfers, such as cheques and drafts, wire transfers, SWIFT transfers and Rupee Drawing Arrangements (RDAs). Among non-bank players, money transfer operators play a vital role undertaking cross-border transfers on behalf of their clients using either their internal systems or by accessing cross-border banking networks. There are various payment systems that facilitate cross-border transactions, either in single currency or multiple currencies. The Directo e Mexico system facilitates remittances from USA to Mexico by linking the Federal Reserve’s Automated Clearing House with the Mexican RTGS system with Bank of Mexico undertaking the FX conversion. The Gulf Cooperative Council RTGS system was implemented for facilitating transactions within the 6 Gulf region countries with payments in local currency. Further, initiatives have been undertaken to interlink fast payment systems operating across jurisdictions to facilitate cross-border payments and remittances. The interlinking of Singapore’s PayNow and Thailand’s PromptPay real-time retail payment system is one such example. On similar lines, the interlinkage of Singapore’s PayNow with India’s UPI is underway and is expected to go-live in the second half of 2022. In India, various initiatives have been undertaken to facilitate cross-border payments, especially personal remittances. To help Nepali migrant workers send remittances back home, the Indo Nepal Remittance Scheme was introduced that used NEFT to facilitate one-way transfer of funds from India to Nepal in partnership with State Bank of India (SBI). The Money Transfer Service Scheme (MTSS) is available through a tie-up between reputed money transfer companies abroad known as Overseas Principal and agents in India where the service is connected to digital and / or mobile platform enabling customers to undertake cross-border remittances. Further, RBI, in collaboration with the Government and NPCI is reaching out to jurisdictions to ensure global outreach of the UPI systems to facilitate cross-border transactions, including remittances. The linkages between fast payment systems across jurisdictions can enhance cross-border payment arrangements and ensure faster remittances. RBI also selected cross-border payments as the second cohort under the Regulatory Sandbox initiative to spur innovations capable of recasting the cross-border payments landscape by leveraging new technologies to meet the needs of a low cost, secure, convenient and transparent system in a faster manner. Finally, with RBI operated CPSs, viz. RTGS and NEFT operating round the clock, the required infrastructure is available which can be leveraged to interface with similar systems in other jurisdictions to facilitate cross-border payments, including remittances. 39.1 Key insight: India is the leader in terms of personal remittance inflows with 11.85% share of the global remittances received by it. In the year 2020, India received remittances amounting to over USD 83 billion. 39.2 Benchmark rating: Leader
39.3 Analysis: Remittances are usually low value, high volume funds transfers primarily to receivers in emerging market and developing economies. Personal remittances are usually money that migrants send back to their family and friends in their countries of origin and are usually used as an indicator to measure migration and development. With increasing labour mobility, remittance flows to emerging market and developing economies are significant and observed to be higher than both foreign direct investment and official development assistance to such countries. In terms of remittance inflows, India is the leader with USD 83.1 billion, (share 11.79% of global remittance inflows) followed by China, with USD 59.5 billion, (share 8.43%) and Mexico, with USD 42.8 billion (share 6.08%). Due to the CoVID pandemic, remittance inflows declined in the year 2020 across most of the countries (except Brazil, Hong Kong, Japan, Korea, Mexico) as compared to the previous year. Remittance inflows to India, however, remained resilient and declined by only 0.2% in the year 2020. 40.1 Key insight: The cost of sending remittances to India was lower than that to other benchmarked countries. However, the cost of sending remittances from India was higher than that from Russia and Singapore. It may be noted that, it may not be appropriate to compare remittances across countries selected in the benchmarking exercise, as remittances primarily originate from advanced economies and are directed to beneficiaries in emerging economies. 40.2 Benchmark rating: Strong 40.3 Analysis: The Financial Stability Board (FSB) stage 1 report on enhancing cross-border payments identified high cost as one of the major challenges in existing cross-border payment arrangements. The report highlighted the demand side impact of high transaction fees on individuals and small businesses, which may discourage cross-border payments. Further, from a supply side perspective various costs are involved such as operational cost, regulatory compliance cost, network cost, correspondent cost, FX cost, liquidity cost, AML / CFT related costs, etc. Remittance cost is influenced by various parameters like destination, method of transfer, payments infrastructure, remittance value, competition, and prevailing regulations in the remitting and receiving country. Further, the remittance cost varies across corridors, depending on exchange rate margins, service provider fees, origination (online or branch), instrument and intermediaries involved. The subsequent FSB consultative report on Targets for Addressing the Four Challenges of Cross-Border Payments, proposed a target for cost of remittances. The report reaffirmed the United Nations Sustainable Development Goals target that the global average cost of sending a remittance of USD200 should be no more than 3% by 2030, with no corridors having costs higher than 5%. The global average cost of sending USD200 remains high at 6.38% in Q1 2021. Further, South Asia continues to be the lowest cost (receiving) region, with an average cost of 4.64%. However, even though the remittance costs (receiving country) are comparatively lower for India, efforts are underway to further reduce the costs by leveraging India’s payment systems to establish linkages with other jurisdictions and provide a cheaper and quicker alternative to available channels for remittances.
1 https://stats.bis.org/statx/toc/CPMI.html 2 https://worldpay.globalpaymentsreport.com/en 3 https://fastpayments.worldbank.org/ 4 https://globalfindex.worldbank.org/ 5 https://databank.worldbank.org/source/world-development-indicators 6 https://cms.uitp.org/wp/wp-content/uploads/2021/03/Report-Ticketing_NOV2020_update.pdf 7 https://www.fsb.org/2020/04/enhancing-cross-border-payments-stage-1-report-to-the-g20/ 8 https://www.fsb.org/2021/05/targets-for-addressing-the-four-challenges-of-cross-border-payments-consultative-document/ 9 https://www.aciworldwide.com/real-time-payments-report?utm_source=fintechfinance&utm_medium=display&utm_campaign=fm-2022-bnks-global-prime-time-2022 10 https://www.afca.org.au/; https://www.financial-ombudsman.org.uk/; https://www.obsi.ca/; https://acpr.banque-france.fr/en/page-sommaire/about-acpr; https://www.bafin.de/EN/Homepage/; https://www.obssa.co.za; https://finombudsman.ru/; https://www.occ.treas.gov/topics/supervision-and-examination/dispute-resolution/consumer-complaints/index-consumer-complaints.html 11 https://www.kansascityfed.org/documents/7408/PSCP2005_Weiner-Wright.pdf 12 https://www.bis.org/cpmi/publ/d102.pdf 13 https://www.knomad.org/data/remittances 14 Last exercise rating methodology was as follows: a) “Leader”: ranked 1st or 2nd or 3rd; b) “Strong”: in the top rungs of the countries other than the leaders (4th to 9th); c) “Moderate”: ranked in the middle (10th to 15th); and d) “Weak”: in the lowest rungs (16th to 21st). 15 /en/web/rbi/-/statistics/data-releases/monthly-payment-system-indicators-february-2022-3 16 /en/web/rbi/-/oversight-framework-for-financial-market-infrastructures-fmis-and-retail-payment-systems-rpss-3864 17 In the last exercise the Cash withdrawal to CIC was low and India was ranked weak in the indicator considering low availability of ATMs. However, on a review, considering the focus on shifting towards digital payments, a low ratio of cash withdrawal to CIC is desirable. The rationale for the rating has been modified accordingly. 18 ECS was discontinued in January 2020 with the transactions migrated to NACH. 19 In the last exercise the Cash withdrawal to CIC was low and India was ranked weak in the indicator considering low availability of ATMs. However, on a review, considering the focus on shifting towards digital payments, a low ratio of cash withdrawal to CIC is desirable. The rationale for the rating has been modified accordingly | |||||||||||||||||||||||||||||||||||||||||||||||||||||||||||||||||||||||||||||||||||||||||||||||||||||||||||||||||||||||||||||||||||||||||||||||||||||||||||||||||||||||||||||||||||||||||||||||||||||||||||||||||||||||||||||||||||||||||||||||||||||||||||||||||||||||||||||||||||||||||||||||||||||||||||||||||||||||||||||||||||||||||||||||||||||||||||||||||||||||||||||||||||||||||||||||||||||||||||||||||||||||||||||||||||||||||||||||||||||||||||||||||||||||||||||||||||||||||||||||||||||||||||||||||||||||||||||||||||||||||||||||||||||||||||||||||||||||||||||||||||||||||||||||||||||||||||||||||||||||||||||||||||||||||||||||||||||||||||||||||||||||||||||||||||||||||||||||||||||||||||||||||||||||||||||||||||||||||||||||||||||||||||||||||||||||||||||||||||||||||||||||||||||||||||||||||||||||||||||||||||||||||||||||||||||||||||||||||||||||||||||||||||||||||||||||||||||||||||||||||||||||||||||||||||||||||||||||||||||||||||||||||||||||||||||||||||||||||||||||||||||||||||||||||||||||||||||||||||||||
पृष्ठ अंतिम बार अपडेट किया गया:


