 IST,
IST,
Chapter II : Financial Markets
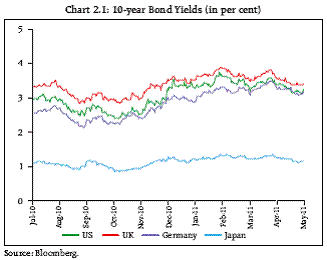
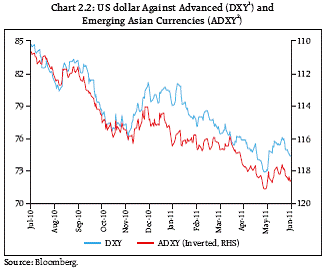
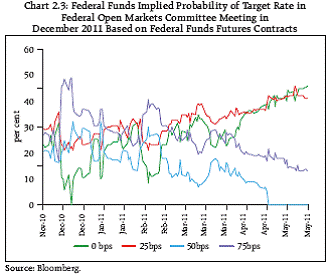
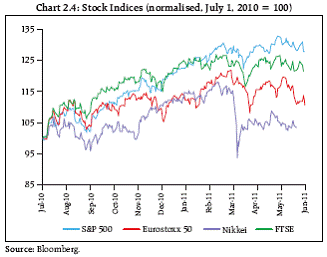
Several advanced economies (AEs) are trying to break the mutually reinforcing cycle of low growth and high indebtedness. Very few have made progress that is promising, on this count. Heightened sovereign risk concerns may increase funding costs for not just sovereigns but financial institutions also which still face a substantial wall of financing needs. Competition among sovereigns and financial institutions for funding comes at a time when there is near-consensus among investors about stronger prospects in emerging market economies (EMEs). Given this backdrop, a small shock could have potential negative feedback effects that threaten markets beyond AEs. EMEs in turn are looking to shield themselves from capital flows in excess of their absorption capacity to prevent imbalances from developing in their own economies. In India, there are early signs of a greater reliance on foreign sources of funding. The flow and stock effects of greater internationalisation of the Indian markets, institutions and funding need to be prudently monitored and managed. International Markets 2.1 Global financial markets remained orderly during the period since the release of the previous Financial Stability Report (FSR). Two events of systemic significance, the Japanese earthquake and conflict in Libya, caused sharp corrections in financial markets but their immediate impact appears to be waning slowly. Rate hike expectations for the year in US have fallen 2.2 Monetary policy in AEs continues to remain accommodative. The Federal Reserve’s policy rate, the Federal Funds Target Rate stands at 0 - 0.25 per cent, the second Quantitative Easing (QE II) programme of US$ 600 billion is likely to conclude in June 2011 but the Federal Reserve would continue to reinvest the principal payments from its securities holdings. 10-year US treasury bond yields were trading below 3 per cent after the release of lower than expected rise in US payrolls data in early-June (Chart 2.1). Federal Reserve Chairman Bernanke has linked “sustained period of job creation” with a “truly established” recovery. The most notable development of this period has been the secular decline in the US dollar against most currencies (Chart 2.2), of both advanced and emerging markets. The US economic data has been soft enough to keep expectations of interest rate hike in check, but not weak enough to not sustain a strong growth. Expectations of rate hike by the Federal Reserve by December 2011 which were growing earlier in the year have since receded (Chart 2.3). This has allowed risk appetite to remain strong, and the US dollar to be used as a funding currency for risk asset trades. US equity indices traded with a positive bias during the period (Chart 2.4) with investors favouring stocks with greater exposure to emerging markets.
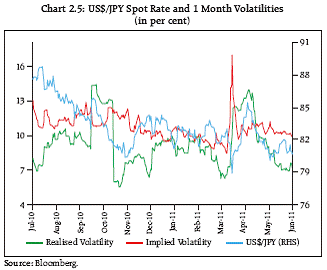
Withdrawal of monetary accommodation in Euroarea has begun at an uncertain pace 2.3 Meanwhile, in Europe, anticipation of policy normalisation in Euro-area has led to a steady rise in the Euro against major currencies, particularly, the US dollar, where policy would remain accommodative for a longer period. The European Central Bank (ECB) raised its policy rate, the refinance rate, by 25 bps to 1.25 per cent in its meeting on April 7, 2011. The currency, however, fell after ECB kept its policy rate unchanged in its meeting in May 2011 and President Trichet did not meet expectations about further rate hikes in the market3. The Euro fell heavily against major currencies after the May 2011 meeting, and has remained soft with the emergence of greater uncertainties in regard to Greece. European equity has remained range bound. Prospects for UK and Japan have muddled 2.4 In the UK, inflation remained above the target of the Bank of England (BoE) while growth remained weak. BoE expects inflation to rise further this year and remain above its target of 2 per cent in 2012. UK equity and bond markets remained orderly but directionless. The Pound sterling gained from general US dollar weakness. In Japan, the earthquake in March 2011, which caused large scale destruction to capital stock, rattled financial markets. Japanese production and growth are expected to remain subdued until later this year when the repair work would give a boost to output in the economy. The equity market is yet to recover its initial losses while the bond market yields which initially rose on fears of another round of fiscal expansion fell back as its impact wore off. The Japanese yen rallied in the wake of the earthquake on fears that there would be large scale repatriation by Japanese financial firms of their investments abroad. These fears, however, proved unfounded. The currency remained very volatile for a period following the earthquake in March 2011 (Chart 2.5). The sharp rise in the currency was successfully reversed with joint intervention by Japan and other advanced country central banks.
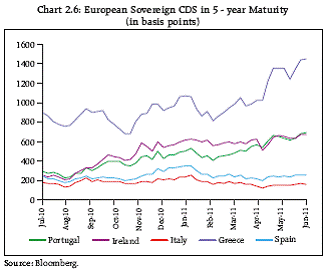
An earthquake transmits shocks to the financial system 2.5 Initial assessments by the Japanese Cabinet Office put the damage to the economy’s capital stock at around $240 billion, which is more than double the damage following the Kobe earthquake in 1995. GDP growth for Japan in 2011 is expected to be lowered with Q1 growth at (-) 3.7 per cent despite the massive rebuilding effort sought to be launched by Japan in the second half of the year. In the first two business days after the earthquake, the Nikkei stock index fell almost 20 per cent, and Japanese sovereign 5 year CDS spreads jumped almost 50 basis points from around 100 basis points and 10- year government bond yields rose 10 basis points from around 1.2 per cent. The Japanese yen became very volatile in the aftermath of the disaster. 2.6 The Bank of Japan (BoJ) responded swiftly to the challenge. In the first week after the earthquake, it injected ¥37 trillion (US$ 439 billion) into financial markets to ensure ample liquidity. It also increased the amount of its Asset Purchase Program by ¥5 trillion, with the aim of keeping premia on risk assets low. In response to the yen’s sharp appreciation, the BoJ, together with other G7 countries, embarked on a coordinated intervention in the foreign exchange market. Questions over sustainability of European sovereign debt remain 2.7 The concerns with regard to sustainability of sovereign debt in the Euro-area do not appear as be localised to Greece, Ireland and Portugal (Chart 2.6) which have sought bailout packages from European Union and IMF. The adverse and mutually reinforcing facets of the problem, namely, low economic growth and high indebtedness in many advanced economies (AEs) has led to an unstable equilibrium.
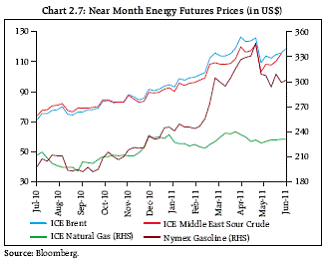
Fiscal concerns could spread to bigger economies 2.8 The European debt concerns pertain to relatively smaller economies of Greece, Ireland and Portugal. There are early signs of it spilling over into bigger European economies. S&P and Fitch placed Italy and Belgium on negative outlook in May 2011. Both countries have high debt, difficult fiscal prospects, and political challenges ahead. The moves added pressure to a battered euro area. Rising debt and deficit levels of bigger AEs, like US, UK and Japan are also inviting the attention of rating agencies. The concerns expressed by them have so far not rubbed off on risk or term premia on the long term debt of these sovereigns. The need to raise larger sums from the financial markets by AEs is coinciding with significant refunding requirements of international banks, mainly European ones. The wall of refinancing by such banks has to be carried in competition with not only domestic sovereigns but with emerging market assets which are perceived to have more favourable riskreward attributes. Geopolitical tensions and stagflation risks 2.9 Continuing tensions in the Arab world and the military conflict in Libya have had a direct impact on energy markets. Financial markets typically have low appetite for political risks. Equity, bond, credit and foreign exchange markets have corrected in view of the violence in Libya. A lengthy conflict in Libya, possibly combined with uncertainties about the viability of nuclear energy post-Fukushima, puts sustained upward pressure on global energy prices (Chart 2.7). This could add to existing concerns about inflationary pressures – not just in EMEs but in AEs where growth is still not on sound footing.
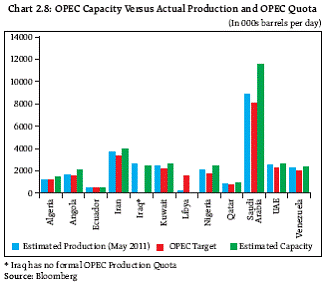
2.10 The oil industry’s supply dynamics have always been prone to disruption owing to low excess capacity and inventory levels (Chart 2.8). Precautionary stockpiling during such periods of political tension can aggravate the price moves in the energy markets causing distress to importing countries. At the same time, the higher revenues earned by the producers do not translate into any significant rise in export potential for others when the price moves are sharp. These developments have come at a time of high food and energy led inflation the world over. A resurfacing of stagflation risks of decades ago owing to oil supply shocks cannot be ruled out if the unrest were to spread to bigger oil exporters.
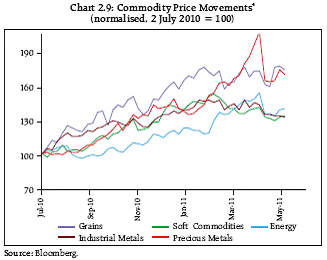
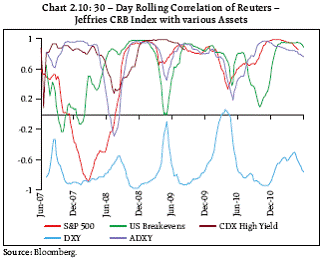
Financialisation of commodity markets increases asset correlation 2.11 Commodity prices (Chart 2.9) have traded with a positive bias since the global recovery and continued their advent during the period under review. The gyrations in commodity prices are often interpreted as early indicators of the changing prospects of the global economy, particularly that of EMEs. Increased financialisation of the energy and commodities market i.e. securitised commodity - linked instruments that are considered an investment rather than a risk management tool through Exchange Traded Funds, structured products and other vehicles has caused fears that genuine hedgers might get ‘crowded out’. There is, however, little evidence of financial investors as being responsible for high commodity prices today. However their actions could be adding to price volatility and correlation of financial and commodity markets (Chart 2.10). This phenomenon facilitates faster emission of stress from commodities to financial markets.
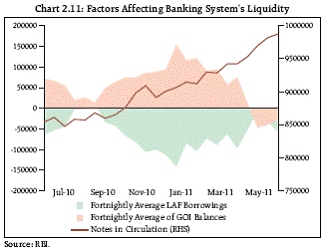
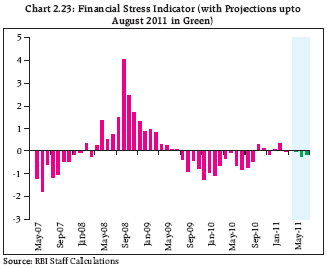
Domestic Markets 2.12 Domestic markets remained orderly without stress. This is evidenced by the Financial Stress Indicator (FSI)5 (Chart 2.19). Autonomous factors cause banking system liquidity to remain in deficit 2.13 The banking system liquidity has remained in deficit mode for almost a year as reflected in the Liquidity Adjustment Facility (LAF) operations of the Reserve Bank (Chart 2.11). The factors affecting it have been the increase in required reserve resulting from the growth in bank credit and Net Demand and Time Liabilities (NDTL) and currency in circulation. Inspite of a sharp turnaround in Government cash balances with the Reserve Bank during the current financial year, liquidity in the system remained in a deficit mode reflecting an increase in liquidity requirements of the economy. Volatility in the liquidity situation needs to be actively managed by the Reserve Bank.
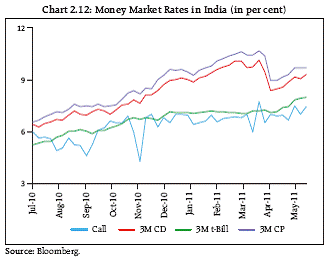
2.14 The tightness in liquidity conditions on account of autonomous and frictional factors got reflected in money market rates (Chart 2.12). The call money rates generally hovered around the upper bound of the LAF corridor. Similarly, the interest rates in the CD market moved in tandem with the call rates, except during a brief period leading to March 31, 2011, when banks raised funds prior to the annual closing of accounts. Commercial Paper (CP) and Certificate of Deposit (CD) rates touched double digits and treasury bill rates too rose above 8 per cent on occasions. The rates in the collateralised segments generally continued to move in tandem with the call rate, and stayed below it. Transaction volumes in the collateralised borrowing and lending obligation (CBLO) and market repo segments showed marginal improvement in Q4 compared to Q3 of 2010-11. Banks and primary dealers continued to remain the major group of borrowers in the collateralised segments whereas mutual funds (MFs) remained the major group of lenders of funds in these segments. The collateralised segment of the money market continued to remain the predominant money market segment, accounting for more than 80 per cent of the total volume during this period.
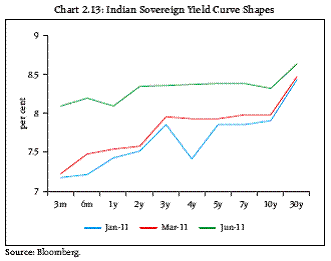
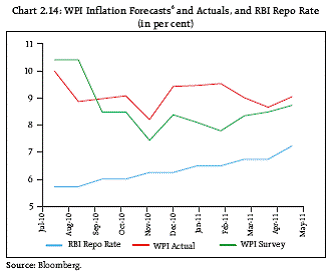
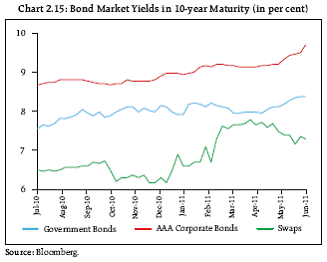
2.15 The government bond yields rose across the yield curve during the period under review with shorter maturities rising slightly faster (Chart 2.13). As a result, the yield curve flattened. Initially, there was a downward bias to yields on account of announcement by SEBI on auction of unutilised investment limits for FIIs for government securities and corporate bonds and a lower than expected April-September borrowing amount announced by the Central Government. Yields have, however, hardened with inflation rising beyond expectations on each occasion since September 2010 (May, April, March and February 2011 Wholesale Price Index (WPI) stood at 9.1, 8.7, 8.9 and 8.3 per cent respectively) raising expectations of further monetary tightening (Charts 2.14 & 2.15). In early-June, 2 - year bond yields exceeded those of 10 - year bonds causing a minor inversion in the yield curve.
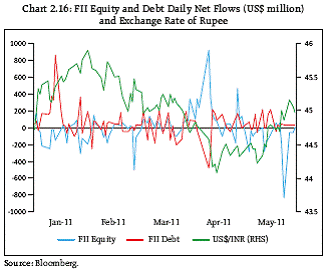
2.16 The Indian rupee remained in a range against the US dollar during the period under review despite several adverse factors, namely, high crude oil prices and slump in FDI. It was initially aided by a recovery in portfolio flows, including equity and debt capital (debt capital flows have remained strong since last year) (Chart 2.16) and narrowing of current account deficit. Banking capital which witnessed net outflows in Q3 2010-11 turned positive in Q4 2010-11. The general US dollar weakness globally has helped the Rupee further its gains. The correction in equity markets as a result of high inflation numbers and the attendant rate hikes during the period weakened the Rupee which gave up most of its gains.
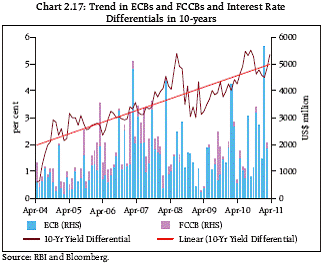
Financialisation versus internationalisation of Rupee 2.17 The offshore trading activity in the Indian rupee has been increasing at a rate much higher than that estimated by market participants (2010 Triennial Central Bank Survey of BIS). Some recent work on the share of offshore markets by Robert McCauley and Michela Scatigna (BIS Quarterly review – March 2011 and earlier by Ho et al (2005) and McCauley (2010)) has attempted to provide simple benchmarks for ‘turnover’ and ‘location’ of currency trading, and highlight some important cases of deviations from those benchmarks. Their report shows that as the GDP rises, a currency trades in greater multiples of the home economy’s underlying international trade (“financialisation”) and trades to a greater extent outside its home market (“internationalisation”). 2.18 On the basis of the relationship between turnover and income, Indian rupee stands out, as it trades more in proportion to India’s trade (exports and imports) and income. This may partly be explained by the relatively large outright foreign investments in India’s equity market and also by the rapid growth in onshore rupee futures market. Also, the turnover in Indian rupee, which is high-yielding, benefits from ‘carry trade’ strategies in forward markets (both deliverable and non-deliverable) and futures (Galati et al (2007)). The relatively higher financialisation of the Indian rupee compared to the Chinese renminbi reflects the more liberal foreign exchange regime put in place in India. India has already achieved current account convertibility and has a more open capital account. Increasing reliance by corporates on foreign currency borrowing 2.19 The two track growth and divergent course of monetary policy followed in EMEs vis-à-vis AEs has led to an ever-widening interest rate differential. This has natural implications for interest rate-sensitive capital flows into the EMEs (Chart 2.17). Over the past few months, there has been a discernible increase in External Commercial Borrowings (ECBs) registered with the Reserve Bank, both under the Automatic as well as the Approval Routes (Table 2.1) and the aggregate ECB flows for 2010-11 were almost at the pre-crisis levels. Increased reliance by corporate on foreign currency funding also increases the currency mismatches in their balance sheets.
Substitution of domestic bank credit 2.20 Bank credit has historically been the dominant funding source for corporate in India. However, with the easy access to foreign currency credit and availability of alternate domestic funding channels, particularly the corporate debt market, some amount of disintemediation in the financial system is already evident. An internal study was conducted to empirically show the relationship between ECB and corporate bond outstandings and the outstanding bank credit Granger Causality test under VAR(1)7 framework has been used for this study. The first difference of log of all the three variables was taken for the modeling exercise. The result for Granger Causality of changes in outstandings of corporate bond and ECB to bank credit outstandings is presented in Table 2.2, whereas, estimated parameters for bank credit equation is shown in Table 2.3.
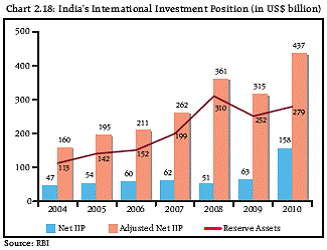
2.21 It may be observed that the null hypothesis that corporate bonds and ECB jointly do not granger-cause bank credit to change cannot be accepted. In other words, the two variables, ECB and corporate bonds jointly influence bank credit. Further, both, coefficients of ECB and corporate bonds are negative, which implies that a rise in the two variables causes a fall in Rupe denominated domestic bank credit. As access to foreign currency borrowing is regulated in price as well as quantum terms, given the capital account management framework, true disintermediation away from the banking system would be critically contingent on the development of a deep corporate bond market. Growing currency mismatches of the national balance sheet 2.22 The trend of greater reliance on external borrowings by firms in India over the years is showing up on the country’s International Investment Position (IIP). The non-official sector’s exposure to currency risk has increased in the last few years, with an increasing net liability position vis-à-vis non-residents (Chart 2.18). Foreign claims on Indian assets denominated in Indian rupee is far greater than that of residents in foreign currency denominated overseas assets. India’s net external liabilities have increased from US$ 47 billion as on March 31, 2004 to US$ 158 billion as on March 31, 2010. It may be mentioned that these external liabilities include the foreign currency loans given by overseas branches of Indian banks to domestic corporates. There has been a consistent increase in such borrowings over the past few years (Table 2.4).
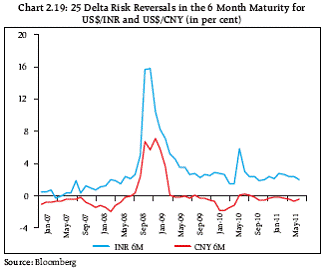
2.23 The net liability of the non-official sector (referred to as the Adjusted net IIP in the chart), has risen even more from US$ 160 billion to US$ 437 billion. This means that the aggregate translation risk for the non-official sector arises from a depreciation of the local currency, i.e. the Indian rupee. China has a net asset position on its IIP. Its net IIP improved from US$ 1.2 trillion in 2007 to US$ 1.8 trillion in 2009 and its exposure is to an appreciation of its local currency, the Renminbi. The contrasting risk exposures of the national balance sheets can be observed in the prices for 25 delta risk reversals8 on the exchange rates. For Indian rupee, the figure is always positive whereas for the Chinese renminbi, which is aided by a surplus on the current account, it rose above zero only during extreme risk aversion of 2008-09 (Chart 2.19).
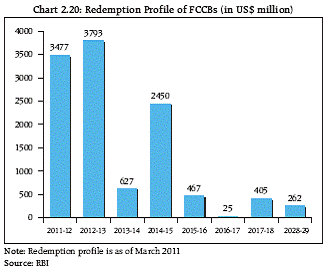
Rising refunding risks of corporates 2.24 During the three financial years in 2005-06 to 2007-08, Indian firms raised foreign capital through Foreign Currency Convertible Bonds (FCCBs) which were very popular at the time. The conversion price on such bonds was 25 - 150 per cent higher than the prevailing stock price at the time of issuance and they carried zero or very low coupons. This is reflected by the consistent growth in FCCB issuance during 2005-08. FCCB proceeds were meant for overseas acquisition (19 per cent) and import of capital goods (16 per cent) as per returns filed by firms. 2.25 FCCBs, which are normally issued for a maturity period of more than five years, worth more than US$ 7 billion are maturing by March 2013 (Chart 2.20). Of these, CRISIL estimates that “FCCBs worth ` 220 - 240 billion may not get converted into equity shares, as the current stock prices of issuing companies are significantly below their conversion prices… The Nifty is now only about 10 per cent below its highs in January 2008. But many of these companies, accounting for more than half of the outstanding FCCBs, are trading at a discount of more than 50 per cent to their January 2008 prices”. More than a few firms potentially face severe funding problems in the next two years which may not remain confined to their industries.
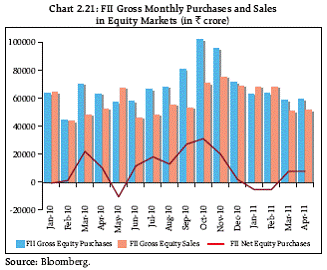
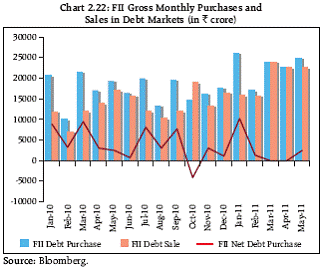
Herd behaviour of portfolio capital 2.26 During 2010, Indian capital markets received a very significant amount of net portfolio capital flows (US$ 29 billion in equities and US$ 10 billion in debt) apart from a large sum under the heads of ECB and trade credit. In particular, between August and October 2010, as much as US$ 18 billion was received under portfolio equity capital. IMF has stated9 that “Econometric results suggest portfolio flows to emerging markets tend to be persistent and have high degrees of autocorrelation… High persistence in flows is often attributed to herding behaviour”. 2.27 To test for persistence of flows, autocorrelation exercise for capital flows into India was done for various time periods beginning 2007 (Table 2.5). It shows that portfolio equity flows are autocorrelated (in a statistically significant manner) while that of debt flows are not in the first and second order (Lags of 1 and 2 in daily observations). Net overall portfolio flows too are autocorrelated (statistically significantly) for all periods, presumably being dominated by equity flows. Debt FII flows into government and corporate bond markets in India face overall caps. 2.28 The study shows that capital flows tend to be influenced by past behaviour. The inflow of funds into EM countries, like India, is often self reinforcing with success in initial investments by a fund leading to further allocation by the same fund as well as emulation by others. Likewise, withdrawal at times of stress by a few becomes more widespread owing to herd behaviour even when fundamentals do not warrant action by all. The strains arising out of Middle East and North Africa (MENA) discussed above have unsettled global markets and a return to higher volatility and risk aversion cannot be ruled out. Debt inflows have offset equity outflows 2.29 While equity market in India has corrected lower with FII investors pulling money out of it, the bond markets have been relatively stable. FII net outflows from equity market in January and February 2011, has been more than offset by the bond market net inflows (Charts 2.21 and 2.22). The inflows into bond market can be attributed to the recent expansion of limits for FII investment in corporate bonds and the fact that tight liquidity conditions in the interbank markets have propelled bond yields to attractive multiyear highs.
2.30 The pursuit of easy monetary policy by the US Fed and the other central banks and the resultant global liquidity has had little impact on the domestic macroeconomic situation so far. The Reserve Bank is committed to use a prudential mix of policy instruments to contain any adverse impact of such policies. At the same time, it is recognised that the global recovery will not be firmly established unless and until the US economy is surely and irreversibly restored to its potential growth and low unemployment levels prevalent pre-crisis. Any US domestic policy framework which makes this possible is in interest of the EMEs and the adverse fallouts of policies undertaken to achieve that have to be addressed with appropriate policy instruments available at the latter’s disposal. Smart Order Routing (SOR) in Indian equity facilitates algotrading 2.31 Based on the proposal received from stock exchanges and market participants, Securities and Exchange Board of India (SEBI) has introduced the facility of SOR which allows the brokers’ trading engines to systematically choose the execution destination based on factors viz. price, costs, speed, likelihood of execution and settlement, size, nature or any other consideration relevant to the execution of the order10. This facility would help brokers execute client orders efficiently by providing the best price available across multiple trading venues (Stock Exchanges) through the use of High Frequency Trading (HFT) or Algotrading (Box 2.1). Indian securities market has shown remarkable resilience to systemic events previously. It would need to guard against ‘flash crashes’ of the kind that rattled US equity markets on May 6, 2010. Forecast of FSI suggests benign conditions until August 2011 2.32 The Financial Stress Indicator is a measure that is designed to capture the contemporaneous severity of the developments as they transpire in equity markets, bond markets, foreign exchange markets and the banking sector. In order to forecast FSI, univariate time series models (ARIMA, ARCH, and GARCH) has been used to forecast each of the component indicators of the FSI. The projected FSI for the period until August 2011 is well below the constructed threshold value11 of 0.9 (Chart 2.23).
Box 2.1 Algorithm trading / High Frequency Trading Trading in financial markets has changed substantially with the growth of new information processing and communications technologies over the last two decades. Algorithmic trading, in the context of trading on modern (electronic platform based) financial markets, refers to an automated trading process using computer programs (algorithms) for making certain trading decisions (timing, price, order - type and quantity), submitting and managing trading orders. In Algorithmic (‘Algo’) trading, traders connect their computers directly with trading systems of exchanges known as electronic communication networks (ECNs) or Smart Order Routing (SOR). A computer algorithm then monitors streaming price quotes and other relevant information on different ECNs and places orders without human intervention. High Frequency Trades are conducted in all asset classes - equities, derivatives, currency and fixed-income. According to some estimates, at present, HFT accounts for 70- 80 per cent of trading volume in US and 40 per cent of trading volumes in Europe for equities. The “flash crash” of May 6, 2010 is widely reported as a case that illustrates markets’ vulnerabilities linked to HFT related practices. The May 6, 2010 ‘flash crash’, a stock market crash event, in which the Dow Jones Industrial Average (DJIA) fell about 900 points, is the second largest intraday point swing in its history. Though the Index recovered those losses within minutes, a joint report of the Securities Exchange Commission and the Commodity Futures Trading Commission detailed how the HFT systems started selling the E - Mini S&P 500 contracts aggressively, accelerating the effect of an unusually large sale by a mutual fund and contributing to the sharp price declines that day. As compared to the developed markets (US and Europe), HFT is at an early stage in India but Algorithmic trading is picking up fast since the Securities and Exchange Board of India (SEBI) approved the use of Algotrading in April 2008. The National Stock Exchange (NSE) and the Bombay Stock Exchange (BSE) have invested in necessary technological platforms to facilitate HFT and have offered the ‘co-location’ facility (whereby the members can house their servers at / near the exchange’s system-engine to save precious microseconds in execution of an order) to interested members. Concluding Remarks 2.33 The macrofinancial environment for stability has improved in the last few months since the release of the previous FSR. There are, however, lingering concerns, some of which have aggravated since then. The sovereign debt situation in Europe appears to be spreading to the rest of the AEs which are bigger and have much greater systemic significance. Robust demand and growth in EMEs have strong structural and cyclical impetus to commodity prices but the increasing financialisation of commodity markets together with higher speculative interest might be distorting the tradeoffs between inflation and growth for many AEs and EMEs and escalating volatility. This in turn causes shocks from commodity markets to spread to other markets. If bond market sentiments were to turn, particularly, on fears of inflation, banking and financial institutions in AEs which are still recovering from the financial crisis could be hit hard. The impact of the two major systemic events of the period under review, viz. conflict in Libya (and unrest in MENA) and the Japanese earthquake has been limited so far. If tensions in MENA continue or spill over into bigger economies in the region, the impact on Indian financial markets would be difficult to contain, particularly because India’s fiscal improvement is expected to slow this year. 2.34 In India, the higher inflation and the attendant rate hikes have increased the attractiveness of overseas borrowing in terms of interest rate differential and availability of credit. Firms are exploring overseas markets to raise money even without offsets for the foreign currency liabilities that follow. Moreover, many of them face bunched up maturities on FCCBs in the next two years. The high and growing net external liability position of residents exposes the country to the risk of a sharp fall in the currency. Any potential adverse fallout of accommodative monetary policies pursued elsewhere need to be addressed with appropriate policy action. 1 DXY or the Dollar index indicates the international value of the US dollar against a basket of 6 major world currencies. The Euro has the highest weight in the index at 57.6 per cent followed by Japanese yen at 13.6 per cent, Pound sterling at 11.9 per cent, Canadian dollar at 9.1 per cent, Swedish krona at 4.2 per cent and Swiss franc at 3.6 per cent. An increase in its value suggests appreciation of the US dollar. 2 ADXY is the Bloomberg - JP Morgan Asia Dollar index that is a trade and liquidity weighted index of ten Asian currencies against the US dollar. Chinese yuan has the highest weightage at 35.9 per cent and that of Indian rupee is at 7.8 per cent. An increase in its value suggests depreciation of the US dollar. 3 President Trichet’s press conference after the rate setting meeting is a key event for financial markets that pick on the use of the phrase “strong vigilance” in relation to price stability objective as a signal for further rate hikes. Reluctance of President Trichet to use the phrase led to disappointment in the market about the pace of rate hikes. 4 Each component in various segments of commodities in the chart is as per the composition of the Reuters - Jeffries CRB Index. 5 The FSI is designed to capture the contemporaneous severity of the developments as they transpire in equity markets, bond markets, foreign exchange markets and the banking sector. Financial stress is defined as the force exerted on economic agents by uncertainty and changing expectations of loss in financial markets and institutions. Stress increases as uncertainty or expectation of increase in financial loss increase. The variables are selected for their timeliness, forward looking information and systemic relevance and availability of data. 6 Bloomberg survey of professional forecasters, bank economists and investment analysts before the release of the WPI inflation figures is used. 8 The risk reversal is a skew in the demand for out-of-the-money options at high strikes compared to low strikes and can be interpreted as the option market’s view of the most likely direction of the spot movement over the next maturity date. It is defined as the implied volatility for call options minus the implied volatility of put options on the base currency. In the case of both Indian rupee and Chinese yuan, the base currency is US dollar. A positive number means that market participants are willing to pay a slightly higher price to buy call options on US dollars when compared to put options on US dollars and vice versa. 9 Global Financial Stability Report, October 2010 10 Source : Securities and Exchange Board of India 11 An indicator is said to issue a signal of stress whenever it exceeds a given threshold level. Threshold levels are chosen so as to strike a balance between the risk of missing many crises and the risks of having many false signals. These risk situations would happen, respectively, if the signal is issued only when the evidence is overwhelming, and if a signal is issued at the slightest possibility of a crisis. If the threshold is too “tight” to reduce the number of false signals, the type I error (rejecting the null hypothesis of crisis when in fact there is a crisis) is large. In contrast, if the threshold is too “slack,” i.e. too close to normal behaviour, it is likely to catch all the crises but it is also likely to announce many crises that never happened. In this case, the type II error (accepting the null hypothesis of a crisis when in fact there is none) will be large. |
|||||||||||||||||||||||||||||||||||||||||||||||||||||||||||||||||||||||||||||||||||||||||||||||||||||||||||||||||||||||||||||||||||||||||||||||||||||||||||||||||||||||||||||||
पृष्ठ अंतिम बार अपडेट किया गया:


