Motivation 1 |
Corporate Performance – Trends since mid 1990s |
End March |
Sales Growth |
PAT Growth
Working Capital /Sales |
Debt / Sales |
1995 |
20.5 |
59.2 |
21.7 |
34.1 |
1996 |
23.7 |
23.9 |
18.3 |
31.7 |
1997 |
10.4 |
-26.6 |
15.7 |
33.7 |
1998 |
7.5 |
-13.7 |
12.0 |
36.6 |
1999 |
6.1 |
-20.9 |
13.8 |
39.8 |
2000 |
11.2 |
14.7 |
11.5 |
37.6 |
2001 |
9.9 |
8.3 |
11.3 |
35.0 |
2002 |
-1.3 |
-17.8 |
7.9 |
35.7 |
2003 |
8.5 |
76.2 |
5.5 |
31.4 |
2004 |
16.0 |
59.8 |
3.9 |
26.4 |
2005 |
24.1 |
51.2 |
5.2 |
22.5 |
2006 |
16.3 |
31.7 |
11.1 |
20.2 |
2007 |
26.2 |
45.2 |
.. |
.. |
Note : Working Capital is defined as Current Asset-Current Liabilities;
* Based on abridged results of the corporates; Source: RBI |
Motivation 2 |
Corporate Performance - Recent Trends |
Growth Rates (Per cent) |
|
2005-06 |
2006-07 |
2007-08 |
|
Quarter |
Quarter |
Quarter |
Quarter |
Quarter |
Quarter |
Quarter |
Quarter |
Quarter |
Item |
1 |
2 |
3 |
4 |
1 |
2 |
3 |
4 |
1* |
|
|
|
|
|
|
|
|
|
|
No. of companies |
2,355 |
2,361 |
2,366 |
2,415 |
2,228 |
2,263 |
2,258 |
2,356 |
1,364 |
|
|
|
|
|
|
|
|
|
|
Sales |
18.5 |
16.4 |
13.2 |
19.5 |
25.6 |
29.2 |
30.3 |
22.5 |
19.0 |
|
|
|
|
|
|
|
|
|
|
Total Expenditure |
18.0 |
16.3 |
12.7 |
18.9 |
24.6 |
26.6 |
26.9 |
19.5 |
19.0 |
|
|
|
|
|
|
|
|
|
|
Gross Profits |
32.0 |
19.1 |
21.2 |
16.6 |
33.9 |
45.9 |
51.8 |
39.2 |
27.9 |
|
|
|
|
|
|
|
|
|
|
Interest Cost |
-13.5 |
-8.0 |
4.6 |
3.8 |
19.9 |
18.0 |
11.9 |
32.3 |
2.8 |
|
|
|
|
|
|
|
|
|
|
Profits after tax |
54.2 |
27.5 |
27.0 |
15.1 |
34.7 |
49.4 |
59.5 |
39.6 |
32.6 |
|
|
|
|
|
|
|
|
|
|
* Provisional;
Source: Reserve Bank of India |
Profit Shares (% to GDP)
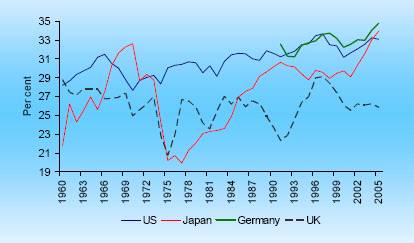
Note: Data are annual from 1960 to 2005.
Source: Ellis and Smith (2007), BIS Working Paper.
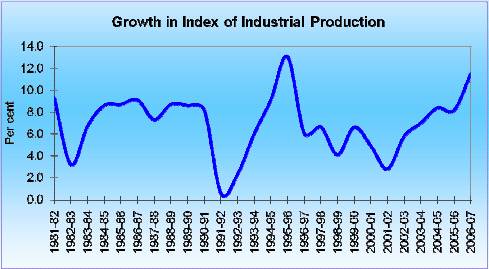
Facts and the Issues
Facts
- Initial Growth in 1990s
- Deceleration during the latter part of 1990s
- Remarkable Recovery of Corporate Profitability since 2002
• Issues
– Is this sustainable?
– Is this Policy Induced?
Scheme of Presentation
• Correspondence between
- Policy
- Corporate Performance
• Policies
1. Industrial Deregulation
2. Trade Liberalization
3. Tax Policy
4. Monetary Policy
5. Financial Sector Strengthening
6. Capital Market Deepening
• Concluding Remarks
Some Conjectures On “Relating Corporate Performance to Economic Reforms”
1. Industrial Deregulation And Corporate Performance
Industrial Deregulation
• Elimination of Capacity Licencing
• Dereservation of industries reserved for Public Sector
• Removal of MRTP Act and Restrictions on Large Companies
• Termination of Phased Manufacturing Programmes
• Better Access to Foreign Technology
• Revision of Patent Regime
• Freeing of Foreign Direct Investment
• Programme of SSI Dereservation
Industrial Performance
Growth of Corporate Sector: Population
|
|
Estimated Paid-up Capital |
Year ended March |
No. of Companies |
Rs. Billions |
% of GDP |
1982 |
72402 |
189 |
11.1 |
1987 |
140670 |
440 |
14.0 |
1992 |
250361 |
846 |
12.9 |
1997 |
450950 |
1905 |
13.8 |
2002 |
589246 |
4058 |
17.8 |
2003 |
612155 |
4571 |
18.7 |
2004 |
641512 |
4988 |
18.1 |
2005 |
679649 |
6540 |
21.0 |
2006 |
732169 |
.. |
.. |
Sources: Department of Company Affairs, 50th Annual Report on the
Working and Administration of the Companies Act, 1956. |
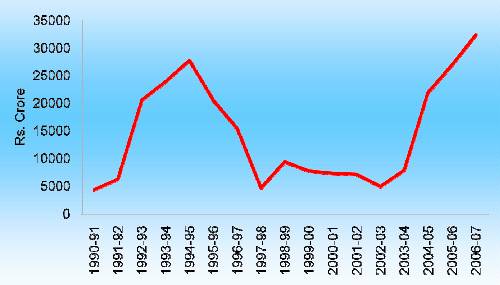
Industrial Investment: Number of Proposals
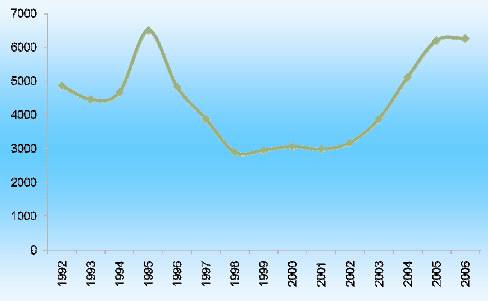
Marked improvements in investments in recent times
Data are on calendar year basis
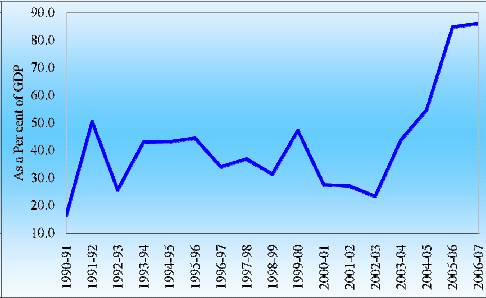
Proposed Industrial Investment: Amount
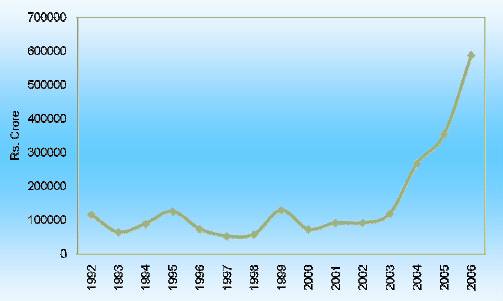
Marked improvements in investments in recent times
Data are on calendar year basis
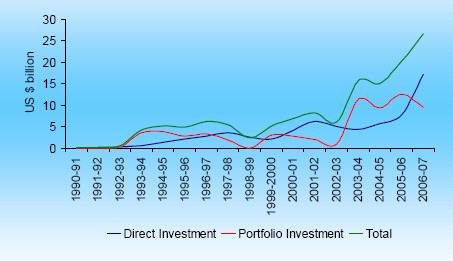
FDI and Portfolio Flows to India
India’s Direct Investment Abroad
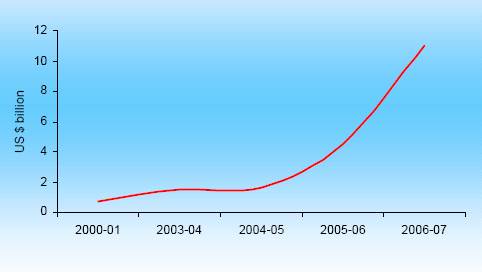
Technology-related Payments
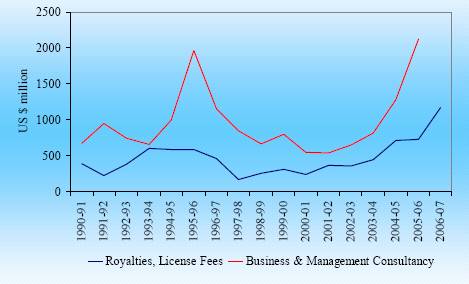
Source: Balance of Payments Statistics, RBI
2 Trade Liberalization And Corporate Performance
Import Liberalization Initiatives- 1
• Moving away from Import Substitution
• Phasing out of Quantitative Restrictions on imports
• Reduction in and simplification of tariff structure
Import Liberalization Initiatives- 2
• Sharp Reduction in Customs Duty Rates
• Simple Average of Basic Duty Rates
-
1991-92: 128 per cent
- 2004-05: 22 per cent
- 2007-08: Peak duty reduced to 10 per cent for non-agricultural goods
• Collection Rate (import revenue to value of imports ratio)
• Distribution of Duty Rates Has Changed Remarkably
- 1991-92: 4100 out of 5200 commodities Basic Rates above 100 per cent 2004-05:
- 4261 out of 5144 commodities Basic Rates Below (BRB) 25 per cent
- 2007-08: 8537 out of 10084 commodities BRB 25 per cent
Exchange Rate Management
• Initial Ex Ante Real Devaluation
• Switch to a market determined exchange rate regime since 1993
• Focus on management of volatility without fixed rate target.
• Underlying demand and supply conditions determine the exchange rate movements in an orderly way
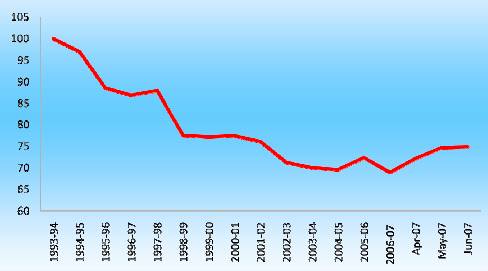
Movement of Exchange Rate
NEER Trade 6 country (1993-94=100)
Movement of Exchange Rate
REER Trade 6 country (1993-94=100)
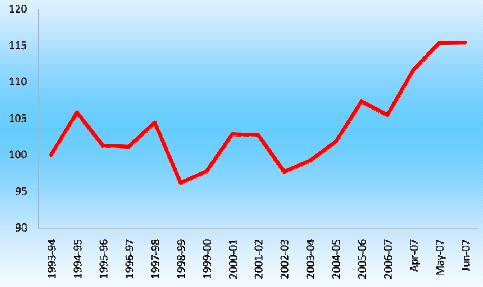
Ex Ante Real Devaluation in the mid 1990s
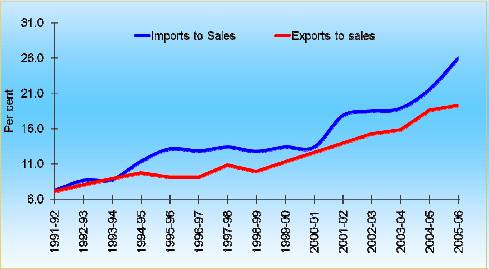
Export Intensity and Import Intensity – All Companies
Export Intensity and Import Intensity of the Indian Corporates |
Amount in Rs. crore |
Year |
Number of |
Sales $ |
Earnings in |
Imports |
Forex |
Imports to |
|
companies |
|
Foreign |
|
Income to |
Sales |
|
|
|
Currencies |
|
Sales |
|
1991-92 |
1802 |
107026 |
8693 |
7692 |
8.1 |
7.2 |
1992-93 |
1802 |
120120 |
10902 |
10350 |
9.1 |
8.6 |
1993-94 |
1720 |
127823 |
13069 |
11185 |
10.2 |
8.8 |
1994-95 |
1720 |
154087 |
17110 |
17452 |
11.1 |
11.3 |
1995-96 |
1930 |
212241 |
22643 |
27792 |
10.7 |
13.1 |
1996-97 |
1930 |
234284 |
26881 |
30073 |
11.5 |
12.8 |
1997-98 |
1848 |
246610 |
33924 |
33006 |
13.8 |
13.4 |
1998-99 |
1848 |
261553 |
33664 |
33361 |
12.9 |
12.8 |
1999-00 |
1927 |
284761 |
40310 |
38039 |
14.2 |
13.4 |
2000-01 |
1927 |
312961 |
50719 |
41791 |
16.2 |
13.4 |
2001-02 |
2031 |
322151 |
61142 |
57471 |
19.0 |
17.8 |
2002-03 |
2031 |
349667 |
71245 |
64584 |
20.4 |
18.5 |
2003-04 |
2214 |
442743 |
90437 |
83500 |
20.4 |
18.9 |
2004-05 |
2214 |
549449 |
128721 |
118608 |
23.4 |
21.6 |
2005-06 |
1831 |
565444 |
137200 |
147270 |
24.3 |
26.0 |
$ Net of 'rebates and discounts' and 'excise duty and cess' |
Imports/Sales & Exports/Sales Ratio - All Companies
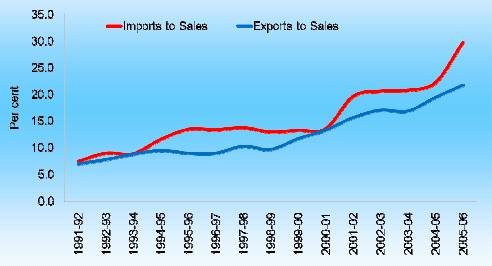
Imports/Sales & Exports/Sales Ratio -Manufacturing Companies
3. Tax Policy And Corporate Performance
Key Reforms Affecting Corporate Performance
• Reduction of Corporate Tax
• Tax on pidends
• Rationalization of Excise Duties
• Reduction in Customs Duties
Rates of Corporate Tax (Per cent) |
Year Tax Rate on Domestic Companies |
1991-92 |
40* and 50** |
1992-93 |
45* and 50** (15) |
1993-94 |
45* and 50** (15) |
1994-95 |
40 (15) |
1995-96 |
40 (15) |
1996-97 |
40 (7.5) |
1997-98 |
35 |
1998-99 |
35 |
1999-00 |
35 (10) |
2000-01 |
35 (10) |
2001-02 |
35 (2) |
2002-03 |
35 (5) |
2003-04 |
35 (5) |
2004-05 |
35 (2.5) |
2005-06 |
30 (10) |
2006-07 |
30 (10) |
2007-08 |
30 (10) |
* Widely held (in which public are substantially interested);
** Closely held (in which public are not 27 substantially interested)
Note: Figures in parentheses represent surcharge. |
Tax on pidends
1998
- Tax on Shareholders pidends Abolished
- pidend Distribution Tax (DDT) Introduced
2002
- Tax on Shareholders pidends Re-introduced
2003
- Tax on shareholders pidends Abolished
- DDT Re-introduced (12.5 per cent)
2004
- DDT Increased to 20 per cent.
2007
- DDT raised from 12.5 per cent to 15 per cent.
1999
• 11 major ad valorem rates reduced to 3 rates
2000
• Uniform CENVAT of 16%; SED at 8%, 16% and 24% on specified goods.
2001
• SED at a single rate of 16 per cent.
2002
• SED abolished on all except 8 items.
2003
• SED on select items down from 16% to 8%
2004
• Convergence to a mean CENVAT of 16%
2005
• Of the 5 items attract 24%, duty reduced to 16% for three items
2006
• Duty reduced to 16% for the remaining two items
2007
• No change in the CENVAT rate (16 %).
Customs Duty Rate – Peak Rate (%)
Year |
Peak Rate* |
1991-92 |
150 |
1992-93 |
110 |
1993-94 |
85 |
1994-95 |
65 |
1995-96 |
50 |
1996-97 |
50 |
1997-98 |
40 |
1998-99 |
45 |
1999-00 |
40 |
2000-01 |
38.5 |
2001-02 |
35 |
2002-03 |
30 |
2003-04 |
25@ |
2004-05 |
20 |
2005-06 |
15 |
2006-07 |
12.5 |
2007-08 |
10 |
* On Non-Agricultural Goods
@ Reduced to 20 per cent in January 2004. |
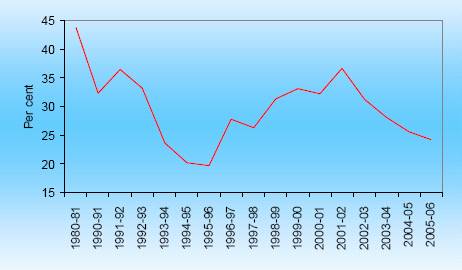
Impact of Fiscal Policy on Corporate Performance
Year |
PAT/Net Worth |
Tax provision / |
Retained Profits / |
pidends / Net |
|
(Per cent) |
PBT (Per cent) |
PAT (Per cent) |
Worth (Per cent) |
1980-81 |
14.2 |
43.8 |
61.8 |
5.4 |
1990-91 |
13.5 |
32.4 |
62.8 |
5.0 |
1991-92 |
12.0 |
36.5 |
62.2 |
4.5 |
1992-93 |
8.7 |
33.3 |
53.9 |
4.0 |
1993-94 |
12.0 |
3.7 |
67.6 |
3.9 |
1994-95 |
14.0 |
20.2 |
72.2 |
3.9 |
1995-96 |
14.4 |
19.7 |
73.6 |
3.8 |
1996-97 |
9.5 |
27.8 |
64.0 |
3.4 |
1997-98 |
7.6 |
26.3 |
63.0 |
2.8 |
1998-99 |
5.6 |
31.4 |
52.3 |
2.7 |
1999-00 |
6.3 |
33.2 |
47.6 |
3.3 |
2000-01 |
6.5 |
32.3 |
48.8 |
3.3 |
2001-02 |
5.1 |
36.7 |
30.9 |
3.5 |
2002-03 |
8.7 |
31.3 |
56.3 |
3.8 |
2003-04 |
13.2 |
28.1 |
59.8 |
5.3 |
2004-05 |
16.8 |
25.7 |
71.7 |
4.8 |
2005-06 |
16.7 |
24.3 |
73.4 |
4.5 |
|
|
|
|
31 |
Tax Provision/Profits Before Tax
Any Pattern?
Why this Steady Fall?
Note: Sales Include excise duty.
Impact of Tax Policy - No Obvious Correlation between Tax Policy and Corporate Profitability or Tax Payments
- Business Cycle Appears More Important
- High Profitability 1992-96
- Low Profitability 1997-2003
- Recovery Thereafter
- Puzzle : Steady Fall in Excise Duty Payments
4 Monetary Policy And Corporate Performance
How were the 1980s?
| Till the late 1980s: |
Resulted in: |
• |
Government Raised Funds
Below Market Rate |
• |
Distorted interest rate mechanism |
|
|
• |
Automatic Monetisation |
• |
Automatic Fiscal
Accommodation through Ad
hoc T-bills |
• |
Adversely affected the viability and
profitability of banks |
• |
CRR Used to Manage
Liquidity |
• |
Transparency, accounting and
prudential norms could not be
strictly followed in banking
operations |
• |
SLR Used to Ensure
Subscription |
|
|
• |
No Depth in G-Securities
Market |
• |
Lack of incentive to seek efficiency |
• |
Segmented and Under
developed Financial Markets |
• |
Complex Interest Rate Structure |
• |
Paucity of Instruments |
• |
Gross inefficiencies at the micro
level |
• |
Administered Interest Rate
Regime |
|
|
• |
Regulation of Deposit Rates |
• |
Non-transparent accounting of
intra-public sector financial
transactions |
Interest Rate Deregulation –Deposit Rates
April 1992
- Interest Rates Freed between 40 days and 3 years. But ceiling prescribed
October 1995
- Ceiling removed for Deposits over 2 years
July 2, 1996
- Ceiling removed for Deposits over 1 year
October 22, 1997
- Interest Rates on Term Deposits Completely Deregulated
October 2004
- Minimum Maturity for Term Deposits Reduced to 7 days
Interest Rate Deregulation –Lending Rate I
April 1992
• Six Categories of Lending Rates
• 5 slabs for below Rs.2 lakh
• Minimum Lending rate Above Rs.2 lakh
October 1994
• Lending Rate freed for Loans above Rs.2 lakh & Minimum Rate Abolished
October 1996
• Banks to specify Maximum spread over PLR
October 1997
• Separate PLRs permitted for cash credit/demand loans and term loans above 3 years.
Floating Rate permitted.
April 1998
• PLR made ceiling for loans upto Rs.2 lakh
Interest Rate Deregulation -Lending Rate II
April 2000
• Tenor Linked PLR Introduced
April 2001
• PLR made benchmark rate; Sub PLR permitted for loans above Rs.2 lakh
April 2002
• Bank-wise PLRs made transparent on RBI website
April 2003
• Computation of Benchmark PLR rationalized; Tenor Linked PLRs abolished
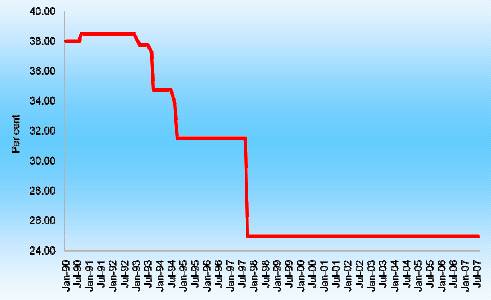
Statutory Liquidity Ratio (SLR) since 1990 (% of NDTL)
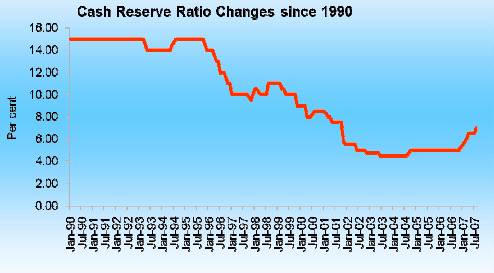
Prescribed Cash Reserve Ratio (CRR) –Per cent of NDTL
Note: With effect from October 29, 2004, nomenclature of Repo and Reverse Repo has been interchanged as per international usage.
Repo and Reverse Repo Rates
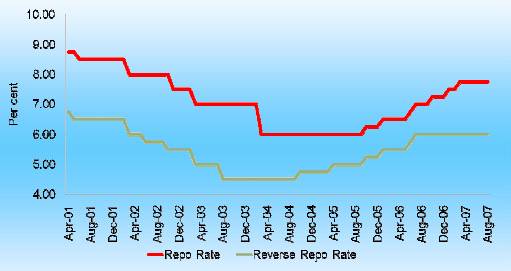
Note: With effect from October 29, 2004, nomenclature of Repo and Reverse Repo has been interchanged as per international usage.
Success on Inflation Front –WPI Inflation
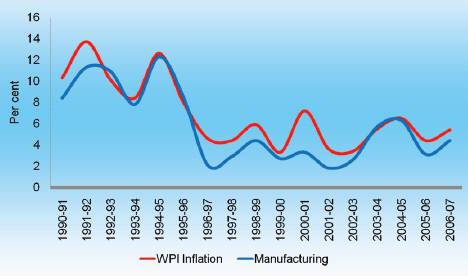
Key Achievement of Monetary Policy
Non-Food Credit
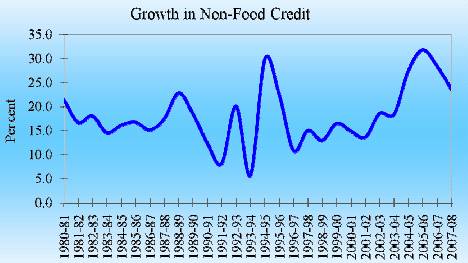
Recovery after 2003
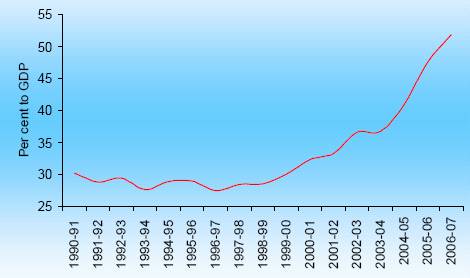
Bank Credit (% to GDP)
Nominal & Real Interest Rates (%)
Item |
1990-91 to |
1996-97 to |
2002-03 to |
|
1995-96 |
2001-02 |
2005-06 |
A. Weighted Average Lending Rate of SCBs |
16.3 |
15.3 |
12.7 |
B. Weighted Average interest rates on Central |
12.3 |
11.6 |
6.6 |
Govt. Securities |
|
|
|
C. Average Cost of Aggregate Deposits of SCBs |
7.2 |
7.4 |
5.3 |
D. Average Cost of Time Deposits of SCBs |
8.9 |
8.9 |
7.0 |
Inflation Rate |
a. WPI |
10.5 |
4.8 |
5.0 |
|
b. WPI-Manufacturing |
9.9 |
2.9 |
4.4 |
|
c. CPI-IW |
10.4 |
6.8 |
4.0 |
Real Interest Rate |
Borrowers |
6.5 |
12.4 |
8.3 |
|
Central Govt. |
1.8 |
6.8 |
1.7 |
|
Depositors |
-1.5 |
2.1 |
2.9 |
Note: Real Interest Rate for
Borrowers = A - b
Central Govt. Sec = B - a
Depositors = D - c |
Real Interest Rates 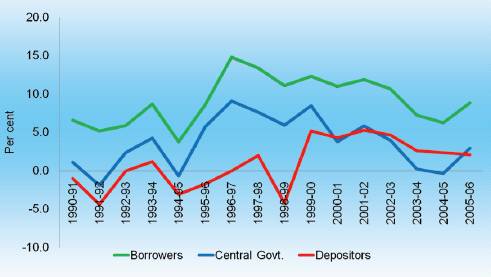
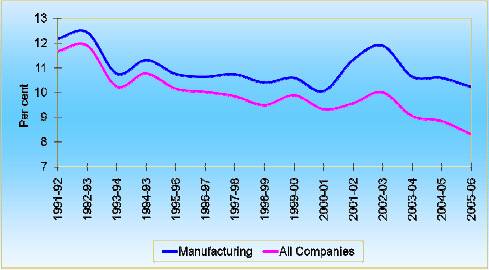
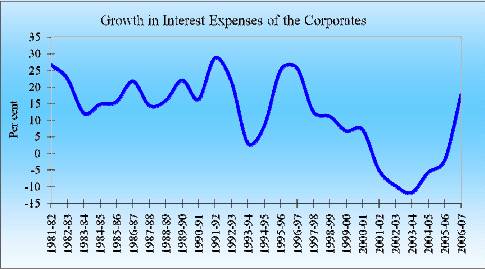
Low Interest Costs -1 Growth in Interest Expenses of the Corporates
Low Interest Costs -2
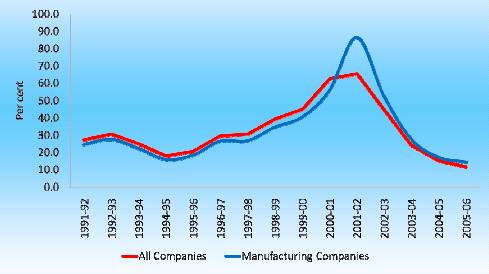
Interest Expenses / Sources of Fund Ratio
Changing Pattern of Sources of Fund
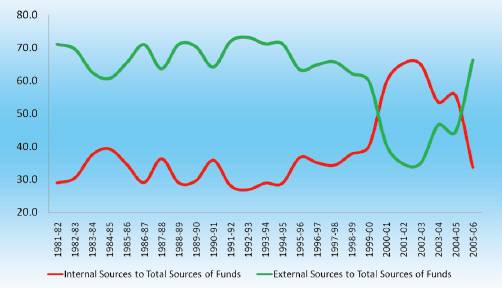
Increasing Reliance on Internal Financing
But External Finance Increasing Again: ECB?
Debt Equity Ratio
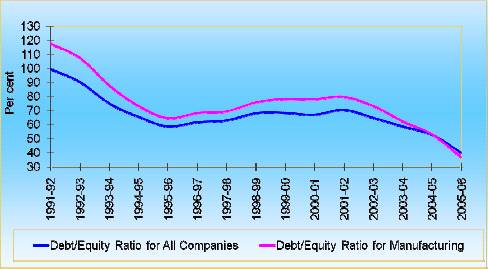
Major Change in Financial Structure of Firms
Liquidity 1: Current Ratio
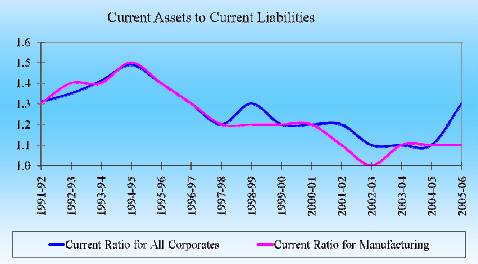
Danger Signs or more efficient financial management?
Liquidity 2: Interest Coverage Ratio*
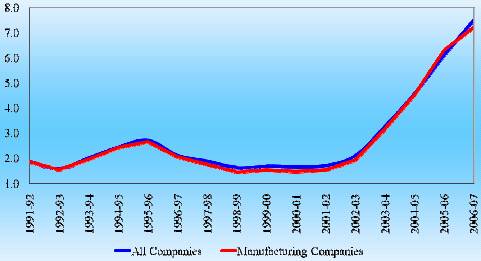
Recent increasing Trend: Recovering from strain to meet debt obligation
* ICR is defined as the ratio of earnings before interest and taxes to interest expenses.
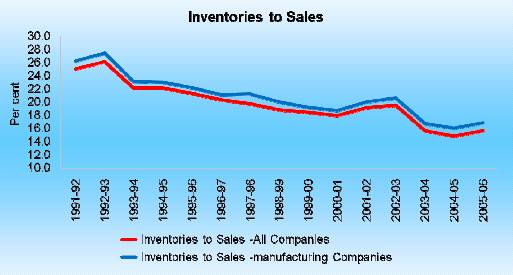
Inventory Management
Capital Formation
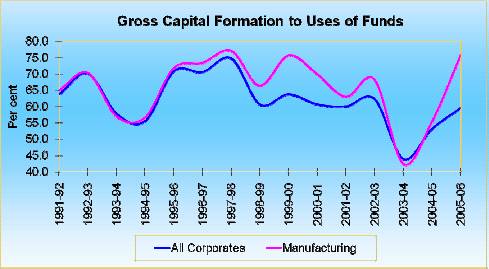
Saving & Investment of Corporate sector
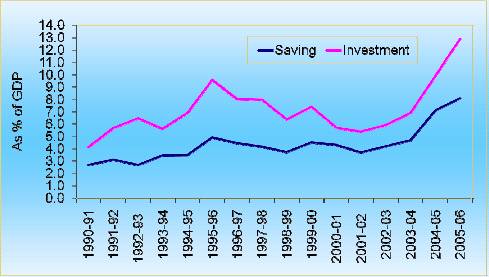
Source: National Accounts Statistics
Monetary Policy and Corporate Performance
• High correlation between real interest rates and corporate behaviour
• Evidence of significant improvements in financial management in response to interest rates movements
• Lower inflation rates and interest rates from 2002 have contributed to improved corporate performance
5 Financial Sector Strengthening And Corporate Performance
Financial Sector Strengthening
• Competition Enhancing Measures
– Operational autonomy and disinvestment of public ownership in public sector banks
– Transparent entry norms for private and foreign banks
– Permission for FDI and portfolio investment in banking
• Strengthening of Prudential Regulation
– Phased implementation of international best practices (CRAR / Provisioning / NPL Norms / Exposure Limits)
– Measures to strengthen risk management
– Guidelines on Ownership and Governance
– KYC and AML Guidelines
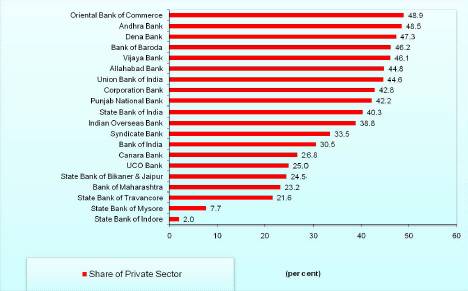
Banking: Capital Structure
20 out of 27 public sector banks raised capital from market up to end-March 2006.
Banking – Asset Quality
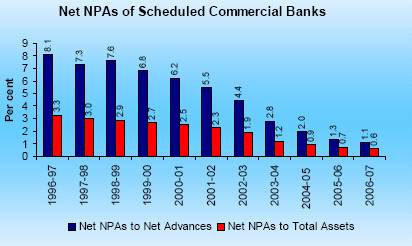
• Marked improvements in asset quality
• Public sector banks showed more credible performance in NPL management than private sector banks
6 Capital Market Deepening And Corporate Performance
Capital Market Deepening
• Establishment of SEBI
• Abolition of Controller of Capital Issues (CCI)
• Removal of Pricing and Issue Control
• Private Sector Mutual Funds
• National Stock Exchange
• Payment & Settlement Architecture
• G-Sec and Bond Market Development
Resource Mobilisation from Primary Market-Public Issues
Market Capitalization
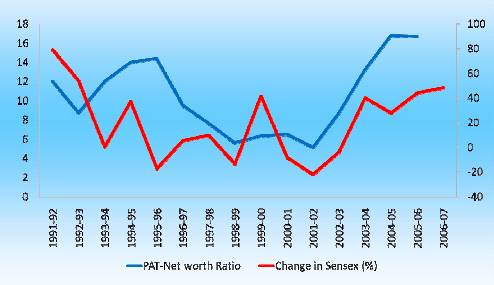
Stock Market and Corporate Profitability:
Has the Stock Market Movement been Rational?
Some Conjectures On “Relating Corporate Performance to Economic Reforms”
Global Growth, Indian Growth & Corporate Sales
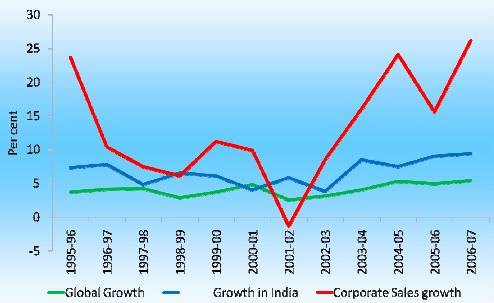
Global Growth rates are on Calendar Year basis, i.e 1995-96 =1995.
Interpreting the Evidence 1
1992-97: Exuberant Response to Deregulation
• Surge in Investment
• New Projects
• Surge in Lending
• Increase in Corporate Profits
• High Industrial Growth
Interpreting the Evidence 2
1997-2002: Loss in Competitiveness
• Significant Slowdown in Industrial Growth
• Investment Slowdown
• Loss in Confidence
• Real exchange rate depreciation catches up
• High Real Interest Rates
• Period of widespread restructuring
Interpreting the Evidence 3
2002-now: Resumption of Growth and Competitiveness 1
• Industrial growth resurfaces
• Boom in Corporate Profitability
• Return of domestic confidence
• Emergence of International Confidence
• Increase in Mergers and Acquisition
Interpreting the Evidence 4
2002-now: Resumption of Growth and Competitiveness 2
• Consequence of restructuring
• Low inflationary expectations
• International business cycles
• Investment buoyant
Thank You
Special Talk by Dr. Rakesh Mohan, Deputy Governor, Reserve Bank of India at FICCI-IBA Conference on “Global Banking:Paradigm Shift”September 14, 2007. |
 IST,
IST,