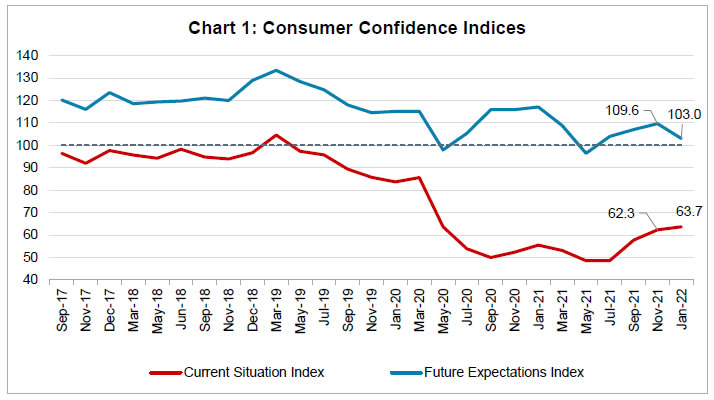
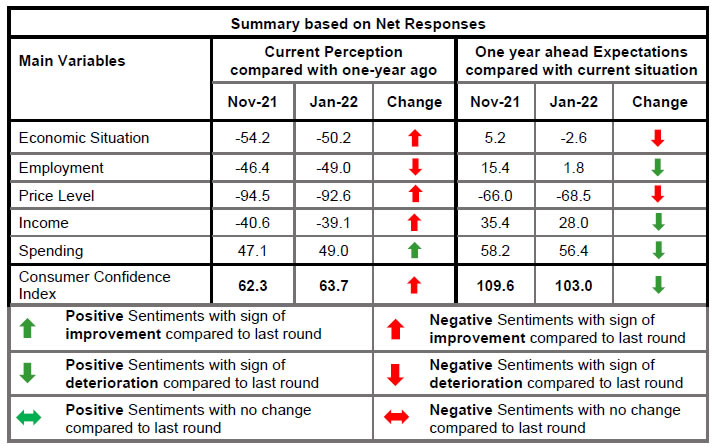
आज, रिज़र्व बैंक ने जनवरी 2022 चक्र के लिए उपभोक्ता विश्वास सर्वेक्षण (सीसीएस)1 के परिणाम जारी किए। यह सर्वेक्षण 02 जनवरी से 11 जनवरी, 2022 के दौरान 13 प्रमुख शहरों, अहमदाबाद; बेंगलुरु; भोपाल; चेन्नई; दिल्ली; गुवाहाटी; हैदराबाद; जयपुर; कोलकाता; लखनऊ; मुंबई; पटना; और तिरुवनंतपुरम, में किया गया। सर्वेक्षण ने इन शहरों में 5,387 परिवारों से सामान्य आर्थिक स्थिति, रोजगार परिदृश्य, समग्र मूल्य स्थिति और स्वयं की आय और व्यय पर वर्तमान धारणा (एक साल पहले की तुलना में) और एक साल आगे की अपेक्षाएँ प्राप्त कीं।2 विशेष: I. वर्तमान अवधि के लिए उपभोक्ता विश्वास ने सर्वेक्षण के लगातार तीसरे चक्र के लिए क्रमिक सुधार दर्ज किया, हालांकि यह निराशावादी क्षेत्र में रहा; सामान्य आर्थिक स्थिति, घरेलू आय और व्यय पर बेहतर भावनाओं के कारण वर्तमान स्थिति सूचकांक (सीएसआई)3 में मामूली वृद्धि हुई (चार्ट 1 और तालिका 1, 5 और 6)। II. एक वर्ष आगे का दृष्टिकोण, जैसा कि भविष्य की अपेक्षाओं के सूचकांक (एफईआई) द्वारा दर्शाया गया है, आशावाद क्षेत्र में बना रहा; हालांकि, नवीनतम सर्वेक्षण चक्र की अवधि के दौरान कोविड-19 संक्रमण के मामलों में वृद्धि होने के कारण सूचकांक में नरमी आई (चार्ट 1 और तालिका 1)। III. परिवारों ने समग्र व्यय में और भी वृद्धि होने की सूचना दी, जो उच्च आवश्यक व्यय के कारण थी; तथापि, गैर-जरूरी परिव्यय पर उनकी भावनाएं संकुचित बनी रहीं (तालिका 6, 7 और 8)। नोट: कृपया समय श्रृंखला डेटा के लिए एक्सेल फ़ाइल देखें
| Table 1: Perceptions and Expectations on the General Economic Situation | | (Percentage responses) | | Survey Round | Current Perception | One year ahead Expectation | | Improved | Remained Same | Worsened | Net Response | Will Improve | Will Remain Same | Will Worsen | Net Response | | Jan-21 | 14.3 | 13.6 | 72.2 | -57.9 | 52.6 | 16.1 | 31.3 | 21.3 | | Mar-21 | 12.1 | 11.9 | 76.0 | -63.9 | 44.0 | 17.3 | 38.7 | 5.3 | | May-21 | 6.5 | 12.1 | 81.4 | -75.0 | 33.2 | 15.3 | 51.5 | -18.3 | | Jul-21 | 9.4 | 12.1 | 78.5 | -69.1 | 39.7 | 15.8 | 44.5 | -4.8 | | Sep-21 | 14.9 | 12.9 | 72.3 | -57.4 | 41.6 | 18.3 | 40.1 | 1.5 | | Nov-21 | 16.6 | 12.7 | 70.8 | -54.2 | 43.9 | 17.4 | 38.7 | 5.2 | | Jan-22 | 17.4 | 15.1 | 67.5 | -50.2 | 40.5 | 16.5 | 43.1 | -2.6 |
| Table 2: Perceptions and Expectations on Employment | | (Percentage responses) | | Survey Round | Current Perception | One year ahead Expectation | | Improved | Remained Same | Worsened | Net Response | Will Improve | Will Remain Same | Will Worsen | Net Response | | Jan-21 | 13.1 | 11.5 | 75.4 | -62.3 | 55.3 | 16.1 | 28.6 | 26.7 | | Mar-21 | 12.9 | 11.8 | 75.3 | -62.4 | 46.7 | 17.3 | 36.0 | 10.7 | | May-21 | 7.2 | 10.8 | 82.1 | -74.9 | 35.4 | 16.1 | 48.5 | -13.0 | | Jul-21 | 10.3 | 11.3 | 78.4 | -68.2 | 42.2 | 16.5 | 41.3 | 0.9 | | Sep-21 | 14.9 | 12.7 | 72.4 | -57.6 | 45.0 | 17.8 | 37.1 | 7.9 | | Nov-21 | 18.8 | 16.0 | 65.2 | -46.4 | 48.6 | 18.1 | 33.3 | 15.4 | | Jan-22 | 17.4 | 16.3 | 66.4 | -49.0 | 41.4 | 19.1 | 39.6 | 1.8 |
| Table 3: Perceptions and Expectations on Price Level | | (Percentage responses) | | Survey Round | Current Perception | One year ahead Expectation | | Increased | Remained Same | Decreased | Net Response | Will Increase | Will Remain Same | Will Decrease | Net Response | | Jan-21 | 88.6 | 9.6 | 1.7 | -86.9 | 73.2 | 17.1 | 9.7 | -63.5 | | Mar-21 | 93.8 | 5.0 | 1.2 | -92.6 | 75.0 | 14.4 | 10.6 | -64.4 | | May-21 | 90.6 | 7.8 | 1.6 | -89.0 | 73.9 | 16.4 | 9.7 | -64.3 | | Jul-21 | 93.1 | 5.6 | 1.3 | -91.9 | 71.3 | 16.9 | 11.8 | -59.5 | | Sep-21 | 92.3 | 6.1 | 1.7 | -90.6 | 74.7 | 15.0 | 10.3 | -64.4 | | Nov-21 | 95.4 | 3.8 | 0.9 | -94.5 | 76.5 | 12.9 | 10.6 | -66.0 | | Jan-22 | 93.8 | 5.0 | 1.2 | -92.6 | 78.0 | 12.4 | 9.5 | -68.5 |
| Table 4: Perceptions and Expectations on Rate of Change in Price Level (Inflation)* | | (Percentage responses) | | Survey Round | Current Perception | One year ahead Expectation | | Increased | Remained Same | Decreased | Net Response | Will Increase | Will Remain Same | Will Decrease | Net Response | | Jan-21 | 83.5 | 13.4 | 3.1 | -80.4 | 77.7 | 17.2 | 5.0 | -72.7 | | Mar-21 | 88.8 | 8.5 | 2.7 | -86.1 | 81.1 | 14.3 | 4.5 | -76.6 | | May-21 | 87.2 | 10.3 | 2.5 | -84.7 | 79.3 | 16.7 | 4.0 | -75.3 | | Jul-21 | 87.9 | 10.4 | 1.7 | -86.3 | 79.7 | 16.3 | 4.0 | -75.8 | | Sep-21 | 88.4 | 9.0 | 2.6 | -85.8 | 81.9 | 13.8 | 4.4 | -77.5 | | Nov-21 | 91.3 | 6.7 | 2.0 | -89.3 | 81.7 | 14.1 | 4.2 | -77.5 | | Jan-22 | 89.1 | 8.1 | 2.8 | -86.2 | 81.3 | 14.0 | 4.7 | -76.6 | | *Applicable only for those respondents who felt price has increased/price will increase. |
| Table 5: Perceptions and Expectations on Income | | (Percentage responses) | | Survey Round | Current Perception | One year ahead Expectation | | Increased | Remained Same | Decreased | Net Response | Will Increase | Will Remain Same | Will Decrease | Net Response | | Jan-21 | 9.9 | 29.2 | 60.9 | -51.0 | 51.3 | 38.8 | 9.9 | 41.4 | | Mar-21 | 7.9 | 30.5 | 61.6 | -53.7 | 46.4 | 40.7 | 13.0 | 33.4 | | May-21 | 8.4 | 33.1 | 58.5 | -50.1 | 42.5 | 42.1 | 15.5 | 27.0 | | Jul-21 | 6.8 | 27.4 | 65.9 | -59.1 | 44.5 | 41.6 | 13.9 | 30.6 | | Sep-21 | 10.4 | 31.4 | 58.2 | -47.8 | 44.2 | 42.9 | 12.9 | 31.3 | | Nov-21 | 11.7 | 36.1 | 52.2 | -40.6 | 46.7 | 42.0 | 11.3 | 35.4 | | Jan-22 | 11.5 | 37.9 | 50.6 | -39.1 | 42.3 | 43.4 | 14.3 | 28.0 |
| Table 6: Perceptions and Expectations on Spending | | (Percentage responses) | | Survey Round | Current Perception | One year ahead Expectation | | Increased | Remained Same | Decreased | Net Response | Will Increase | Will Remain Same | Will Decrease | Net Response | | Jan-21 | 53.3 | 28.9 | 17.8 | 35.5 | 66.4 | 26.7 | 6.8 | 59.6 | | Mar-21 | 56.6 | 24.9 | 18.4 | 38.2 | 67.0 | 25.3 | 7.7 | 59.3 | | May-21 | 50.6 | 30.3 | 19.2 | 31.4 | 60.5 | 29.9 | 9.6 | 50.9 | | Jul-21 | 51.9 | 27.7 | 20.5 | 31.4 | 62.1 | 28.7 | 9.3 | 52.8 | | Sep-21 | 58.1 | 25.7 | 16.2 | 41.9 | 65.7 | 27.5 | 6.9 | 58.8 | | Nov-21 | 62.5 | 22.2 | 15.4 | 47.1 | 66.0 | 26.1 | 7.9 | 58.2 | | Jan-22 | 62.1 | 24.8 | 13.1 | 49.0 | 64.8 | 26.9 | 8.4 | 56.4 |
| Table 7: Perceptions and Expectations on Spending- Essential Items | | (Percentage responses) | | Survey Round | Current Perception | One year ahead Expectation | | Increased | Remained Same | Decreased | Net Response | Will Increase | Will Remain Same | Will Decrease | Net Response | | Jan-21 | 68.6 | 20.0 | 11.4 | 57.2 | 73.6 | 21.6 | 4.8 | 68.8 | | Mar-21 | 71.1 | 16.0 | 12.9 | 58.2 | 74.6 | 20.0 | 5.4 | 69.2 | | May-21 | 63.2 | 22.3 | 14.5 | 48.7 | 68.1 | 24.6 | 7.3 | 60.8 | | Jul-21 | 66.2 | 19.0 | 14.8 | 51.4 | 71.0 | 22.1 | 7.0 | 64.0 | | Sep-21 | 72.2 | 16.7 | 11.0 | 61.2 | 73.4 | 21.3 | 5.4 | 68.1 | | Nov-21 | 75.8 | 14.4 | 9.8 | 66.1 | 74.3 | 20.2 | 5.5 | 68.7 | | Jan-22 | 76.3 | 15.3 | 8.5 | 67.8 | 74.3 | 19.7 | 6.0 | 68.3 |
| Table 8: Perceptions and Expectations on Spending- Non-Essential Items | | (Percentage responses) | | Survey Round | Current Perception | One year ahead Expectation | | Increased | Remained Same | Decreased | Net Response | Will Increase | Will Remain Same | Will Decrease | Net Response | | Jan-21 | 13.3 | 27.1 | 59.7 | -46.4 | 27.5 | 36.7 | 35.8 | -8.3 | | Mar-21 | 11.9 | 29.5 | 58.5 | -46.6 | 24.7 | 38.3 | 37.1 | -12.4 | | May-21 | 8.7 | 31.5 | 59.7 | -51.0 | 22.2 | 40.7 | 37.1 | -14.9 | | Jul-21 | 8.4 | 27.2 | 64.4 | -56.0 | 21.5 | 37.9 | 40.6 | -19.2 | | Sep-21 | 9.2 | 29.7 | 61.0 | -51.8 | 23.4 | 38.7 | 37.9 | -14.5 | | Nov-21 | 12.1 | 27.7 | 60.3 | -48.2 | 23.4 | 37.1 | 39.5 | -16.1 | | Jan-22 | 13.6 | 31.6 | 54.8 | -41.3 | 22.5 | 39.5 | 38.0 | -15.5 |
|  IST,
IST,