 IST,
IST,
II. Aggregate Demand
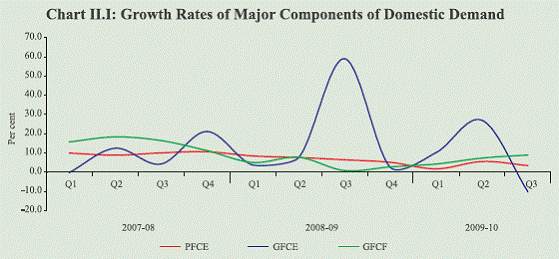
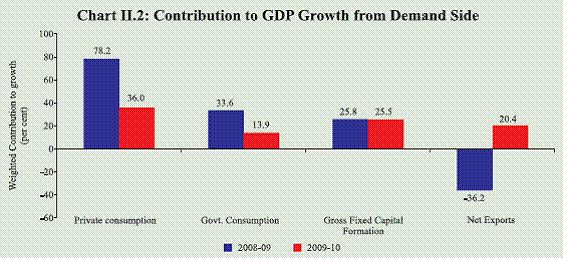
Growth in private consumption demand was subdued in 2009-10, while growth in Government consumption expenditure decelerated. As a result, consumption demand, accounting for about 70 per cent of aggregate demand, is estimated to have grown at 4.8 per cent in 2009-10. Investment demand, in terms of growth in gross fixed capital formation, sustained the recovery seen over last few quarters, though remained below the growth rates seen during the pre-global crisis period. Corporate sales growth witnessed major rebound in the third quarter of 2009-10. The fiscal exit, as planned in the Union Budget for 2010-11, would contribute to improving the overall medium-term growth outlook, even though greater emphasis on quality of fiscal adjustment would be necessary. Stronger pick-up in private consumption and investment demand could be expected to drive and sustain the recovery in growth. II.1 During the recovery phase, trends in private consumption and investment demand become critical, not only for providing information on the strength of the recovery but also for conditioning the timing and the pace of policy exit. Growth in private consumption demand moderated in 2009-10, while growth in Government consumption expenditure decelerated significantly (Chart II.1). Investment demand, in terms of growth in gross fixed capital formation, sustained the gradual recovery seen over the preceding four quarters. In comparison with the significant acceleration in the growth of capital formation during 2003-08, however, the recovery still looks subdued. Net exports during 2009-10 contributed positively to the demand side GDP, unlike in the preceding year (Chart II.2). II.2 Data on corporate performance points to a moderation in the inventory stock to sales ratio, even though that is largely on account of the strong rebound in sales growth in the third quarter of 2009-10, after a phase of significant deceleration over the preceding four quarters. Strong recovery in the growth of consumer durables as per the index of industrial production (IIP) in recent months, along with the pick up in corporate sales suggests stronger revival in consumption demand in relation to the subdued growth seen in the demand side GDP data. In this context, one has to recognise the excessive weight of demand emanating from agricultural growth in the overall demand side GDP data and the associated need for referring to other relevant indicators of consumption demand for drawing policy relevant inferences. In view of the significant deceleration in the Government expenditure planned in the Union Budget for 2010-11, further pick-up in private demand will be important to sustain the recovery seen so far. Domestic Demand II.3 As per the new national accounts statistics series (base: 2004-05), the growth rates of GDP at factor cost for 2008-09 and 2009-10 have been higher than the growth rates of GDP at market prices reflecting the impact of fiscal stimulus measures on declines in net indirect taxes (i.e., indirect tax revenues net of subsidies). Private and Government consumption expenditures have been estimated to grow at a lower rate in 2009-10 over the previous year (Table II.1). Decline in agricultural production affected private consumption demand during 2009-10, which is also reflected in the weakness in production of consumer non-durable goods in the recent period. The overall share of consumption expenditure in GDP at market prices (2004-05 prices) declined from 70.9 per cent in 2008-09 to 69.6 per cent in 2009- 10. More importantly, the contribution of consumption expenditure (both private and Government) to overall GDP growth has been estimated to come down significantly from 111.8 per cent in 2008-09 to around 50 per cent in 2009-10, with declines estimated in both private and government consumption demand (Chart II.2). The contribution of gross fixed capital formation remains almost unchanged. The remaining part of the contribution to overall growth has been estimated to result from a sharp revival in the pattern of net exports (of goods and services). In absolute terms, while imports would exceed exports, the deceleration in the import growth in 2009- 10 has been sharper than the deceleration in export growth. As a result, the share of net exports has been estimated to reverse from (-)36.2 per cent in 2008-09 to 20.7 per cent in 2009-10. II.4 Compared to annual estimates, quarterly data show a stronger moderation in private final consumption expenditure (PFCE) growth in Q3 of 2009-10 over both the preceding quarter and the corresponding quarter of the previous year. This could be attributed to the adverse impact of a decline in agricultural output on both rural income and food prices, and hence on consumption demand. Government final consumption expenditure (GFCE) registered a sharp decline in Q3 of 2009-10 over the comparable quarter of the previous year due to the base effect of fiscal stimulus measures delivered then. Investment demand, however, picked up further during the quarter, alongside the industrial recovery; gross fixed capital formation rose by 8.9 per cent as compared to 0.8 per cent in the corresponding quarter of 2008-09. Demand Management through Fiscal Policy Central Government Finances: 2009-10 and 2010-11 II.5 During 2009-10, even though the expansionary fiscal stance continued in terms of further increase in the key deficit indicators of the Central Government, growth in total expenditure decelerated substantially, led by significant curtailment in the growth of revenue expenditure (Table II.2). A key reason for the enlargement in all the deficit indicators during 2009-10 (RE), despite the moderation in the growth of expenditure was the much lower growth in tax receipts resulting from the cuts in indirect tax rates as well as the revenue impact of slowdown in the economy. Lower indirect taxes, by lowering the prices of manufactured products, however, would have helped in boosting demand indirectly.
II.6 The budgeted plans for 2010-11, recognising the significance of fiscal discipline for medium-term growth and inflation outlook, and also taking into account the clearer signs of recovery in GDP growth, point to the beginning of exit of fiscal stimulus measures in a calibrated manner. This is reflected in envisaged reduction in the size of all the key deficit indicators (Table II.2). The total expenditure is slated to increase at a substantially lower rate than in the previous two years. Growth in capital expenditure, which was raised significantly in 2009-10 has further been revised upwards in 2010-11. This could be expected to aid medium-term growth prospects, despite overall moderation in the growth of Government expenditure. II.7 On the revenue front also, the Budget for 2010-11 has announced partial rollback of the central excise duties on nonpetroleum products and basic duties on petroleum products. The expected increase in prices of manufactured goods following this rollback in indirect taxes may entail some dampening effects on private sector aggregate demand. Along with the impact of decelerated Government expenditure, the support from fiscal policy related measures to aggregate demand, thus, could be much less than in the preceding two years. It needs to be recognised that large fiscal stimulus was a response to an exceptional circumstance, i.e., the risk of contagion from the global crisis weakening domestic growth. But by nature, these measures had to be temporary and rolled back over time to ensure sound fiscal position as a means to sustainable high growth in the medium-term. II.8 Moreover, the Budget announced certain direct tax measures, such as increase in income tax slabs, which would increase the private disposable income by about 0.4 per cent of GDP. This will have some positive impact on aggregate demand. The concessional customs duty, exemption of excise duty and service tax announced in the Budget on a number of items such as select agricultural goods and related sectors, environment friendly products, monorail projects for urban transport, domestic manufacture of mobile phones and medical equipments will also have some positive impact on the private sector aggregate demand, while providing incentive to expand output of these goods.
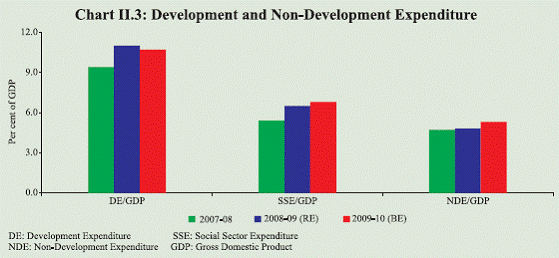
State Finances II.9 The State Governments also recognised the need for enhanced public expenditure in view of the economic slowdown in the second half of 2008-09 (Chart II.3). The increase in revenue receipts by 9.1 per cent in 2009-10 (BE) was lower than the 18.3 per cent rise recorded in 2008- 09 (RE). The economic slowdown also affected the statutory transfer of tax revenues from the Centre to the States. II.10 With a view to encouraging the State Governments to undertake additional capital investments and boost domestic aggregate demand, they were allowed to raise additional market borrowings to the extent of 0.5 per cent of the GSDP in 2008-09 and further 0.5 per cent in 2009-10. However, budget estimates for 2009-10 for capital expenditure do not seem to reflect these developments; capital expenditure as a ratio to GDP is budgeted to decline from 3.8 per cent in 2008-09 (RE) to 3.5 per cent in 2009-10 (BE). An additional factor that influenced State finances during 2009-10 but with positive implications for aggregate demand, is the implementation of the Sixth Central Pay Commission/State Pay Commissions recommendations. Combined Fiscal Position II.11 The fiscal stance during 2009-10 continued to be expansionary in order to boost aggregate demand and thereby contain the pace of economic slowdown. As a result, the combined fiscal deficit of the Central and State Governments during 2009-10 (BE) increased further to 9.7 per cent from 8.5 per cent in 2008-09 (RE) (Table II.3). Higher deficits, though, were not reflected in stronger expansion in public expenditure, since revenue receipts exhibited significant deceleration (Table II.4). Unlike in 2008-09 (RE) when substantial emphasis was placed on boosting government consumption expenditure directly, during 2009-10 (BE), the total expenditure of the combined government decelerated sharply, particularly due to containment of revenue expenditure. Thus, the direct contribution of Government expenditure to the growth in aggregate demand weakened in relation to the previous year. 
Corporate Performance II.12 The moderation in private demand during the phase of economic slowdown was evident from the corporate sales data as well. In the third quarter of 2009-10, however, year-on-year sales growth of select non-financial non-government listed companies was the highest in last five quarters. Seasonally adjusted sequential sales growth over the previous quarter also showed improvement. The rebound in sales growth points to improving private demand. Reflecting the lower interest rate regime, interest expenses declined significantly in the third quarter of 2009-10, which also contributed to the improvement in profit after taxes. Gross and net profits rose by 60 per cent and 99.3 per cent, respectively, in Q3 of 2009-10, which was particularly aided by the low base effect of the same quarter of the previous year when profits had registered significant negative growth (Table II.5). Profit figures were further influenced by the last year’s cost reduction initiatives by the Government. While yearon- year growth in net profits was impacted by low base effect, sequentially net profits rose moderately in Q3 over the previous quarter.
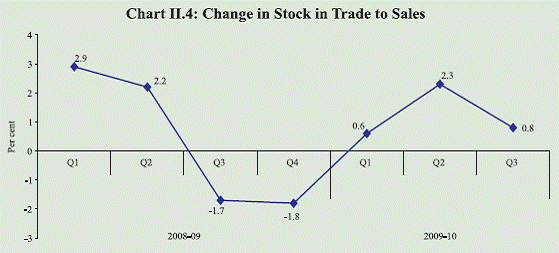
II.13 Reflecting the strong rebound in sales, the change in stocks to sales ratio declined in Q3 of 2009-10 (Chart II.4). The trend depicts the inventory cycle in relation to sales, and hence, a downward movement in the cycle may as much reflect an increase in sales as decrease in inventory stocks. External Demand II.14 Net exports (of goods and services) contributed positively (20.4 per cent) to GDP growth in 2009-10, as against a negative contribution of around 36.2 per cent in 2008- 09 (Chart II.2). This revival in the pattern in the first three quarters of 2009-10 was on account of sharper contraction in imports than in exports, even though in absolute terms, imports continued to exceed exports, thereby yielding negative net exports. Export growth continued to be negative in Q3 of 2009-10, but the rate of contraction had declined over the preceding quarters, indicating signs of recovery in external demand. Import growth continued to shrink at a higher rate than export growth, but the rate of decline, like in the case of exports, moderated in Q3 of 2009-10. The positive contribution of net exports could, however, reverse in the coming year as imports are likely to grow at a faster pace than exports given the prospects of Indian recovery remaining ahead of the global economy. Merchandise trade deficit during April- February (2009-10) stood at US$ 95.7 billion, which was lower by 16.6 per cent than US$ 114.7 billion in April-February 2008-09, due to relatively sharper deceleration in imports than exports during the period. The merchandise trade data also corroborate the reversal in contribution of net exports to growth in demand. A detailed discussion on the external demand conditions is set out in Chapter III. II.15 An overall assessment of trends in aggregate demand and its different components, thus, suggests that while the support of expansionary Government expenditure to economic recovery has started to moderate significantly, private consumption demand needs to exhibit stronger momentum in growth. Investment demand has picked up and could be expected to gain further acceleration. Major rebound in corporate sales growth and robust growth in consumer durables production in the recent period point to recovery in private demand. The Union Budget for 2010-11 indicates that the direct and indirect impact of fiscal policy measures in supporting aggregate demand in 2010-11 would be much less than in the preceding two years. The fiscal exit as planned in the Union Budget for 2010-11, however, would contribute to improving the medium-term growth outlook, and the significantly stronger growth programmed for capital expenditure would also stimulate growth. Alongside calibrated exit from the expansionary fiscal and accomodative monetary policy stances, stronger pick up in private consumption and investment demand would be necessary to sustain the growth momentum. |
|||||||||||||||||||||||||||||||||||||||||||||||||||||||||||||||||||||||||||||||||||||||||||||||||||||||||||||||||||||||||||||||||||||||||||||||||||||||||||||||||||||||||||||||||||||||||||||||||||||||||||||||||||||||||||||||||||||||||||||||||||||||||||||||||||||||||||||||||||||||||||||||||||||||||||||||||||||||||||||||||||||||||||||||||||||||||||||||||||||||||||||||||||||||||||||||||||||||||||||||||||||||||||||||||||||||||||||||||||||||||||||||||||||||||||||||||||||||||||||||||||||||||||||||||||||||||||||||||||||||||||||||||||||||||||||||||||||||||||||||||||||||||
ಪೇಜ್ ಕೊನೆಯದಾಗಿ ಅಪ್ಡೇಟ್ ಆದ ದಿನಾಂಕ:


