 IST,
IST,
III The Real Economy (Part 1 of 2)
Agriculture
Introduction
3.1 During the first three decades after Independence, the Indian economy stagnated around a trend growth of 3.5 per cent. The scenario changed during the 1980s. The acceleration of growth during the 1980s to 5.6 per cent put the Indian economy on a higher growth path. However, the growth process of the 1980s turned increasingly unsustainable as manifested in the growing macroeconomic imbalances over the decade in the form of high fiscal deficit, high levels of current account deficit, and increasing levels of external debt, besides a repressive and weakening financial system. Continuing macroeconomic imbalance and delay in taking corrective action accentuated the impact of global economic shock of 1990. A large and growing fiscal deficit with a sizeable component of monetised deficit, resulted in pressures on money supply and inflation. These imbalances, in turn, spilled over to the external sector in the form of a large and unsustainable current account deficit - giving rise to sizeable public debt, both domestic and external. All these culminated in an unprecedented external payments crisis in 1991. Economic growth fell to such a low level in 1991-92 that real per capita income declined for the first time since 1979-80. The improved growth performance of the 1980s was, thus, short-lived. To an extent, this underscored the importance of the inter-temporal budget constraint in ensuring macroeconomic stability.
3.2 In response to the macroeconomic crisis; a programme of stabilisation and structural adjustment was initiated in July 1991, with wide ranging reform measures encompassing the areas of trade, exchange rate management, industry, public finance and the financial sector. Fiscal correction, exchange rate adjustment, monetary targets and inflation controls constituted the immediate measures for macroeconomic stability. These measures were supported by structural reforms in the form of industrial deregulation, liberalisation of foreign direct investment, trade liberalisation, overhauling of public enterprises and financial sector reforms. Apart from aiming at restoring the economic stability on both domestic and external fronts, the economic reform programme strived towards achieving a higher growth trajectory through increased levels of investment, and improvements in productivity, efficiency and competitiveness.
3.3 The reform measures had sectoral dimensions as well. Beginning with the industrial policy of 1991, reforms in the industrial sector were undertaken with a view to remove distortions in the resource allocation and improve competitiveness of Indian industry. The reform measures included removal of industrial licensing, reduction in the number of industries reserved for the public sector, abolition of restrictions on investment and expansion under the Monopolies and Restrictive Trade Practices (MRTP) Act, 1969, automatic approval of foreign investment, elimination of quantitative import restrictions on intermediate and capital goods and steady reduction in protective custom tariffs. These measures created a favourable environment for industry to upgrade its technology and build-up capacity in order to cater to growing domestic and external demand. Despite widespread perception regarding the relative isolation of the agricultural sector from the direct impact of the reform process, a series of policy initiatives were undertaken in this sector as well. These included,
inter alia, replacement of quantitative controls by tariff, partial decontrol of fertiliser prices, removal of bottlenecks in agricultural marketing, relaxation of restrictions of the Essential Commodities Act, 1955, replacement of the Revamped Public Distribution System (RPDS) with Targeted Public Distribution System (TPDS), and establishment of Rural Infrastructure Development Fund (RIDF). Moreover, price reforms improved terms of trade for agriculture. Also, exchange rate and international trade reforms improved the incentive structure facing agriculture.
3.4 The present Chapter does not seek to chronicle the above-mentioned reform measures, which are well documented elsewhere; instead, against the backdrop of these reform measures, it seeks to address the following set of questions: (i) How did the economic reform of the 1990s influence the growth process? (ii) Was the impact of economic reform on growth short-lived? (iii) How does the Indian economy fare vis-à-vis other emerging market economies? (iv) What was the prime mover for the post-reform growth experience? (v) Was it entirely services-driven, with sectors like ‘public administration and defence’ giving a short-lived fillip to growth? (vi) Has the agricultural sector been somewhat isolated from economic reform? (vii) W hat explains the unprecedented stockpile of foodgrains in the recent years and what are their macroeconomic implications? (viii) Has the industrial sector entered a phase of prolonged slowdown? (ix) Has there not been any productivity improvement under economic reform? Some of these issues have received attention in the available literature. Given the divergent assessment on each of these issues and recognising the importance of a comprehensive analysis of each sector to explain the overall growth dynamics, this Chapter aims at documenting major developments during reforms, explaining the factors underlying them and identifying the policy challenges therein.
3.5 The Chapter is organised as follows. Section I begins with an analysis of the impact of reforms on economic growth and its variability at the aggregate level, besides analysing issues relating to saving and investment. Section II is devoted to the performance of agriculture sector, which has exhibited a deceleration in output growth during the reform period. Apart from exploring issues like decelerating public investment, credit availability and near stagnating yields, attention is also focused on a phenomenon of topical interest, viz., burgeoning food stocks, with an emphasis on their fiscal and monetary implications. The issue of manufacturing sector slowdown, along with the underlying short and long-run constraints for the industrial sector is examined in Section III. The issue of falling productivity growth impinging on industrial competitiveness is also dealt with in this section. Section IV analyses sustainability of the services sector in view of its increasing significance in the overall growth process. Finally, Section V presents the concluding observations.
I. GROWTH, SAVING AND INVESTMENT
3.6 As mentioned earlier, the programme of macroeconomic stabilisation and the structural reforms introduced since 1991 encompassed the areas of industry, trade, foreign direct investment, public enterprises and the financial sector. This brought about an improved growth performance during the first phase of reform period, i.e., 1992-93 to 1996-97. The overall growth in this period was led by a marked acceleration in the industrial growth. The growth momentum, however, slackened in the latter phase of reforms, i.e., 1997-98 to 2002-03, with the slowdown exacerbated by the global recessionary conditions.1 This pulled down the trend growth for the period of reforms (i.e., 1992-93 to 2002-03) to 6.1 per cent, which was moderately higher than the trend growth of 5.6 per cent recorded during the pre-reform decade ( i.e., 1981-82 to 1990-91). Although the services sector provided some resilience to the overall growth process, the pronounced deceleration in manufacturing activities during the second phase of the reform period posed a major challenge for sustaining the growth momentum. Against this backdrop, the present section examines three crucial macro-economic aggregates, viz., growth, saving and investment.
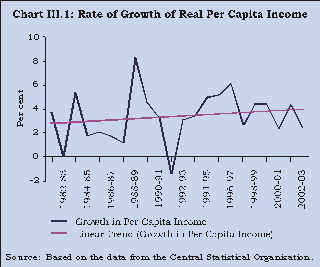
3.7 With improvement in the overall growth rate, the real per capita income exhibited an increasing trend (Chart III.1). The per capita income grew at a higher average rate of 3.9 per cent during the reform period compared with 3.2 per cent during the pre-reform decade. This was aided by a distinct deceleration in the compound growth rate of population from 2.14 per cent during the decade ending 1991 to 1.96 per cent during the decade ending 2001. The positive outcome of the growth process during the reform period also seems to have been reflected in reduction in the poverty ratio to 26.1 per cent in 1999-2000 from 36.0 per cent in 1993-94 and 38.9 per cent in 1987-88 (Government of India, 2003).
3.8 The real sector is presently confronted with a number of challenges. First, the recent deceleration in economic growth, particularly the sharp deceleration in the rate of industrial growth is worrisome. Second, there has been a distinct downturn in domestic investment during the second half of the decade of reforms, involving both the public sector and the private corporate sector. Third, public sector saving have fallen drastically and have become negative for the first time from 1998-99 onwards.
Growth Performance
3.9 As mentioned before, the economic performance during the reform period reflected an improvement in real Gross Domestic Product (GDP) growth (Table 3.1). The growth process responded favourably to the initial productivity gains arising from deregulation of trade, industry and finance. The overall growth during the reform period was marked by higher services sector growth (8.0 per cent as compared with 6.7 per cent during the 1980s), while agriculture and industry witnessed some deceleration.
Table 3.1 : Sectoral Trend Growth Rates Of Real Gross Domestic Product | |||||||||
(Per cent) | |||||||||
Sector | Decade Preceding | Crisis Year | Period of Reforms | ||||||
Reforms | (1991-92) | (1992-93 to 2002-03) | |||||||
(1981-82 to 1990-91) | |||||||||
Growth | CV (%) | Growth | Growth | CV (%) | |||||
1 | 2 | 3 | 4 | 5 | |||||
1. | Agriculture and Allied Activities | 3.1 | 150.7 | -1.5 | 2.5 | 130.2 | |||
2. | Industry | 7.6 | 24.1 | -1.2 | 6.2 | 53.5 | |||
Mining and Quarrying | 7.5 | 59.3 | 3.7 | 4.2 | 84.7 | ||||
Manufacturing | 7.4 | 28.9 | -3.6 | 6.6 | 62.0 | ||||
Electricity, Gas and Water Supply | 9.4 | 21.2 | 10.4 | 6.0 | 46.4 | ||||
3. | Services | 6.7 | 18.0 | 4.5 | 8.0 | 22.7 | |||
Construction | 4.8 | 102.5 | 2.1 | 6.0 | 51.0 | ||||
Trade, Hotels and Communication | 5.9 | 18.9 | 2.5 | 8.6 | 22.0 | ||||
Financing, Insurance, Real Estate and | 10.1 | 16.3 | 12.0 | 7.8 | 40.2 | ||||
Business Services | |||||||||
Community, Social and Personal Services | 6.6 | 30.9 | 2.6 | 8.0 | 44.7 | ||||
4. | GDP at Factor Cost | 5.6 | 39.1 | 1.3 | 6.1 | 23.0 | |||
Notes : | 1) Trend growth rates have been calculated using semi-logarithmic regression. | ||||||||
2) CV refers to Coefficient of Variation of growth. | |||||||||
Source : | Computed on the basis of data from the Central Statistical Organisation. | ||||||||
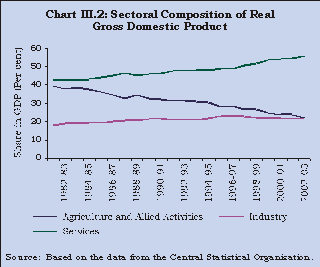
3.10 This change in the growth process resulted in shifts in the production structure (Chart III.2). The services sector (including construction) with high growth rate emerged as the ‘lead’ sector contributing over 50 per cent of GDP in the period of reforms as compared with 44.4 per cent in the pre-reform decade. The deceleration in agricultural growth led to a decline in its share to 27.0 per cent in the reform period from 35.7 per cent during the pre-reform decade. The shifting output structure reflects the impact of relative sectoral productivity growth on the one hand, and changing demand pattern on the other.
3.11 The growth performance of the Indian economy during the reform period provides encouraging evidence when compared with the growth performance of some other emerging market economies during the same period. Among select emerging market economies, India ranked high during the 1990s in terms of average real GDP growth (Table 3.2). Similar trends were evident at the sectoral level as well. However, unlike India, the growth momentum in most other emerging market economies was led by the industrial sector rather than the services sector.
Table 3.2 : Growth Performance in Select Emerging Market Economies | |||||||||
(Annual average growth rate in percent) | |||||||||
Country | GDP | Agriculture | Industry | Services | |||||
1980- | 1990- | 1980- | 1990- | 1980- | 1990- | 1980- | 1990- | ||
1 | 2 | 3 | 4 | 5 | 6 | 7 | 8 | ||
Argentina | -0.7 | 4.3 | 0.7 | 3.4 | -1.3 | 3.8 | 0.0 | 4.5 | |
Brazil | 2.7 | 2.9 | 2.8 | 3.2 | 2.0 | 2.6 | 3.3 | 3.0 | |
China | 10.1 | 10.3 | 5.9 | 4.1 | 11.1 | 13.7 | 13.5 | 9.0 | |
India | 5.8 | 6.0 | 3.1 | 3.0 | 6.9 | 6.4 | 7.0 | 8.0 | |
Indonesia | 6.1 | 4.2 | 3.6 | 2.1 | 7.3 | 5.2 | 6.5 | 4.0 | |
Malaysia | 5.3 | 7.0 | 3.4 | 0.3 | 6.8 | 8.6 | 4.9 | 7.2 | |
Mexico | 1.1 | 3.1 | 0.8 | 1.8 | 1.1 | 3.8 | 1.4 | 2.9 | |
Thailand | 7.6 | 4.2 | 3.9 | 2.1 | 9.8 | 5.3 | 7.3 | 3.7 | |
Source : | World Development Indicators 2002, World Bank. | ||||||||
3.12 Besides acceleration in growth, another important aspect that characterised the growth process in India during the 1990s was the reduced variability in annual growth rates. Among the three sectors of economy, the variability in growth has traditionally been the highest for the agricultural sector, owing to its dependence on the monsoon. Its variability, as measured by the coefficient of variation, however, showed a decline to 130.2 per cent during the period of reforms from 150.7 per cent in the preceding decade, reflecting a favourable impact of the successive normal monsoons. This contributed to a reduction in variability of overall GDP growth to 23.0 per cent from 39.1 per cent during the same period.
3.13 The decadal analysis presented above masks some important aspects of the growth process within the decade. For a meaningful comparison, the period of reforms can be sub-divided into two phases viz., Phase I (1992-93 to 1996-97) and Phase II (1997-98 to 2002-03). The entire period of Phase I can be further divided into two sub-periods based on the growth performance of the economy. The first sub-period (1992-93 to 1993-94) was the period of recovery from the crisis while the second sub-period (1994-95 to 1996-97) was marked by high growth of the economy. During the crisis year of 1991-92, the rate of growth of real GDP had dipped to 1.3 per cent, engendered to a large extent by sharp credit containment and fiscal as well as import contraction. Both, agriculture and industrial sectors recorded negative rates of growth, the former primarily emanating from the occurrence of drought. However, the speed of recovery of the economy during the first sub-period of Phase I was quite impressive with the real GDP growth improving to an average of 5.5 per cent per annum spread over all the sectors (Table 3.3).
Table 3.3 : Sectoral Growth Rates of Real Gross Domestic Product: Reform Period | ||||
(Per cent) | ||||
Sector | Phase I | Phase II | ||
Sub-period I: | Sub-period II: | 1997-98 to 2002-03 | ||
1992-93 to 1993-94 | 1994-95 to 1996-97 | |||
1 | 2 | 3 | ||
1. | Agriculture and Allied Activities | 5.0 | 4.6 | 1.0 |
Agriculture | 5.2 | 4.7 | * | |
2. | Industry | 5.3 | 10.8 | 4.3 |
Mining and Quarrying | 1.3 | 5.2 | 4.0 | |
Manufacturing | 6.3 | 12.2 | 4.2 | |
Electricity, Gas and Water Supply | 3.1 | 7.2 | 5.7 | |
3. | Services | 6.0 | 7.9 | 7.9 |
Construction | 2.0 | 4.6 | 7.0 | |
Trade, Hotels and Communication | 6.3 | 10.5 | 7.9 | |
Financing, Insurance, Real Estate and Business Services | 9.6 | 6.9 | 7.3 | |
Community, Social and Personal Services | 4.0 | 5.8 | 8.6 | |
4. | GDP at Factor Cost | 5.5 | 7.5 | 5.3 |
* | Not available separately | |||
Source : Computed on the basis of data from the Central Statistical Organisation. | ||||
3.14 With the economic recovery gathering momentum in the first sub-period of Phase I, the economy was placed on a higher growth trajectory in the subsequent period. During the second sub-period of the first phase, the growth rate of GDP averaged as much as 7.5 per cent per annum. This was the only period in India’s economic history during which real GDP growth exceeded 7.0 per cent consecutively over a period of three years. The sharp acceleration in the rate of growth of overall GDP was largely the result of the phenomenal growth of 10.8 per cent per annum in the industrial sector. The upswing in industrial growth during this sub-period can be regarded as an outcome of removal of various constraints in the form of licensing and other restrictions as a part of the liberalisation initiatives. The growth of GDP, however, moderated in 1997-98, which marks the beginning of phase II.
The Growth Deceleration
3.15 The phase from 1997-98 to 2002-03 was marked by a deceleration in growth with the average rate of growth during this period turning out to be 5.3 per cent, which was much lower than the average growth of 7.5 per cent per annum recorded during the period of high growth from 1994-95 to 1996-97.The most disturbing feature of this phase was the steep decline in industrial growth, led by a severe slowdown in the manufacturing sector. The average rate of growth of manufacturing decelerated by as much as eight percentage points during this phase as compared with the second sub-period of the first phase.
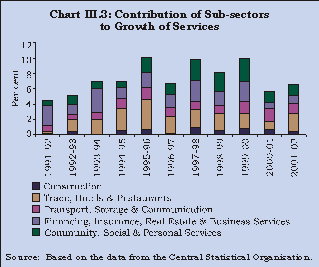
3.16 Within the second phase, real GDP growth, after dipping to 4.8 per cent in 1997-98, recovered during the years 1998-99 and 1999-2000 to over 6.0 per cent. One of the factors contributing to this recovery was the high growth emanating from services sector, and within the services sector, the growth of ‘community, social and personal services’, particularly ‘public administration and defence’. The Fifth Pay Commission Award led to an increase in GDP originating from the sub-sector of ‘public administration and defence’ in 1997-98, with its lagged effect persisting till 1999-2000. These years witnessed a striking increase in the weighted contribution of ‘community, social and personal services’ to the growth of GDP originating from the services sector (Chart III.3) [This issue is discussed in greater details in Section IV]. The period from 1997-98 to 1999-2000 also witnessed steady growth in other components of the services sector. In the more recent period, growth of overall GDP dipped to 4.4 per cent in 2000-01. This was a result of poor performance of agriculture, coupled with a significant deceleration in the growth rate of GDP from the services sector, particularly ‘financing, insurance, real estate and business services’. The same rate of growth of 4.4 per cent has also been registered in 2002-03, as per the latest Advance Estimates, which has been an outcome of a sharp fall in agricultural growth to a negative of 3.1 per cent owing to the drought conditions.
Potential Output and Output Gap
3.17 A combination of structural and cyclical factors can be identified for explaining the deceleration in growth during the second phase. Structural factors include, among others, the lack of appropriate reforms in the agricultural sector, infrastructure gaps, labour market rigidities, weak bankruptcy and exit procedures, while the cyclical factors primarily include decline in aggregate demand. The cyclical fluctuations in real economic activity are captured by the measure of output-gap; the impact of structural factors on the growth process can be gauged from the underlying potential output. The potential output indicates the capacity output of the economy as represented by the steady state level that is associated with long-run supply curve under full utilisation of capacity.
3.18 Although the growth process of the economy during the reform period seems to have been influenced, to some extent, by cyclical factors, their impact as reflected in differences between potential and actual output growth was found to have diminished in magnitude in the post-1991 period as compared with the previous four decades (Donde and Saggar, 1999). An updated empirical estimate of the output-gap for India covering the most recent period also reveals that the output gap has come down significantly in the decade of reforms vis-à-vis the preceding decade. Furthermore, within the 1990s, there has been a significant narrowing down of the output gap during the latter half. In other words, the cyclical factors seem to have had a diminished impact on the growth process in the recent years. This may have been the result of fortuitous monsoon, more stable growth in services sector and more effective counter-cyclical policies. A combination of these factors may have had a stabilising influence on output fluctuations (Chart III.4). 2 Contemporaneously, the potential growth rate exhibited somewhat decelerating trend during the latter phase of the 1990s as against the first phase (Chart III.5 and Table 3.4). This corroborates the persistence of structural constraints and may have implications for medium term growth outcome. Despite the declining role of domestic cyclical sources of growth variability, progressive globalisation has enhanced the importance of global cyclical factors. In fact, during the current phase of global slowdown, such factors have weakened India’s growth prospects despite its moderate degree of globalisation.
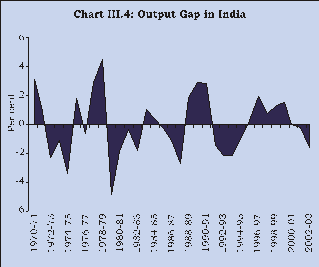
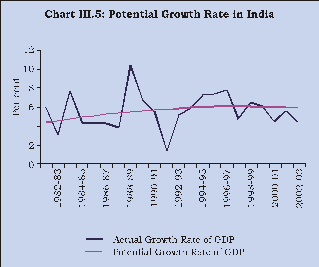
Table 3.4 : Actual and Potential Growth Rates of Real GDP | ||
(Per cent) | ||
Period | Actual | Potential |
Growth | Growth | |
Rate | Rate | |
1 | 2 | |
1981-82 to 1990-91 | 5.64 | 5.12 |
1992-93 to 1996-97 | 6.69 | 5.96 |
1997-98 | 4.76 | 6.02 |
1998-99 | 6.57 | 5.97 |
1999-00 | 6.04 | 5.91 |
2000-01 | 4.37 | 5.86 |
2001-02 | 5.57 | 5.82 |
2002-03 | 4.37 | 5.81 |
Aggregate Demand
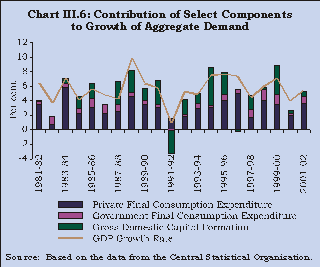
3.19 Sectoral analysis of the growth process can be supplemented by an assessment of aggregate demand. The growth process during the 1990s can be analysed in terms of autonomous, exogenous and policy-induced components of aggregate demand, which broadly relate to private, net external and government demand, respectively. Several stylised facts emerge from the analysis of sources of aggregate demand during the reform period (Table 3.5 and Chart III.6). During the first phase of reforms, particularly in its second sub-period, improvement in growth emanated mainly from investment demand, with private consumption demand providing a strong support. Second, during the second phase of reforms, the positive demand-pull stemmed from a high growth in the Government consumption expenditure. This increase reflected the rise in GDP originating from ‘public administration and defence’, owing to the effect of the Fifth Pay Commission. Third, the slowdown in the economic activity during the second phase seems to have been a result of a rapid deceleration in investment demand coupled with a relatively lower growth in private consumption demand. These two components showed contraction in terms of annual growth during the second phase. During this phase, a decline can also be noted in the case of the contributions of these two components to growth in overall aggregate demand, as shown in Chart III.6. In view of these developments, there is a need to revive the aggregate demand especially by accelerating investment in order to stimulate the overall growth performance of the economy.
Table 3.5 : Growth Rates and Relative Contributions of Select Components of Aggregate Demand(At 1993-94prices) | |||||||||
(Per cent) | |||||||||
Growth Rate | Relative Contribution | ||||||||
Phase I | Phase II | Phase I | Phase II | ||||||
Item | Sub- | Sub- | 1997-98 to | Sub- | Sub- | 1997-98 to | |||
period I: | period II: | 2001-02 | period I: | period II: | 2001-02 | ||||
1992-93 to | 1994-95 to | 1992-93 to | 1994-95 to | ||||||
1993-94 | 1996-97 | 1993-94 | 1996-97 | ||||||
1 | 2 | 3 | 4 | 5 | 6 | ||||
1 | Total Final Consumption Expenditure | 3.7 | 6.0 | 5.3 | 2.9 | 4.6 | 4.0 | ||
1.1 | Private Final Consumption Expenditure | 3.5 | 6.2 | 4.7 | 2.4 | 4.1 | 3.0 | ||
1.2 | Government Final Consumption Expenditure | 4.8 | 4.6 | 9.0 | 0.5 | 0.5 | 1.0 | ||
2 | Gross Domestic Capital Formation | 7.6 | 11.0 | 5.9 | 1.7 | 2.7 | 1.5 | ||
3 | GDP at Market Prices | 5.1 | 7.5 | 5.4 | 5.1 | 7.5 | 5.4 | ||
Note | : | The relative contributions of the components of aggregate demand will not add up to total on account of non-availability of Net Exports in real terms. | |||||||
Source | : | Computed on the basis of data from the Central Statistical Organisation. | |||||||
Saving Behaviour
3.20 The process of economic growth hinges critically on the generation of greater saving and its channelisation into productive investment. The overall improvement in GDP growth during the reform period seems to have been facilitated by the improvement in the rate of aggregate domestic saving as corroborated by an empirical exercise discussed subsequently. During the period of reforms as a whole, the rate of Gross Domestic Saving (GDS) increased to 23.1 per cent from 19.8 per cent in the preceding decade, with both periods witnessing some variability on a year-to-year basis (Chart III.7).
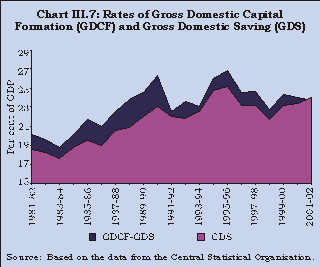
3.21 The behaviour of the saving rate and economic growth in India during the reform period seems to suggest that the high growth phase is associated with higher order of increase in domestic saving (Table 3.6). Within the first phase, the second sub-period, which was also a period of high GDP growth, witnessed an increase of 2.2 percentage points in the domestic saving rate over the first sub-period. During the second phase of reforms, which was marked by a distinct deceleration of growth, the saving rate declined by 1.3 percentage points to reach 23.1 per cent. Empirical relationship between the changes in GDP and incremental saving provides the evidence of a bidirectional causality - highlighting the role of the feedback effects emanating from saving to economic growth and vice versa.3
Table 3.6 : Rates and Composition of Gross Domestic Saving by Institutional Sources | |||||||||||
(Per cent) | |||||||||||
Phase I | Phase II | ||||||||||
Item | Sub-period I: | Sub-period II: | 1997-98 to 2001-02 | ||||||||
1992-93 to 1993-94 | 1994-95 to 1996-97 | ||||||||||
1 | 2 | 3 | |||||||||
1. | Private Sector | 21.0 | 22.6 | 24.1 | |||||||
(95.0) | (92.7) | (104.6) | |||||||||
1.1 Household Sector | 18.0 | 18.3 | 20.2 | ||||||||
(81.1) | (75.0) | (87.5) | |||||||||
1.1.1 | Financial Saving | 9.9 | 10.4 | 10.5 | |||||||
(54.9) | (56.7) | (52.2) | |||||||||
1.1.2 | Physical Saving | 8.1 | 7.9 | 9.7 | |||||||
(45.1) | (43.3) | (47.8) | |||||||||
1.2 Private Corporate Sector | 3.1 | 4.3 | 3.9 | ||||||||
(13.8) | (17.6) | (17.1) | |||||||||
2. | Public Sector | 1.1 | 1.8 | -1.1 | |||||||
(5.0) | (7.3) | -(4.6) | |||||||||
3. | Gross Domestic Saving | 22.2 | 24.4 | 23.1 | |||||||
(100.0) | (100.0) | (100.0) | |||||||||
Memo Item: | |||||||||||
Growth Rate of Real GDP at Factor Cost | 5.5 | 7.5 | 5.5 | ||||||||
Notes | : | 1) | Rates are worked out as a percentage of GDP at current market prices. | ||||||||
2) | Figures in parentheses indicate percentage share in GDS except for items 1.1.1 and 1.1.2, where they indicate the percentage shares in household sector saving. | ||||||||||
Source | : | Computed on the basis of data from Central Statistical Organisation. | |||||||||
Sources of Domestic Saving
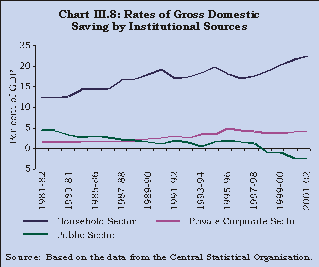
3.22 A salient feature of the 1990s was the rising trend in the household sector saving (Chart III.8). Within the household sector saving, the rate of saving held in financial assets steadily increased during this period. Financial liberalisation has an important bearing on financial saving as it involves the creation of newer instruments and avenues of saving, and also reduces intermediation costs (McKinnon, 1973). In India, the phenomenon of improvement in financial saving could be attributed to more efficient financial intermediation, greater opportunities for diversification across financial assets and emergence of market related returns.
3.23 Notwithstanding financial innovations, bank deposits continued to be the most important instrument of financial saving among the households during the period of reforms. The shares of various instruments in household financial saving for the period since 1981-82 are given on the basis of five-year and ten-year averages in Table 3.7. An empirical exercise conducted to estimate the effect of real interest rate on saving held in bank deposits indicates that interest rate plays an insignificant role.4 Personal disposable income, however, is found to be an important determinant of this saving.
Table 3.7 : Average Shares of Various Instruments in Household Financial Saving | |||||||
(Per cent) | |||||||
Item | 1981-82 to | 1986-87 to | 1981-82 to | 1991-92 to | 1996-97 to | 1991-92 to | |
1985-86 | 1990-91 | 1990-91 | 1995-96 | 2000-01 | 2000-01 | ||
1 | 2 | 3 | 4 | 5 | 6 | ||
1. | Currency | 14.9 | 15.9 | 15.4 | 13.2 | 9.5 | 11.4 |
2. | Bank Deposits (Net) | 31.1 | 23.3 | 27.2 | 31.3 | 35.6 | 33.6 |
3. | Shares and Debentures | 7.1 | 11.6 | 9.4 | 17.1 | 5.1 | 11.1 |
4. | Net Claims on Government | 14.8 | 14.6 | 14.7 | 7.7 | 13.2 | 10.4 |
5. | Life Insurance Funds | 9.2 | 10.3 | 9.8 | 10.5 | 12.8 | 11.5 |
6. | Provident and Pension Funds | 22.9 | 24.2 | 23.5 | 20.2 | 23.7 | 22.0 |
Household Saving in | 100.0 | 100.0 | 100.0 | 100.0 | 100.0 | 100.0 | |
Financial Assets | |||||||
Source : Central Statistical Organisation. | |||||||
3.24 Another important feature of household saving during the reform period has been the increasing importance of saving held in insurance funds, and provident and pension funds (together described as contractual saving) (Chart III.9). The growing share of this saving is a positive development, given that such saving is long-term in nature and can be an important instrument for channelising funds towards certain productive sectors of the economy, such as infrastructure, which require lumpy investments and involve long gestation lags (Government of India, 1996). Apart from ensuring assured rates of return with tax exemptions, contractual saving also provides old age security. As disposable income rises and life expectancy continues to increase, concerns regarding old age security can be expected to result in increasing share of financial saving held in contractual instruments.
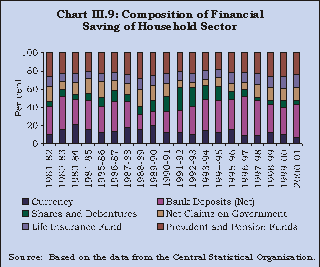
3.25 ‘Shares and debentures’ is another instrument of financial saving that was expected to get a boost from the reforms. Measures undertaken for developing the capital market were expected to divert saving from the traditional financial instruments to the capital market instruments. Reflecting this, the proportion of household saving in ‘shares and debentures’ (inclusive of investment in mutual funds) rose steeply to over 20 per cent of total financial saving in the initial years of the 1990s from 9.4 per cent in the 1980s. This was due to a shift away from the relatively safer modes of saving, such as small saving instruments (included under ‘claims on Government’). Following the irregularities in stock market in 1992 and the associated price uncertainty that prevailed in the subsequent period, the proportion of household financial saving held in ‘shares and debentures’, however, witnessed a decline to reach a low of 3.2 per cent by 2000-01. On the whole, the proportion of financial saving in ‘shares and debentures’ rose by little less than two percentage points between 1981-91 and 1991-2001. The pattern of financial saving that emerges during the decade of reforms, thus, indicates a continued preference of households for relatively safer instruments with assured returns.
3.26 The improved performance of the private corporate sector saving during the second sub-period of Phase I can be attributed to high industrial growth and rising profitability of corporate entities (Table 3.6). On the other hand, the distinct slowdown in corporate sector saving witnessed since 1996-97 can be attributed to declining profitability of these entities engendered by industrial slowdown.
3.27 The public sector witnessed a noticeable decline in its saving during the reform period (Chart III.8). The deteriorating fiscal position during the 1980s had resulted in worsening of contribution of this sector to aggregate saving. During the period of reforms, despite the increased emphasis on fiscal discipline, at least in the initial years, the rising expenditure burden on account of factors such as higher interest payments and salaries coupled with a fall in the tax-GDP ratio, placed considerable strain on the saving from this sector. During the 1990s, gross tax-GDP ratio for the Central Government fell by about 2.0 percentage points whereas interest payment as a proportion of GDP rose from 3.8 per cent to 4.6 per cent during the same period. Similarly, falling trend in salaries as a proportion of GDP witnessed in the early 1990s also got reversed after the implementation of the award of Fifth Pay Commission in the latter part of the 1990s. This contributed to the public sector saving rate turning negative (-1.1 per cent) during 1997-98 to 2001-02 from 1.8 per cent of GDP during 1994-95 to 1996-97 – a reduction of 2.9 percentage points. The high levels of public sector deficit imply a draft on the private saving in the economy. More worrisome aspect is that predominant part of Government draft on private saving is utilised for consumption purposes and to that extent productive capacity of the economy gets impaired [see Chapter IV for details on the issues related to fiscal policy].
Investment Behaviour
3.28 Reflecting greater investment demand in response to the major structural reforms undertaken in various sectors, the rate of domestic capital formation improved to 25.8 per cent of GDP during the second sub-period of Phase I (Table 3.8). The slowing down of the structural reforms in the second phase along with the cyclical influences transmitted from the global uncertainties weakened the investment demand, resulting in significant slackening in the rate of domestic capital formation to a level of 23.9 per cent of GDP.
3.29 The industrial and trade policy reforms of 1991 resulted in significant acceleration in private sector investment in the early 1990s, and was particularly led by a robust increase in manufacturing investment. The high investment demand in the industrial sector, apart from being aided by policy reforms, was facilitated by an improved domestic saving rate. However, a decelerating trend in the rate of private corporate sector investment was observed during the latter half of the 1990s. Even though investment from the household sector continued to show a rising trend, investment from the private corporate sector could not keep up with the momentum it witnessed in the initial years of the 1990s (Chart III.10). The pace of private investment originating from private corporate sector was, inter alia, inhibited by reduced saving from this sector, lack of adequate regulatory reforms in core and infrastructure sectors and lack of public investment in infrastructure. These factors could have inhibited private sector investment by imposing extra costs in a competitive environment. Besides these, increased uncertainties in the domestic investment climate created by factors such as poor progress and lack of clarity on the directions of disinvestments and privatisation programme, and the continued slowdown in the global economy, may also have dampened private investment.
Table 3.8 : Rates and Composition of Gross Capital Formation by Institutional Sources | |||||||||
(Per cent) | |||||||||
Item | Decade | Year of | Phase I | Phase II | |||||
Preceding Reforms | Crisis | ||||||||
1981-82 to | 1991-92 | Sub-period I: | Sub-period II: | 1997-98 to | |||||
1990-91 | 1992-93 to | 1994-95 to | 2001-02 | ||||||
1993-94 | 1996-97 | ||||||||
1 | 2 | 3 | 4 | 5 | |||||
1. | Private Sector | 12.6 | 13.1 | 14.1 | 16.1 | 15.8 | |||
(55.2) | (59.8) | (62.6) | (67.2) | (70.6) | |||||
1.1 | Household Sector | 8.0 | 7.4 | 8.1 | 7.9 | 9.7 | |||
(35.7) | (33.9) | (35.9) | (33.0) | (43.2) | |||||
1.2 | Private Corporate Sector | 4.5 | 5.7 | 6.0 | 8.2 | 6.1 | |||
(19.5) | (25.8) | (26.8) | (34.2) | (27.4) | |||||
2. | Public Sector | 10.0 | 8.8 | 8.4 | 7.8 | 6.6 | |||
(44.8) | (40.2) | (37.4) | (32.8) | (29.4) | |||||
3. | Gross Capital Formation | 22.5 | 21.9 | 22.5 | 23.9 | 22.4 | |||
(100.0) | (100.0) | (100.0) | (100.0) | (100.0) | |||||
4. | Gross Domestic Capital Formation | 21.8 | 22.6 | 23.3 | 25.8 | 23.9 | |||
Notes : | 1) | Rates are worked out as a percentage of GDP at current market prices. | |||||||
2) | Figures in parentheses indicate percentage share in Gross Capital Formation. | ||||||||
Source : | Computed on the basis of data from the Central Statistical Organisation. | ||||||||
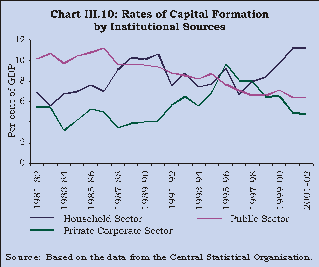
3.30 High public investment in the 1980s was particularly aimed at boosting investment in infrastructure. However, public sector investment rate exhibited a steep fall during the 1990s which was caused by deterioration in public sector saving rate.The rising interest payments and rigidity in subsidies and wages pre-empted a larger part of the revenues and borrowed funds of the Government, leaving reduced resources for investment. Besides this, the declining tax-GDP ratio and low user charges on public infrastructure services reduced the ability of the Government to undertake investment in basic infrastructure. Further, the process of fiscal adjustment led to direct cutbacks on the capital expenditure of both Central and State Governments.
3.31 Among the three sectors, a steady downturn in investment rates was experienced by the agricultural sector during the decade of reforms (Chart III.11). The decline in agricultural investment as a ratio of GDP came about from a decline in public investment rate on account of inter alia, rising subsidies, and also from the decline in private investment rate primarily owing to inadequate provision of infrastructure. The rate of investment in industry, accounting for the largest proportion of aggregate investment, exhibited a rise in the initial years of the reform decade responding to the major real sector reforms and associated anticipation of rising potential demand. This period of high investment was associated with high growth rate of GDP originating from the industrial sector. In the subsequent years, however, the rate of investment underwent a steep decline, as was the case with the rate of growth of output from this sector.

Trends in Incremental Capital-Output Ratio
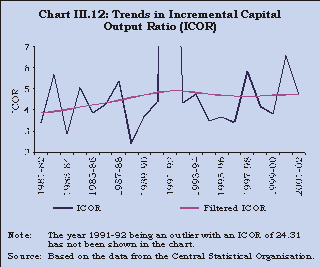
3.32 An improvement in the rate of investment needs to be supplemented by improvement in productivity in order to accelerate the rate of economic growth. The productivity of capital use, as measured by the Incremental Capital Output Ratio (ICOR), improved during the first half of the 1990s as exhibited by a steady decline in the filtered series of ICOR till 1997-98 (Chart III.12). 5 As against this, an upward movement in the ICOR was observed during the subsequent period, reflecting the deceleration in productivity growth (Table 3.9). Given the existing level of investment in the economy, the downward trend in productivity does not augur well for achieving and sustaining high growth rate.
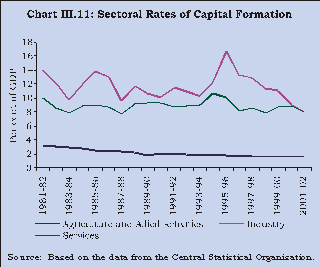
Table 3.9 : Incremental Capital Output Ratio | ||
Period | Actual ICOR | Filtered ICOR |
1981-82 to 1985-86 | 4.15 | 4.02 |
1986-87 to 1990-91 | 4.00 | 4.56 |
1992-93 to 1996-97 | 3.91 | 4.74 |
1997-1998 | 5.81 | 4.62 |
1998-1999 | 4.14 | 4.63 |
1999-2000 | 3.77 | 4.66 |
2000-01 | 6.54 | 4.70 |
2001-02 | 4.70 | 4.74 |
External Demand
3.33 The growth process during the reform period also seems to have been influenced by the behaviour of external demand. Traditionally, external demand has not been an important factor in influencing the behaviour of aggregate demand in India due to low degree of openness. However, during the 1990s, under a more liberalised trade and exchange regime, the degree of openness of the Indian economy rose considerably as reflected in higher ratio of foreign trade to GDP. Consequently, the pattern of exports has been exhibiting some degree of co-movement with global business cycles. The Granger causality between cyclical imports of industrial countries and India’s exports is significant and strongly bi-directional. Further, the cyclical output of industrial countries has unidirectional causal effect on output in India (RBI, 2002).
3.34 The magnitude of the influence of external demand on aggregate demand can be examined broadly in terms of export growth for the Indian economy. The average growth in exports rose from 8.3 per cent in the 1980s to 11.9 per cent during the first sub-period of Phase I ( i.e., 1992-93 to 1993-94) and further to 14.8 per cent during the second sub-period (i.e., 1994-95 to 1996-97). This seems to have provided significant impetus to the aggregate demand in the economy during the phase of high growth. In the subsequent period, under the influence of weakening global demand and lower growth in world trade volume, export growth experienced wide fluctuations and the overall export growth decelerated to 5.9 per cent during the second phase from 1997-98 to 2001-02. The world trade in goods and services exhibited a deceleration in growth from an average of 8.8 per cent during the period 1994-97 to 5.6 per cent during 1998-2001 (IMF, 2002). This, reinforced by the trade cycles, seem to have also contributed to the slowdown in the aggregate demand in the economy during the second phase of reform period.
Summing Up
3.35 The economy witnessed distinct improvement in growth during the first phase of reforms responding favourably to the initial productivity gains arising from reforms in the spheres of trade, industry and finance. This high growth was essentially led by a remarkable performance of the industrial sector. However, there was evidence of deceleration in the growth momentum in the second phase, mainly engendered by industrial sector, which has become a major policy concern. During the 1990s as a whole, the growth process was marked by robust growth in the services sector. The positive aspects of the growth process were an increase in the average growth of per capita income coupled with decline in the poverty ratio.
3.36 The slowdown in the domestic saving rate in the second half of the 1990s, mainly caused by public sector dis-saving, has constrained investment levels in the economy. The saving behaviour of the household sector shows that despite financial innovations, there is continued preference for relatively risk-free assets like bank deposits and contractual saving. The rising share of contractual saving reflects the rising disposable income and concerns for old age security. During the first half of the 1990s, the increased domestic saving enabled a rise in the investment rate in the economy. The slowing down of the structural reforms along with declining domestic saving rate and cyclical influences transmitted through global business cycles weakened the investment demand during the second phase of reforms. Declining public sector investment was reflective of the spill-over effects of rising revenue deficits on capital budgets of the Governments of both Centre and States. Besides a slowdown in investment, indications of declining productivity growth as reflected in rising ICOR during this phase, continue to pose challenges for the growth process.
3.37 Against this backdrop, the Tenth Five Year Plan (2002-03 to 2006-07) has set the target of an average rate of growth of GDP at 8 per cent, which is much higher than 5.5 per cent achieved during the Ninth Plan (Government of India, 2002a). This requires stepping up the average rate of investment by more than 4 percentage points to 28.4 per cent from 24.2 per cent in the previous plan. This order of increase in investment is expected to emanate from both private and public sectors. The Plan underlines the need to step up public sector investment in infrastructure to promote private sector investment. The higher investment level is to be met mainly by domestic saving, which is expected to rise by more than 3 percentage points to 26.8 per cent during the Plan from 23.3 per cent during the previous plan. A larger improvement in the saving to the extent of 3.8 per cent is required to come from the public sector. To achieve the growth target, the Plan suggests the formation of policies that would lead to an increase in productivity of existing resources as well as efficiency of new investment. This would imply a reduction in the ICOR to a level of 3.6 during the Plan period as against 4.5 in the previous plan.
3.38 Agriculture witnessed an improved growth of 3.2 per cent during the 1980s, after a span of relative stagnation during the previous two decades. The growth performance was somewhat subdued in the 1990s with real GDP originating from agriculture growing at a modest 2.9 per cent resulting from near stagnation in crop yields and falling rate of public sector capital formation in this sector, despite consecutive good monsoons. Within the agricultural sector, a sharper decelaration was observed in the non-food grain production. While there was deceleration in output growth, the variability of the growth process has significantly declined during the 1990s as compared with the 1980s.
3.39 The reasons for slowdown in agricultural growth were many. The pre-occupation with food security led to restrictive trade policies regulating trade in agricultural commodities. Alongwith this, high protection to industry resulted in unfavourable terms of trade for agriculture until the early 1990s. The negative consequences of such policies were to be offset by the provision of high subsidies on inputs such as irrigation and fertilisers. However, such input subsidies assumed large proportions over time and reduced the capacity of the Government to invest in agricultural infrastructure. Further, the distortionary pricing system of agricultural commodities with Minimum Support Prices (MSP) favouring production of rice and wheat, provided adverse incentives for crop diversification. The falling world prices of agricultural commodities during the latter half of 1990s further reduced the competitiveness of the agricultural exports. The relatively higher MSPs on the one hand, and the increasing production of rice and wheat on the other, all led to increased procurement of foodgrains, and in the face of lower off-take, resulted in piling up of foodgrain stocks. Thus, the slowing down of agriculture growth in the 1990s, despite a generally favourable macroeconomic environment, could be attributed to limited reforms in this sector. Limited progress has been made in removal of restrictions on domestic trade and processing, rationalisation of price interventions and reforms in rural infrastructure.
3.40 It is apparent that Indian agriculture is characterised by deceleration in its performance in the 1990s coupled with a large stock of foodgrains. While plateauing of yield gains (i.e., productivity) in foodgrains could, in part, explain the observed deceleration in production performance, there is no denying of the fact that higher growth in agriculture will, clearly, need diversification. Notwithstanding the limited reforms directly affecting agriculture, some policy measures were undertaken to provide incentive framework for agriculture to make it more competitive. The reform measures taken during the 1990s included, (i) restructuring of Public Distribution System (PDS), initially through the Revamped Public Distribution System (RPDS) and subsequently by replacing RPDS with the Targeted Public Distributions System (TPDS); (ii) replacement of the quantitative controls by tariff restrictions; (iii) introduction of forward trading in important commercial crops; and (iv) relaxation of restrictions under the Essential Commodities Act, 1955. It may be noted that most of these reforms in agricultural sector were introduced only towards the end of the 1990s and are still in the process of being operationalised.
3.41 These reform measures have brought in some changes in the agricultural sector. Deregulation of industrial sector improved the terms of trade for agriculture (Vyas and Reddy, 2002; Mohan, 2002). The gradual reliance on the market seems to have brought some changes in the cropping pattern, causing diversion towards non-foodgrains from foodgrains. However, within the foodgrains, there has been area diversion towards input intensive cultivation of rice and wheat from coarse cereals and pulses, reflecting the impact of subsidies on inputs such as fertiliser and fuel for irrigation.
3.42 Against this backdrop, this Section seeks to analyse two distinct issues. First, the deceleration in agricultural growth during the 1990s and its product-specific profile are analysed. Second, the phenomenon of burgeoning buffer stocks of foodgrains including their fiscal and monetary implications is discussed in some detail.
Foodgrains
3.43 The deceleration in the growth of foodgrains production to 2.0 per cent in the 1990s from 2.9 per cent in the preceding decade was caused predominantly by declining yield growth, reflecting a diminishing growth in productivity. Among foodgrains, growth in rice production decelerated due to a decline in yield growth, despite a marginal increase in the growth of area under cultivation. On the other hand, production of wheat in the 1990s witnessed an identical rate of growth to that of the 1980s, due to substantial increase in acreage, even as yield growth decelerated. The increased area growth in wheat and rice during the 1990s led to a decline in area under coarse cereals and pulses. Despite a decline in acreage, production of coarse cereals was maintained almost at the levels attained in the preceding decade on account of increased yield growth. Growth in pulses production decelerated in the 1990s due to a deceleration in yield growth coupled with a decline in acreage (Table 3.10). Following the changes in acreage under foodgrains during the 1990s, the shares of rice and wheat increased and those of coarse cereals and pulses declined, which had implications for input usage and procurement of foodgrains.
Non-Foodgrains
3.44 The decelerating growth in the index of non-foodgrains production to 2.6 per cent in the 1990s from 3.8 per cent in the earlier decade was also marked by a slowdown in the yield growth. Within non-foodgrains, oilseeds production growth witnessed a sharp deceleration from 5.5 per cent in the previous decade to 2.3 per cent in the 1990s due to a decline in yield growth and stagnation in area coverage. Stagnation in area under these crops seems to have been induced by the freeing of imports of major edible oils in 1994 that had considerably weakened the protectionist atmosphere in respect of the oilseeds sector. The growth in sugarcane production during the 1990s was identical to that in the 1980s, due to some acceleration in area growth, while yield growth decelerated marginally. In the case of cotton, the substantial yield growth attained in the 1980s appears to have influenced the farmers’ preference to cultivate cotton in the 1990s with acreage increasing substantially by 2.7 per cent per annum. This increase in acreage led to an increase in output of cotton by 2.3 per cent even as yield growth turned negative to 0.4 per cent (Table 3.10).
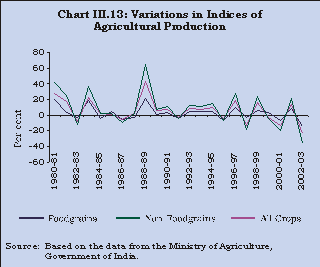
3.45 The deceleration in yield growth, spread across both foodgrains and non-foodgrains, led to a perceptible slackening in the growth of agricultural production to 2.3 per cent in the 1990s from 3.2 per cent in the earlier decade. Moreover, increased variability in agricultural production during the latter part of the 1990s, primarily emanating from the fluctuations in acreage in case of foodgrains, and from fluctuating yields in case of non-foodgrains is also a matter of concern (Chart III.13).
Table 3.10 : Trend Growth Rates of Area, Production and Yield of Agricultural Crops | |||||||
(Per cent) | |||||||
1980-81 to 1989-90 | 1990-91 to 1999-2000 | ||||||
Area | Production | Yield | Area | Production | Yield | ||
1 | 2 | 3 | 4 | 5 | 6 | ||
Index of Foodgrains Production | -0.2 | 2.9 | 2.7 | -0.1 | 2.0 | 1.5 | |
Index of Non-Foodgrains Production | 1.1 | 3.8 | 2.3 | 1.2 | 2.6 | 1.1 | |
Index of All Crops Production | 1.0 | 3.2 | 2.6 | 0.3 | 2.3 | 1.3 | |
Foodgrains | |||||||
Rice | 0.4 | 3.6 | 3.2 | 0.7 | 2.0 | 1.3 | |
Wheat | 0.5 | 3.6 | 3.1 | 1.7 | 3.6 | 1.8 | |
Coarse Cereals | -1.3 | 0.4 | 1.7 | -2.1 | 0.0 | 2.2 | |
Pulses | -0.1 | 1.5 | 1.6 | -0.6 | 0.7 | 1.3 | |
Non-Foodgrains | |||||||
Oilseeds | 2.4 | 5.5 | 3.0 | 0.2 | 2.3 | 2.1 | |
Sugarcane | 1.5 | 2.7 | 1.2 | 1.7 | 2.7 | 1.1 | |
Cotton | -1.3 | 2.8 | 4.1 | 2.7 | 2.3 | -0.4 | |
Note : | Trend growth rates are computed on the basis of semi-logarithmic equations. | ||||||
Source : | Computed on the basis of data from the Ministry of Agriculture, Government of India. | ||||||
3.46 Apart from these traditional foodgrains and non-foodgrains, India produces a large number of horticultural crops such as fruits, flowers, vegetables, potato, tropical tuber crops, spices, and plantation crops like coconut, cashewnut and cocoa as also livestock products. Given the diverse agro-climatic conditions in India, horticultural crops have the potential to turn agriculture more profitable as also create employment in rural areas. India has emerged as the largest producer of coconut, arecanut, cashewnut, ginger, turmeric, black pepper and the second largest producer of fruits and vegetables in the world. It needs to be recognised that these allied products of agriculture have high value added with a higher potential for exports. The sustainability of growth in the agriculture would, however, require much faster diversification away from traditional items to these non-traditional agro-products.
Deceleration in Agricultural Growth in the 1990s
3.47 As illustrated above, barring wheat and sugarcane, there has been a perceptible slackening of growth in agriculture in the 1990s. The main factors for the deceleration in agricultural growth include, i) inadequate irrigation cover; ii) improper adoption of technology; iii) unbalanced use of inputs; iv) decline in public investment; and v) weakness in credit delivery system.
i) Inadequate Irrigation Cover
3.48 Inadequate irrigation cover for most of the crops continues to be the main constraining factor for speedy adoption of improved technology. For instance, only 39.2 per cent of the gross cropped area in the country was under irrigation in 1998-99. The share of public expenditure on irrigation and flood control to total public expenditure had declined over the years. The share, which was 10 per cent during the Sixth Plan period (1980-85), came down to 7.6 per cent during the Seventh Plan period (1985-1990) and further to 6.5 per cent during the Eighth Plan (1992-97) period. During the Ninth Plan period (1997-2002), the share is estimated to remain at around 6.5 per cent.
3.49 Furthermore, irrigation coverage across various States and crops is quite skewed. Among the major agricultural States, while 92.2 per cent of gross cropped area in Punjab was irrigated in 1998-99, in Maharashtra only 15.4 per cent of cultivated area was irrigated. States like West Bengal, Karnataka, Madhya Pradesh and Orissa had less than 30 per cent of the cultivated area under irrigation in 1998-99. Distribution of irrigation facilities across crops is also equally skewed. For example, only 12.1 per cent of the area under pulses was irrigated in 1998-99 as compared with 85.8 per cent for wheat and 52.3 per cent for rice at the national level (Table 3.11). Similarly, the coverage of irrigation under the non-foodgrains crops had also been quite lopsided. Among the non-foodgrains, irrigation cover in respect of oilseeds was as low as 23.2 per cent, while the same for sugarcane stood at 91.7 per cent in 1998-99. The low irrigation cover for various crops has led to severe rainfall dependency. It was found that the correlation between production and rainfall was particularly high for pulses and oilseeds.6 This rainfall dependence of Indian agriculture has imparted variability to production in the latter part of the 1990s when the spatio-temporal distribution of rainfall remained largely skewed.
Table 3.11 : Irrigation Coverage for Various Crops | ||||
(Per cent to gross cropped area under the crop) | ||||
1980-81 | 1990-91 | 1998-99 | ||
1 | 2 | 3 | ||
Rice | 40.7 | 45.5 | 52.3 | |
Wheat | 77.0 | 81.1 | 85.8 | |
Coarse Cereals | 9.2 | 9.0 | 12.0 | |
Gram | 20.6 | 20.5 | 21.0 | |
Arhar | 2.6 | 5.5 | 4.2 | |
Total Pulses | 9.0 | 10.5 | 12.1 | |
Total Foodgrains | 29.7 | 35.1 | 42.4 | |
Groundnut | 13.3 | 18.6 | 19.4 | |
Rapeseed & Mustard | 43.7 | 59.8 | 58.3 | |
Soyabean | – | – | 2.5 | |
Oilseeds | 14.5 | 22.9 | 23.2 | |
Sugarcane | 81.2 | 86.9 | 91.7 | |
Cotton | 27.3 | 32.9 | 34.9 | |
Source : | Ministry of Agriculture, Government of India. | |||
ii) Inadequate Adoption of Technology
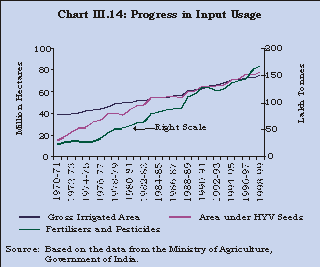
3.50 One of the main reasons for the low levels of yields in Indian agriculture has been the unsatisfactory spread of new technological practices, including the adoption of High Yielding Varieties of seeds (HYV) and usage of fertilisers and pesticides, inadequate spread of farm management techniques and other practices such as soil conservation and crop rotation (RBI, 2002). The adoption of new technology, mainly the HYV seeds requires intensive use of fertilisers and pesticides under adequate and assured water supply. The use of HYV seeds entails a higher yield risk as compared with the traditional seed varieties, mainly due to lack of proper irrigation facilities (Ganesh Kumar, 1999; Saha, 2001). This increased risk is one of the elements obstructing the speedy adoption of HYV seed cultivation across regions and crops. The area under HYV seeds and area under irrigation have been growing in tandem, probably on account of reduction in yield risk facilitated by availability of irrigation facilities (Chart III.14). The area under HYV seeds, which recorded a trend growth rate of 8.1 per cent per annum in the 1980s, decelerated to 4.4 per cent per annum in the 1990s. Availability of quality seeds is inadequate and usage of high yielding hybrid seeds is very low and occurs only in the case of a few crops. Similarly, there has been a decline in growth rate of consumption of fertilisers to 4.3 per cent in the 1990s from 7.8 per cent in the 1980s, with wide variations across States.
iii) Unbalanced Use of Inputs
3.51 Various subsidies on inputs have resulted in skewed and unsustainable usage of inputs. To illustrate, subsidies on urea have resulted in unbalanced use of Nitrogen (urea), Phosphorus (phosphate), Potassium (potash) fertilisers (which was in the ratio of 8.5: 3.1: 1 in 1998-99 as against the desirable ratio of 4:2:1) and aggravated deficiency in use of micro-nutrients (Government of India, 2000). Subsidies on other inputs such as provision of electricity at nominal rates for irrigation pumps continue in various States. Subsidised electricity for irrigation purposes has resulted in proliferation of ground water drawing machinery such as pump sets and tubewells, which have implications for groundwater sustainability (Vaidyanathan, 1996). This also has adverse implications for equity since such machinery is capital intensive, and hence, the actual benefits derived by small farmers are debatable. Furthermore, subsidies on electricity and diesel have led to the cultivation of water intensive crops such as rice and wheat, with skewed consumption of nitrogenous fertilisers leading to an unsustainable cropping pattern. Moreover, private sector capital formation in irrigation typically favours digging of wells, as this practice has the advantage of excludability, as opposed to the non-excludable nature of canal irrigation. However, it needs to be recognised that such implements draw water from ground water table, which covers larger area beyond a farm size. This means that farmers with larger capacity pumps can actually draw water away from the water table adjoining their farms, and at a faster rate than those with smaller pumps (Dhawan, 1996). This tendency clearly has adverse impact on the level of water table and the ability of small and marginal farmers to irrigate their farms. Ground water being a common public resource, there is a necessity to rationalise the access and utilisation of the same. Appropriate user charges on electricity and diesel, could have a favourable impact on rational utilisation of water resource. Alternative arrangements of common property resource management, such as user cooperatives may result in better management and conservation of this public good.
iv) Decline in Public Investment
3.52 The subdued performance of Indian agriculture in the 1990s is often attributed to a secular decline in the rate of public investment in agriculture. It is argued that decelerating public sector capital formation in agriculture, which goes primarily towards major irrigation, has serious implications for the private sector investment in minor irrigation.7 The ratio of public sector capital formation in agriculture to Gross Public Sector Capital Formation has declined from 17.7 per cent in 1980-81 to 7.1 per cent in 1990-91 and further to 4.9 per cent in 2000-01. Capital formation in agriculture as a ratio of GDP originating from agriculture also decreased from 8.5 per cent in 1980-81 to 6.1 per cent in 2000-01. However, private sector capital formation in agriculture has been on the rise during the same period. In this connection, it needs to be noted that about 90 per cent of public sector capital formation in agriculture is invested in major and medium irrigation facilities, while most of the private sector capital formation goes towards minor irrigation facilities like pump sets.
3.53 Although the private sector capital formation in agriculture has been on the rise, fixed capital formation by the household sector has been on the decline (Sawant et al, 2002). Furthermore, private sector capital formation was found to be responsive to availability of water (canal intensity) and inputs (electricity) in any given year (Dhawan, 1996). It is worth mentioning in this regard that major and medium irrigation facilities have a long gestation period (10-12 years) and hence, private sector capital formation would respond to a greater degree to the cumulative capital formation in agriculture rather than that in any given year. Thus, the declining capital formation in agriculture seems to be a result of reduced investment in irrigation over a long period covering both the 1980s as well as the 1990s (Gulati and Bathla, 2001).
3.54 It is clear that the inadequacy of new capital formation has slowed the pace and pattern of technological change in agriculture with adverse effects on productivity. In this context, there are apprehensions that the boost in output from subsidy-stimulated use of fertilisers, pesticides and water may partly be at the expense of deterioration in aquifers and soil, and hence is environmentally unsustainable (Government of India, 2000). This, to some extent, explains the rising costs and slackening growth and productivity in agriculture.
v) Credit Delivery System
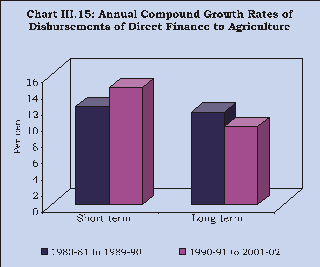
3.55 Lack of adequate credit for investment is an important impediment to expansion of acreage under HYV seeds and the use of optimum dose of inputs (Sarap and Vashist, 1994). Furthermore, adequate credit plays a crucial role in augmenting private sector capital formation. The annual compound growth rate of direct institutional credit (disbursements) to agriculture and allied activities improved marginally from 12.0 per cent during the 1980s to 12.7 per cent during the 1990s. However, the credit delivery scenario at the disaggregated level in the 1990s is somewhat unsettling as there is a deceleration in the scheduled commercial banks’ disbursements of direct finance to small farmers from 15.1 per cent in the 1980s to 11.0 per cent in the 1990s. Similarly, the annual compound growth rate of direct finance (disbursements) to marginal farmers, decelerated to 13.0 per cent from 18.1 per cent during the same period. The annual compound growth rates of medium/long term loans disbursed to agriculture and allied activities (direct advances), which are important for private sector capital formation in agriculture, have shown deceleration to 9.7 per cent in the 1990s from 11.5 per cent in the preceding decade. However, the disbursements of short-term loans have accelerated from 12.2 per cent to 14.5 per cent during the same period. The shift in the composition of the agricultural loans in favour of short-term advances is a matter of some concern, as it is likely to further accentuate the declining private sector capital formation in agriculture (Chart III.15).
Burgeoning Food Stock: Some Macro Implications
3.56 Another issue that has assumed significance in the recent period is the large food stocks and their macro implications. It may be recalled that in order to ensure food security to the vast population of the country, an elaborate system of public procurement and distribution of foodgrains was evolved as a part of a conscious strategy. As per this strategy, the Food Corporation of India (FCI) was established in 1965 and a detailed price support mechanism was formulated. The system, despite various infirmities, worked reasonably well till the late 1970s. Since then, primarily due to the expansion of production possibility frontier under the Green Revolution, domestic production of foodgrains started to keep pace with the requirement of public distribution system. With the emergence of successive 'normal' monsoons during the 1990s, the prevalence of a distorted price mechanism resulted in large accumulation of food stocks with the official agencies during the second half of the 1990s. Two major issues that have come to the forefront of public policy debate in this regard are: What are the factors behind the burgeoning food stocks? And, what are its macro-financial implications for the economy? This sub-section takes a look into these two questions.
Some factors behind the burgeoning food stocks
3.57 Burgeoning food stocks with the official agencies can be attributed to an increase in procurement, a reduction in off-take or a combination of both. A number of factors like distorted price incentives for agricultural products and shift in consumption pattern have added to this phenomenon.
i) Price Interventions
3.58 Price interventions by the Government by way of Minimum Support Prices (MSP) have resulted in some distortions in cropping pattern. One of the major factors influencing the cropping pattern is the income accruing to the farmer or expected income from cultivating a crop. Generally, low yield rates of pulses and coarse cereals among foodgrains generate lower income for farmers than rice and wheat. Moreover, the price support operations have been skewed in favour of rice and wheat, which have benefited significantly by the elaborate procurement operations in conjunction with the rising MSP. On the other hand, coarse cereals and pulses do not seem to have been procured by the public sector agencies on a comparable scale. Furthermore, in contrast to that of rice and wheat, the cost of production of coarse cereals and pulses has been generally higher than the MSPs during the period 1983-84 to 1997-98 (Table 3.12). This makes the cultivation of rice and wheat more attractive than pulses and coarse cereals. The higher relative yields of wheat and rice further increase the assured income per hectare (in terms of MSP multiplied by the per hectare yield). The increasing MSPs and higher yields in wheat and rice, thus, accentuate the difference in expected income from coarse cereals/pulses vis-à-vis wheat and rice. The rising MSPs and higher procurement of rice and wheat coupled with unattractive assured incomes from cultivation of pulses and coarse cereals have, thus, induced farmers to cultivate rice and wheat more than other foodgrains crops.
Table 3.12 : Cost of Production and Msps of Foodgrain Crops | ||||||||||
(Rupees per quintal) | ||||||||||
Year | Paddy | Wheat | Coarse Cereals | Gram | Arhar | |||||
Cost | MSP | Cost | MSP | Cost | MSP | Cost | MSP | Cost | MSP | |
1 | 2 | 3 | 4 | 5 | 6 | 7 | 8 | 9 | 10 | |
1983-84 | 124 | 132 | 142 | 152 | 117 | 124 | 249 | 240 | N.A | 245 |
1985-86 | 123 | 142 | 133 | 162 | 143 | 130 | 235 | 260 | 345 | 300 |
1990-91 | 213 | 205 | 206 | 225 | 231 | 180 | 448 | 450 | 604 | 480 |
1991-92 | 253 | 230 | 232 | 275 | 319 | 205 | 482 | 500 | 837 | 545 |
1992-93 | 270 | 270 | 261 | 330 | 293 | 240 | 559 | 600 | 759 | 640 |
1993-94 | 267 | 310 | N.A | 350 | N.A | 260 | N.A | 640 | N.A | 700 |
1994-95 | 344 | 340 | 324 | 360 | 330 | 280 | 616 | 670 | 764 | 760 |
1995-96 | 341 | 360 | 346 | 380 | 490 | 300 | 704 | 700 | 914 | 800 |
1996-97 | 375 | 380 | 389 | 475 | 463 | 310 | 837 | 740 | 824 | 840 |
1997-98 | 411 | 415 | 418 | 510 | 499 | 360 | 783 | 815 | 1221 | 900 |
Source : | Compiled on the basis of information from the Ministry of Agriculture, Government of India. | |||||||||
ii) International Price Environment
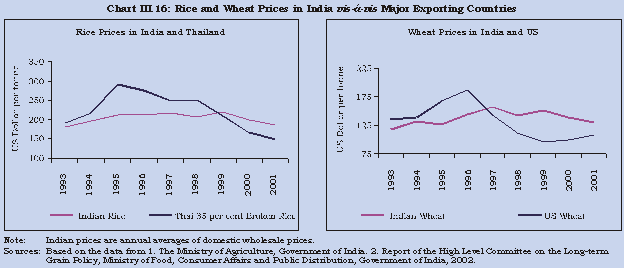
3.59 Protectionist atmosphere for foodgrains production coupled with various restrictions on imports and exports, generally led to higher domestic prices of rice and wheat. In contrast to the partial rigidity in the Indian prices of rice and wheat in the 1990s, there was a sustained decline in international prices (Table 3.13 and Chart III.16). Increasing domestic prices of rice and wheat in the face of declining prices of the same in the international market have shielded farm incomes from international price volatility, but adversely impacted on the price competitiveness of Indian exports of foodgrains, and led to increasing dependence of farmers on procurement operations for market clearance.
3.60 The wholesale price of rice in India during 1993 to 2001 was on an average lower than that in Thailand for the same period. The average wholesale price of wheat in India in this period was slightly higher than the US Soft Red Winter (SRW) variety, but lower than those of US Hard Red winter (HRW) and Canadian varieties. If the current downtrend in international prices of rice and wheat is cyclical, they are likely to rise above Indian prices, thus, making Indian rice and wheat competitive. Even if there is a secular decline in international prices, the Indian prices can still be competitive, provided, the Aggregate Measure of Support (AMS) by the US and European countries is reduced to WTO compatible levels.
Table 3.13 : Trends in World Agricultural Commodity Prices | ||||||
(US Dollar per Metric Tonne) | ||||||
Wheat | Rice | |||||
Year | US* | India | Thailand ** | India | ||
1 | 2 | 3 | 4 | |||
1993 | 134.8 | 118.1 | 191.4 | 181.4 | ||
1994 | 138.6 | 132.2 | 218.5 | 197.0 | ||
1995 | 167.4 | 126.7 | 290.2 | 212.8 | ||
1996 | 187.4 | 143.6 | 275.8 | 213.4 | ||
1997 | 143.7 | 158.2 | 246.8 | 216.9 | ||
1998 | 111.5 | 141.5 | 249.7 | 207.1 | ||
1999 | 96.3 | 150.5 | 210.5 | 220.2 | ||
2000 | 98.9 | 138.9 | 167.2 | 198.4 | ||
2001 | 107.7 | 131.0 | 149.1 | 187.7 | ||
* | SRW variety. | |||||
** | Refers to 35 per cent broken rice. | |||||
Note : | The domestic prices of rice and wheat are annual average wholesale prices. In order to enable Comparability to international pices, domestic prices are deflated by the average nominal exchange rate(US dollar). | |||||
Sources: | 1. | Ministry of Agriculture, Government of India. | ||||
2. | Report of the High Level Committee on Long-term | |||||
Grain Policy, Ministry of Food, Consumer Affairs and | ||||||
Public Distribution, Government of India, 2002. | ||||||
iii) Increasing procurement
3.61 The increased cultivation of rice and wheat in the 1990s supported by the consecutive good monsoons, has played an important role in large-scale procurement. However, as mentioned earlier, increase in support prices, mainly due to the change in methodology of including the 'statutory minimum wages' instead of 'actual wages' paid in computing the cost of cultivation, coupled with lack of international competitiveness and restrictions on international trade of foodgrains seem to be the main causative factors underlying increasing procurement. The system of compulsory levy procurement and the restrictions on movement of foodgrains under the Essential Commodities Act, 1955 also contributed to increasing procurement operations. The ever-increasing MSPs of rice and wheat and the compulsory procurement coupled with the protectionist atmosphere, ensured market clearance for rice and wheat and thereby created a vicious circle of increasing MSPs - higher procurement - larger cultivation of rice and wheat-increasing production and generation of higher marketable surplus - lack of export competitiveness -increasing procurement further.
iv) Decline in Off-take
3.62 The off-take of foodgrains in the 1990s was generally low. This was partly due to limited open market operations because of higher price for low quality foodgrains that were made available through PDS, which also led to lower off-take by the actual PDS beneficiaries. Altered consumption pattern of the population due to improving income levels and lacklustre export performance also explain the decline in off-take through PDS. Inadequate institutional arrangements for quick and timely delivery in areas of greater need and linking delivery to specific requirements were also contributing factors.
Rise in Issue prices and Targeted Public Distribution System
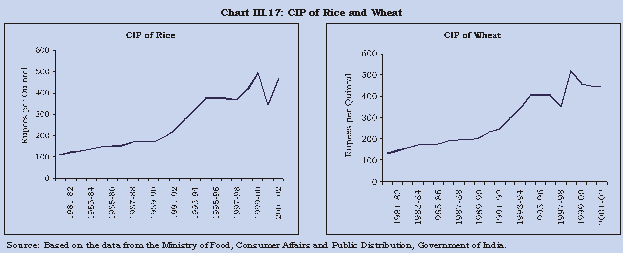
3.63 Consumer prices reflected in the Central Issue Price (CIP) have witnessed a rise since the inception of TPDS (Chart III.17). The TPDS was introduced in 1997 in order to achieve better targeting of subsidies. Under the TPDS, a dual price mechanism for the APL (Above the Poverty Line) and BPL (Below the Poverty Line) consumers was introduced. The full economic cost of foodgrains was recovered from the APL consumers, while foodgrains were sold at half the economic cost to the BPL consumers. Successive increases in MSPs of rice and wheat and attendant increase in economic cost of foodgrains necessitated an increase in CIP for APL consumers, which resulted in narrowing the gap between open market prices of foodgrains and the CIPs. This led to a drastic reduction in off-take under TPDS (Government of India, 2002b). For instance, the off-take under TPDS declined by 29.5 per cent to 12.0 million tonnes in 2000-01 from 17.1 million tonnes in the previous year.
Shift in Consumption Pattern
3.64 Apart from the increasing CIPs, the changes in consumption pattern towards milk, eggs and meat, as against cereals, partly caused the decline in off-take. Recent studies, based on NSS data on consumption expenditure, show that there has been a decline in the share of food in the total expenditure among both the poor and non-poor, despite relatively lower prices of cereals (Bhalla et al, 1999; Meenakshi, 2000).
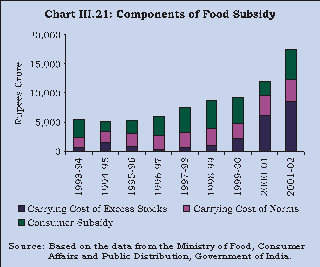
3.65 Thus, domestic off-take has been low vis-à-vis the procurement of the foodgrains, resulting in the problem of growing stocks. The implications of the mounting food stocks are manifold. Apart from price implications that emanate from MSP, it adds to storage and maintenance costs in presence of limited off-take, thereby imposing high fiscal costs in the form of food subsidy. To the extent the bourgeoning food stocks are financed by preferential food credit, they have monetary implications as well.
Monetary Implications of Growing Foodgrain Stocks
3.66 The monetary implications of increasing food stocks emanate essentially from the increasing procurement of foodgrains. The higher demand for food credit can give rise to possible crowding-out effects on other sectors. It can also affect the interest rate and the credit risk profile of the banking system arising out of deteriorating quality of foodgrain stocks, which act as collateral for food credit. As a result of unprecedented rise in foodgrain procurement operations, food credit registered a marked uptrend from Rs.4,506 crore as at end-March 1991 to Rs.53,978 crore as at end-March 2002 (Table 3.14). Consequently, the share of food credit in total commercial bank credit has increased from 3.9 per cent to 9.2 per cent during the same period.
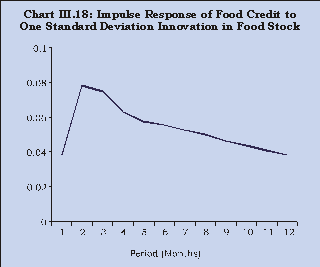
3.67 Given the persistence of significant deficit on the revenue account of the Central Government, any increase in food subsidy (caused by increasing procurement) implies equivalent increase in market borrowing by the Central Government. Furthermore, the higher demand for resources may engender a tighter liquidity position, particularly during conditions of strong economic activity, which in turn could affect the interest rate. If monetary conditions were to remain unaffected, banks would have to raise additional resources through refinance or reallocate existing assets in order to meet the higher non-food credit demand. Presently, refinance from the Reserve Bank is not allowed against food credit. In the absence of any food credit refinance facilities, banks may reduce their holding of government securities, which could imply higher holding of securities by the Reserve Bank, increasing thereby the monetary base indirectly. This would lead to reserve money expansion and, ceteris paribus, would result in an increase e in money supply over the medium-term through the money multiplier process with possible inflationary effect. Since food credit is provided out of the lendable resources of banks, any further increase in non-food credit demand would reduce the resources available to banks for lending to other sectors thereby exerting an upward pressure on interest rates (Box III.1).
Table 3.14 : Share of Food Credit (Outstanding) in the Commercial Bank Credit | |||
(Rupees crore) | |||
Year | Bank Credit | Food Credit | Food Credit |
as a per cent | |||
of Bank Credit | |||
1 | 2 | 3 | |
1980-81 | 25,371 | 1,759 | 6.9 |
1985-86 | 56,067 | 5,535 | 9.9 |
1990-91 | 1,16,301 | 4,506 | 3.9 |
1995-96 | 2,54,015 | 9,791 | 3.9 |
1996-97 | 2,78,401 | 7,597 | 2.7 |
1997-98 | 3,24,079 | 12,485 | 3.9 |
1998-99 | 3,68,837 | 16,816 | 4.6 |
1999-00 | 4,35,958 | 25,691 | 5.9 |
2000-01 | 5,11,434 | 39,991 | 7.8 |
2001-02 | 5,89,723 | 53,978 | 9.2 |
Box III.1 The monetary implications of food credit (i.e., the credit advanced to FCI for carrying out the procurement and distribution operations) emerge from their impact on money supply and on interest rates. Since equiproportionate gains in output may not occur, excess liquidity could add to the inflationary potential in the economy. From the policy perspective, the impact of food credit on money supply, though small, is of some relevance in monetary management and the degree of sensitivity of monetary policy would depend on both the actual quantum of food credit and the observed trend in its movement. Impact on Interest Rates The manner in which growing food stocks impact on the evolution of the short-term interest rates in the system is important from the viewpoint of the conduct of the monetary policy. As the food stocks accumulate beyond optimal levels (mainly due to increasing procurement), there is higher demand for the food credit from the banking system. Food credit being mandated in nature, growth in food stocks contemporaneously results in higher food credit. For a given level of money supply, the pressure on the non-food credit increases and depending on the magnitude of pre-emption of funds for food credit, the interest rate could rise. The interest charge component of carrying cost of buffer stocks has increased steadily at the compound growth rate of above 15 per cent since 1992-93. Since the carrying cost of buffer stock forms a part of the food subsidy, such hefty increase in interest charges will impart an upward pressure on the quantum of food subsidy. In fact, in the recent years, the carrying cost component of food subsidy far exceeded that of the consumer subsidy. The interest rate impact of the food credit from the banking system has been analysed in an unrestricted VAR framework. The model consists of food stocks (Lstock), food credit (Lfcr), short-term interest rates (i.e., call rates) (Rcall) and non-food credit (Lnfcr). Food credit and non-food credit were taken as ratios to domestic assets of the banking system. The ordering of the variable in the VAR was Lstock, Lfcr, Rcall, Lnfcr. A dummy variable was used in the system for the period September 2001 onwards to neutralise the impact of cyclical downturn on interest rates. The order of VAR in the model was two. The impulse response derived from the above unrestricted VAR framework provides evidence of the interest rate impact of large food stocks. Shocks to food stocks cause sharp rise in food credit for three months, but the impact of the shock peters out thereafter (Chart III.18). As the non-food credit demand rises, the short term interest rate moves upwards for about six months and then stabilises (Chart III.19). In the current milieu of progressive liberalisation of the banking system and a shift by banks towards integrated asset-liability management, there is a need to explore the scope for a gradual scaling down of this large outstanding amount.
|
The Fiscal Impact of Food stocks
3.68 Apart from the monetary implications, growing food stocks have fiscal impact, arising from the growing food subsidy and its concomitant impact on the revenue deficit of the Central Government. The food subsidy is the operational deficit in the economic cost of foodgrain operations on one hand and the income accruing to the FCI through sales under PDS, open market sales including exports, and other welfare schemes at issue prices fixed by the Government on the other. The food subsidy rose moderately from Rs.2,450 crore in 1990-91 to Rs.5,377 crore in 1995-96 and then rapidly to Rs.17,499 crore in 2001-02 and accounted, on an average, 4.1 per cent of Central Government expenditure (Chart III.20).
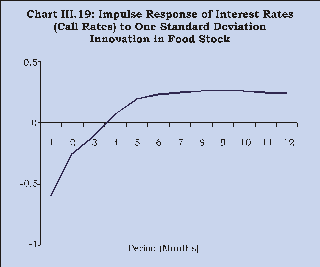
3.69 The food subsidy comprises two components: consumers’ subsidy and the subsidy pertaining to the carrying cost of buffer stock. The carrying cost is the cost incurred by the FCI for inventory management, while consumer subsidy is food subsidy net of carrying cost. The amount of consumer subsidy depends on the volume of foodgrains distributed through the PDS and the carrying cost is determined by the volume of the inventory with the FCI.8 While carrying cost on maintaining the stocks at buffer norm levels is a price for food security, the carrying cost on excess stocks over and above buffer norms may be considered as a kind of implicit producers’ subsidy.9 In other words, if the stocks were to be maintained at the levels of prescribed norms, given the off-take, procurement would have to be less by the extent of excess stocks and hence, lesser total outgo in terms of carrying cost. In recent years, the share of carrying cost for excess stocks over and above norms (i.e. , the implicit producers’ subsidy) in total food subsidy far exceeded that of the consumer subsidy (Chart III.21).
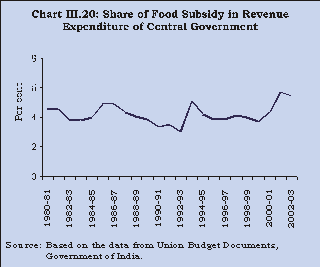
3.70 The composition of food subsidy has, over the years, evolved in such a way that implicit producers’ subsidy emerged as the largest component (48.9 per cent in 2001-02 from 12.8 per cent in 1993-94) with a corresponding erosion in the share of the consumer subsidy (29.2 per cent in 2001-02 from 56.5 per cent in 1993-94) and subsidy pertaining to maintaining the stocks at the buffer norm levels (21.9 per cent in 2001-02 from 30.7 per cent in 1993-94). This implies that a larger portion of the subsidy is being spent on carrying costs, rather than on meeting the original aim of subsidising the consumers through the PDS.
3.71 Food procurement operations of the FCI also imply contingent liabilities for the Central Government. The food credit outstanding must always be fully matched by the value of paid stocks of foodgrains, evaluated as per the banking norms. In this connection it raises concern regarding the procedure for evaluating the quality and quantity of stocks (which act as collateral for the extension of food credit by virtue of their marketability), as these will have an impact on the quality of outstanding advances of commercial banks. This becomes crucial in the light of the finding that on an average 10 per cent of the annual production of foodgrains is wasted annually on account of inadequate storage facilities (Radhakrishna et al, 1997). As food credit is government guaranteed, deterioration in the quality of food stock, in the final analysis, implies a further loss on the Government account as these guaranteed stocks result in cash outflows (in terms of food subsidy) in the budget, which is the fiscal impact of growing stocks (Box III.2).
Box III.2 It has generally been recognised that growing food stocks contribute to weakening fiscal position of the Government. The direct impact of the food subsidies on the budget is in the form of rising subsidies to finance the operational deficit of the FCI. Given the mainly exogenous nature of the Government revenues which are largely determined by the output growth in the economy, an increase in subsidy directly leads to a rise in the revenue deficit of the Government. This, in turn, leads to widening of the fiscal deficit or the aggregate borrowing requirements of the Government. A structural model was formulated to analyse the fiscal impact of food stock comprising 6 behavioural equations and five identities. The model consists of 7 exogenous and 4 lagged endogenous variables.10 The model covers the sample period 1975-76 to 2001-02, and establishes linkages between the food stock operations and the fiscal accounts. The model is estimated by two stage least square (2SLS) simulation. The model is tested for convergence and meaningful results are obtained in this regard. The estimates of the model reveal that the coefficients have expected signs and are statistically significant. In each of the equations, the coefficient of determination (Adj.R2) is reasonably high and computed Durbin-Watson (DW) statistic indicated absence of serial correlation. In the model framework, the fiscal impact of the food stocks is analysed in a medium-term time frame.11 The main issue examined here is the impact of distortionary support prices on accumulation of foods stocks and the current expenditure of the Government. It is analysed how the reduction in procurement prices of rice and wheat to the level recommended by the Commission on Agricultural Costs and Prices (CACP) would translate into reduced subsidies for the Government and hence, a lower revenue deficit. It is evident from the Chart III.22 that if MSP of wheat and rice were retained at the level recommended by the CACP, the revenue deficit of the Government would have consistently declined by about 13 per cent in the terminal period of the simulation. This provides evidence of the magnitude of fiscal distortions resulting from the existing food stock operations.
|
3.72 It may be noted, however, that the stocks have been on the decline since 2001-02 mainly due to persistent efforts made by the Government to increase off-take primarily through exports. The reduction in CIP for APL consumers in July 2001 had also resulted in some improvement in the off-take on the TPDS front. The strategy of increasing exports at the BPL prices can at best be sustained in the short-run only, as the exports depend on various factors other than the prices of the grains. As for the immediate future, the first half of 2002 has seen grain prices rise largely due to adverse weather conditions in the United States, Canada and Australia. The price increase in the near term, however, seems limited due to higher competition from other producers such as Argentina and Brazil and the restoration of export subsidies by the European Union (IMF, 2002). Further, the US Farm Bill, which aims at increasing price support and expanding support to new crops, may also dampen the prospects of sustained increases in the prices of foodgrains. The world price scenario that may prevail in the long run is not clear. Relying on exports of foodgrains, therefore, could only be a short-term strategy for increasing off-take and lowering stocks. In the long run, there is a need to boost export competitiveness, through both price and non-price factors, to overcome the problem of growing stocks.
Summing Up
3.73 The supply response of Indian agriculture, though predominantly determined by monsoon, has also been significantly influenced by structural bottlenecks such as inadequate infrastructure, particularly in irrigation. Furthermore, the successive increases in MSPs of rice and wheat in contrast to declining world prices has led to reduced export competitiveness of Indian rice and wheat. The rising MSPs of rice and wheat also favoured their increased cultivation, leading to higher procurement. As opposed to growing procurement, the off-take has been low due to increasing CIPs on one hand and the changes in consumption pattern away from cereals to non-traditional food items on the other. Thus, the increasing procurement and low off-take resulted in mounting foodgrain stocks, which have had monetary and fiscal implications, particularly in terms of the unprecedented growth in food subsidy. The growth in food subsidy has serious opportunity costs, especially in terms of investment in irrigation and other infrastructure, which in turn would have facilitated higher agricultural growth.
3.74 Irrespective of the fiscal costs that are imposed by the increasing MSPs by way of aiding increased procurement, it is worthwhile to reiterate that it serves the role of price stabilisation. The policy intervention to support agriculture is less in India, than in many OECD countries. If the level of subsidies accorded to these commodities is reduced in USA and European countries, Indian cereal production would retain competitiveness. It can be said that the Indian price policy has provided a modicum of income protection to farmers, albeit with fiscal costs.
3.75 It is interesting to note that the recent predicament of mounting foodstocks occurred despite a deceleration in agricultural growth. It is quite possible that the foodgrain stock piling could have been much more, had there been higher growth in rice and wheat production. The increasing production of rice and wheat, in conjunction with the increasing MSPs would have resulted in much higher procurement, mainly due to inadequate market clearance caused by the declining demand for cereals. This would have led to larger levels of stocks and hence, higher economic costs.
1. Henceforth, the first phase of reforms refers to the period 1992-93 to 1996-97 and the second phase of reforms refers to the period 1997-98 to 2002-03.
2. The output gap represents the difference between the actual output and the potential output worked out on the basis of the filtered series using the Hodrick-Prescott (HP) Filter. Technically, the HP filter is a two-sided linear filter. The time series are decomposed into trend and cyclical components. The smoothed series are obtained by minimising the variance of series around its trend components. The smoothing parameter is taken as 100 for smoothing the annual series.
3. Results of Granger Causality test between nominal saving growth and GDP growth for the sample, 1950-51 to 2000-01, are as follows:
Null Hypothesis | Test Statistic (Chi Square) | Accept / Reject Null Hypothesis | |||||
Saving does not Granger cause GDP Growth | 9.71* | Reject | |||||
GDP Growth does not Granger cause Saving | 21.31* | Reject | |||||
* | Significant at 1 per cent level. | ||||||
4. Functional relationship between bank deposits and interest rates for the sample period: 1981-82 to 2000-01
LBD = -4.08+0.006RR+1.07*LPDI. | ||
(0.43) | (22.29) | |
R2 = 0.97, DW=1.57 ; where, LBD = Log of saving in bank deposits, LPDI= Log of personal disposable income, RR= Real rate of interest on bank deposits (3-5 years), and * Significant at 1 per cent level.
5. The ICOR can be susceptible to transitory flutuations, and is thus smoothened using the HP filter.
6. The correlation co-efficient between rainfall and production for major crops are: rice (0.26), wheat (0.27), coarse cereals (0.37), pulses (0.61), oilseeds (0.34), sugarcane (0.21) and cotton (0.16).
7. See among others, Dhawan (1996) for complementarity between public sector investment in major irrigation and private sector investment in minor irrigation.
8. As consistent and reliable information on the farm harvest prices (FHPs) is not available for the 1990s, it is difficult to assess the producers’ share of the food subsidy accruing on account of higher MSPs vis-à-vis the FHPs. However, MSPs form a part of the economic cost which ultimately affect the consumers’ subsidy.
9. Similarly, implicit subsidy to the producers measured through carrying cost as also cost for the food security depend on the efficiency in the handling of the stock by the FCI. Higher the efficiency lower will be the carrying cost and vice-versa. Incidentally, variables relating to food management generally under control of the FCI such as procurement incidentals and carrying cost have increased in the 1990s at the rate of 12.1 per cent and 10.2 per cent, respectively, as compared to MSPs (8.6 per cent) and distribution cost (3.0 per cent). This indicates that operations of the FCI are not cost effective. To that extent implicit subsidy to the producers and cost of food security have been over-estimated.
10. The role of international prices of rice and wheat was examined in affecting the off-take of food stocks and food subsidy indirectly, apart from providing stability to the model. However, the impact did not turn out to be significant possibly due to the fact that till recently, trade in foodgrains was highly restricted.
11. The impact of cost of inventories of the FCI is likely to be significant in influencing the subsidies and consequent revenue deficits. However, these could not be directly integrated in the model due to non-availability of a reasonable time series data on the carrying cost.
ಪೇಜ್ ಕೊನೆಯದಾಗಿ ಅಪ್ಡೇಟ್ ಆದ ದಿನಾಂಕ:


