 IST,
IST,
Industrial Outlook Survey- Q2: 2014-15 (Round 67)
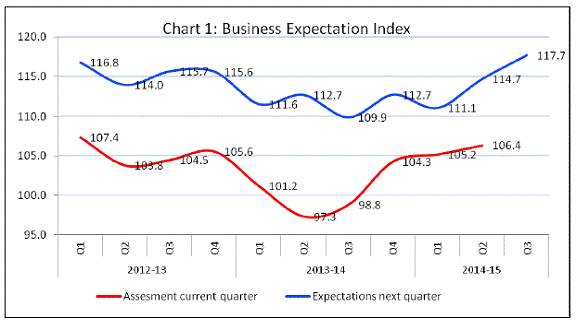
The Industrial Outlook Survey conducted during July-September 2014, provides qualitative assessment of business situation of companies in the Indian manufacturing sector for Q2:2014-15 and their expectations for the ensuing quarter Q3:2014-15. The survey elicited early response from 1,225 manufacturing companies. Highlights:
 Expectation (Q3:2014-15)
Assessment (Q2:2014-15)
1 Net Response (NR) is the difference of percentage of the respondents reporting optimism and that reporting pessimism. The range is -100 to 100. Any value greater than zero indicates expansion/optimism and any value less than zero indicates contraction/pessimism i.e. NR = (I – D); where, I is the percentage response of ‘Increase/optimism’, and D is the percentage response of ‘Decrease/pessimism’ and E is the percentage response as ‘no change/Equal’; I+D+E=100. 2 The Business Expectation Index (BEI), which is a composite indicator calculated as weighted net response of nine business parameters, gives a single snapshot of business outlook in every quarter. The range of BEI lies between 0 to 200, and 100 is the threshold line separating expansion from contraction. |
|||||||||||||||||||||||||||||||||||||||||||||||||||||||||||||||||||||||||||||||||||||||||||||||||||||||||||||||||||||||||||||||||||||||||||||||||||||||||||||||||||||||||||||||||||||||||||||||||||||||||||||||||||||||||||||||||||||||||||||||||||||||||||||||||||||||||||||||||||||||||||||||||||||||||||||||||||||||||||||||||||||||||||||||||||||||||||||||||||||||||||||||||||||||||||||||||||||||||||||||||||||||||||||||||||||||||||||||||||||||||||||||||||||||||||||||||||||||||||||||||||||||||||||||||||||||||||||||||||||||||||||||||||||||||||||||||||||||||||||||||||||||||||||||||||||||||||||||||||||||||||||||||||||||||||||||||||||||||||||||||||||||||||||||||||||||||||||||||||||||||||||||||||||||||||||||||||||||||||||||||||||||||||||||||||||||||||||||||||||||||||||||||||||||||||||||||||||||||||||||||||||||||||||||||||||||||||||||||||||||||||||||||||||||||||||||||||||||||||||||||||||||||||||||||||||||||||||||||||||||||||||||||||||||||||||||||||||||||||||||||||||||||||||||||||||||||||||||||||||||
ಪೇಜ್ ಕೊನೆಯದಾಗಿ ಅಪ್ಡೇಟ್ ಆದ ದಿನಾಂಕ:


