 IST,
IST,


IV. Monetary and liquidity Conditions
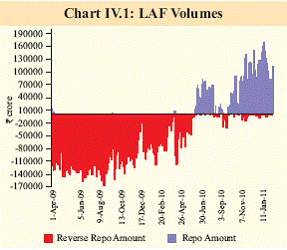
Liquidity conditions remained tight during the third quarter of 2010-11, warranting liquidity easing measures by the Reserve Bank. The normalisation of monetary policy during the year, as intended, has been non-disruptive. Conditions for enhancing the effectiveness of monetary policy, however, improved in the third quarter of the year, as the tightness in liquidity prompted competition among banks, leading to higher deposit and lending rates. The Reserve Bank injected large primary liquidity through repo and open market operations, which was reflected in the high growth of base money. This was necessary to avoid the risk of liquidity stress adversely impacting the real economy, even though the overall anti-inflationary stance was sustained throughout. While the goal of non-disruptive normalisation of monetary stance has been achieved with the return of robust growth, persistent high inflation has emerged as the key challenge for monetary policy IV.1 The Reserve Bank achieved nondisruptive normalisation between March and November 2010 through calibrated tightening of the policy interest rates and liquidity conditions. The predominant objective behind adopting such an approach to normalisation was to gradually raise the anti-inflationary accent of the policy without disrupting growth. While growth has firmly consolidated around the trend now, inflation remains elevated with significant downward inflexibility. The interest rate and liquidity conditions altered significantly during the course of the year on the back of policy normalisation. In the terminal months of 2010, liquidity conditions tightened beyond the comfort level, driven by both frictional and structural factors, and interest rate transmission also strengthened as banks responded to the liquidity deficit by raising deposit and lending rates. The Reserve Bank undertook measures to ease the liquidity pressures to avoid the risk of liquidity stress affecting the flow of credit to productive activities. The anti-inflationary stance of monetary policy, however, continued. Liquidity conditions started to tighten on the back of policy, but got exacerbated by autonomous factors IV.2 In 2010, the repo and the reverse repo rates were raised by 150 basis points and 200 basis points, respectively, as part of the normalisation of policy (Table IV.1). With repo rate emerging as the operative policy rate, there was an effective tightening of policy rate by 300 basis points between March and November 2010. The increase in cash reserve ratio (CRR) in February and April 2010 contributed to the gradual tightening of liquidity and the effective switch of the Liquidity Adjustment Facility (LAF) from absorption through reverse repo to injection through repo (Chart IV.1). From end- May 2010, liquidity tightened on account of the monetary policy actions, which was exacerbated by autonomous factors such as large increase in government surplus with the Reserve Bank as well as the unusually high demand for currency on account of high inflation, increased asset prices and payments under government schemes such as MGNREGS. As deficit liquidity conditions persisted for most part of the year and the severity of the pressure at times became excessive, the Reserve Bank operationalised several liquidity-easing measures at regular intervals in order to reduce the liquidity deficit (Table IV.2).
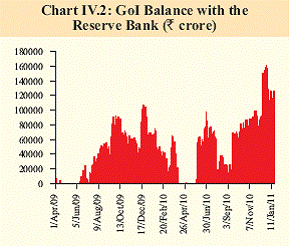
IV.3 The tight liquidity conditions during the third quarter of the year were mainly the result of autonomous factors, i.e., increase in the government’s surplus balance with the Reserve Bank and currency with the public. The Reserve Bank managed the liquidity conditions primarily through operations under the LAF and OMO, by means of which large amount of primary liquidity was injected into the system (Table IV.3). Frictional tightness in liquidity reflected unusually large government surplus balances with the Reserve Bank IV.4 The tight liquidity conditions since end- October 2010 were primarily on account of unusually large unspent cash balances of the government. During the third quarter of 2010- 11, the government surplus with the Reserve Bank hovered in the range of 1.0 to 3.0 per cent of net demand and time liabilities (NDTL) of banks (Chart IV.2). The effective impact on liquidity, therefore, was equivalent to an increase in CRR by 100-300 basis points. IV.5 It may be noted that in 2009-10, the surplus balance of the government helped in modulating the liquidity overhang in the system. With the change in the liquidity conditions from the previous year, however, the same factor widened the deficit in liquidity to the extent of becoming a source of stress for the financial system. Since government’s surplus balances only reflect the temporary mismatch in their cash flows on receipts and expenditure side, this factor is generally seen as a frictional determinant of autonomous liquidity. The unusually tight liquidity in the system in recent months has been a result of this frictional factor persisting longer than usual.
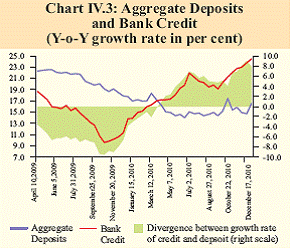
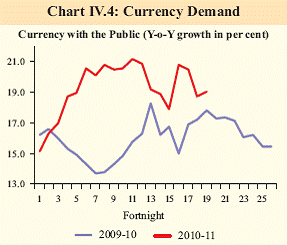
Structural imbalance between deposit and credit growth and above trend growth in currency added to the liquidity pressure IV.6 The divergence between the growth rates of credit and aggregate deposits of SCBs widened during the third quarter of 2010-11 (the gap peaked at 9 percentage points in mid- December), emerging thereby as a structural source of pressure on liquidity (Chart IV.3). During the quarter, up to mid-December, banks mobilised `88,514 crore of deposits and lent out `2,14,638 crore of credit. This mismatch partly reflected the delayed response of banks in raising deposit rates, even though the monetary policy stance had provided the signals for timely response by the banks. With active deposit mobilisation in the last reporting fortnight of December 2010, the mismatch narrowed considerably. IV.7 The subdued deposit growth partly reflected the higher growth in currency demand in 2010-11 (Chart IV.4). Increase in currency with the public is another autonomous factor which drains liquidity from the system. The growth rate of currency with the public during the year so far has been, on average, 3.4 percentage points higher than during the corresponding period of last year. Moreover, the third quarter of the financial year typically registers an increase in currency demand due to the festive season. The observed pattern in currency demand and deposit, reflected partly the normal response to high inflation and persistent low or even negative real return on deposits.
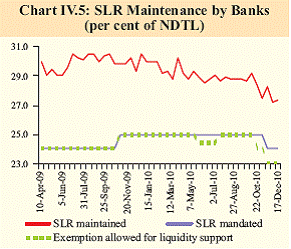
With room for collateralised borrowing by banks from the Reserve Bank getting smaller, lowering of SLR requirement helped ease the pressure IV.8 On account of the tight liquidity conditions and the consequent measures taken by the Reserve Bank, i.e., reduction and temporary reprieve in SLR maintenance, the excess SLR investments of SCBs moderated to `1,77,694 crore as on December 31, 2010 from `2,56,566 crore a year ago. After the reduction in SLR, banks could use the additional space for accessing liquidity through OMOs and the repo window. Excess SLR holdings for the system as a whole are much lower than last year, with large divergence across banks (Chart IV.5).
Liquidity tightness could ease further with increase in government spending IV.9 Alongside the build up of government surplus with the Reserve Bank that drained liquidity from the system, the injection of liquidity under the LAF scaled up significantly (Table IV.4). The surplus peaked in December 2010 reflecting advance tax collections. The salutary effect of higher government spending since end-December 2010 is mirrored in the lower surplus balances and the corresponding decline in LAF volumes. The gradual easing of liquidity conditions is also reflective of the staggered OMOs carried out by the Reserve Bank since the mid-quarter Review of December 2010. It is expected that the government would spend in order to meet its committed expenditure for the year during the ongoing quarter, which is the last quarter of the financial year. With government cash surplus beginning to flow back into the system, the liquidity position would improve.
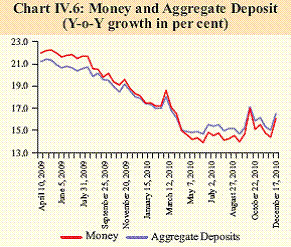
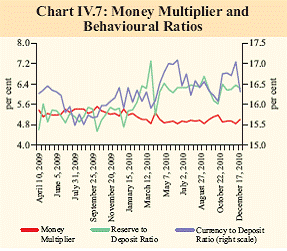
Money supply growth deceleration continued reflecting the deposit pattern, but reached closer to the indicative trajectory of the Reserve Bank IV.10 At the end of the third quarter of 2010- 11, money growth remained below the Reserve Bank’s indicative trajectory as set out in the Second Quarter Review of Monetary Policy (Table IV.5). Broad money (M3) growth trend is largely influenced by the pattern of growth in aggregate deposits of the banking system, which account for over 85 per cent of the stock of M3 (Chart IV.6). There has been a sharp moderation in both time (which are nearly 87 per cent of total deposits) and demand deposits, partly reflecting the response to lower deposit rates in an environment of high inflation. There was, however, a sharp turnaround in the last fortnight of the quarter when banks mobilised almost 66 per cent of the total incremental deposits for the entire quarter. This reflected active mobilisation as well as quarter-end/ month-end accruals of interest payments and salaries/pensions credited to accounts1. Besides, there were two fortnights during the third quarter of 2010-11, during which deposit growth, and hence, money growth, registered notable increase. This was on account of inflows for subscription to Coal India and Power Grid capital issues in the second fortnights of October and November 2010, respectively. IV.11 The moderation in the growth rate of money is also on account of the change in the key determinants of the money multiplier. During the current year, currency growth has been much higher than deposit growth, which led to a higher currency to deposit ratio. The reserve to deposit ratio has also gone up on account of the increase in the CRR that was effected in February and April 2010. The increase in both these ratios has had some moderating influence on the money multiplier, thereby lowering M3 growth (Chart IV.7). Higher incremental deposits in the last fortnight of 2010, however, led to a significant moderation in the currency to deposit ratio.
IV.12 Among the major sources of M3 growth, the banking system’s credit to the commercial sector has steadily gone up since November 2009, reflecting the growth momentum and the associated demand for credit, while the growth in banking system’s credit to the government has decelerated.
Base money expansion remains strong reflecting injection of primary liquidity by the Reserve Bank IV.13 Reserve money continued to grow at an accelerated pace during the third quarter of 2010-11, reflecting the injection of primary liquidity in the face of tight liquidity conditions. The third quarter registered the highest quarterly increment in base money during the current financial year. The injection of primary liquidity during the third quarter in the form of repo operations under the LAF and open market purchases was `1,32,902 crore, roughly 60 per cent of which was offset by the incremental build-up in government surplus with the Reserve Bank.
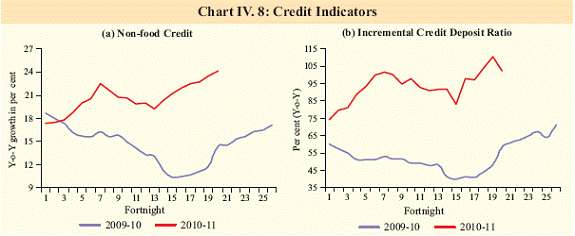
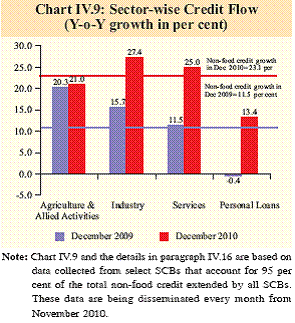
Credit growth, though still dominated by infrastructure, is gradually getting broadbased IV.14 With economic growth consolidating around the pre-crisis trend, non-food credit continued to grow at an accelerated pace during the third quarter of the year. Also, with deposit mobilisation lagging behind the fast pace of increase in credit, the incremental non-food credit to deposit ratio peaked at 110.5 per cent in mid-December 2010, an indication of the role of the structural squeeze on liquidity during the quarter. The ratio, however, dipped by over 8 percentage points by end-December 2010 (Chart IV.8). IV.15 The increased credit off-take was seen across all bank groups (Table IV.6). Even as private sector banks and foreign banks registered high growth in credit flow as compared to the previous year, public sector banks remained the dominant lenders in the banking system, accounting for nearly three-fourths of the incremental year-on-year credit off-take at the end of the third quarter of 2010-11. IV.16 Data on sectoral deployment of gross nonfood credit show the increasing broad-based pattern (Chart IV.9). Disaggregated data suggest that credit flow to industry has been robust. Infrastructure, basic metal and metal products and engineering industries accounted for twothird of the annual incremental credit off-take as on December 17, 2010. IV.17 Due to the buoyancy in credit flow from the banking system, banks accounted for nearly three-fifth of total incremental financing to the commercial sector during April- December 2010 (Table IV.7). For the period under consideration, funding from non-bank sources registered a decline compared to the previous year, on account of a decline in both domestic and foreign non-bank sources. The funding from foreign sources decreased on account of lower amount of net FDI inflow into India as well as lower subscription to ADRs/ GDRs.
Stronger monetary policy transmission is expected to enhance the effectiveness of policy IV.18 The anti-inflationary monetary policy measures taken during the course of the year could become more effective with the stronger transmission in the financial system that has become visible since the third quarter of the financial year. The tight liquidity conditions would improve as the government steps up its expenditure, but the magnitude of the deficit may have to continue at around 1.0 per cent of NDTL for monetary transmission to remain effective. 1Reporting fortnight for data compilation coincided with the last day of the month and the quarter, i.e., December 31, 2010. Hence, interest payments and accruals to salary/pension accounts contributed partly to the higher incremental deposits. |
|||||||||||||||||||||||||||||||||||||||||||||||||||||||||||||||||||||||||||||||||||||||||||||||||||||||||||||||||||||||||||||||||||||||||||||||||||||||||||||||||||||||||||||||||||||||||||||||||||||||||||||||||||||||||||||||||||||||||||||||||||||||||||||||||||||||||||||||||||||||||||||||||||||||||||||||||||||||||||||||||||||||||||||||||||||||||||||||||||||||||||||||||||||||||||||||||||||||||||||||||||||||||||||||||||||||||||||||||||||||||||||||||||||||||||||||||||||||||||||||||||||||||||||||||||||||||||||||||||||||||||||||||||||||||||||||||||||||||||||||||||||||||

ಈ ಪುಟವನ್ನು ಹಂಚಿಕೊಳ್ಳಿ:


ಭಾರತೀಯ ರಿಸರ್ವ್ ಬ್ಯಾಂಕ್ ಮೊಬೈಲ್ ಅಪ್ಲಿಕೇಶನ್ ಅನ್ನು ಇನ್ಸ್ಟಾಲ್ ಮಾಡಿ ಮತ್ತು ಇತ್ತೀಚಿನ ಸುದ್ದಿಗಳಿಗೆ ತ್ವರಿತ ಅಕ್ಸೆಸ್ ಪಡೆಯಿರಿ!
ನಮ್ಮ ಅಪ್ಲಿಕೇಶನ್ ಅನ್ನು ಸ್ಥಾಪಿಸಲು QR ಕೋಡ್ ಅನ್ನು ಸ್ಕ್ಯಾನ್ ಮಾಡಿ


ಪೇಜ್ ಕೊನೆಯದಾಗಿ ಅಪ್ಡೇಟ್ ಆದ ದಿನಾಂಕ:


