 IST,
IST,


IV. Monetary Policy In An Open Economy (Part 1 of 3)
4.1 The 1990s have witnessed growing integration of goods and financial markets across the globe. With growth in global trade in goods and services outpacing growth in world output, the share of external trade in output has increased further. Opening up of the services to international trade and remittances flows have accelerated the integration process. The opening up of the economy has implications for the conduct of monetary policy as well as the monetary transmission mechanism. In particular, it has rendered economies vulnerable to external demand and exchange rate shocks. This, in turn, has enhanced the possibility of significant changes in trade and other current account flows in a short span of time. This was reflected in the aftermath of the Asian financial crisis when a number of economies in this region had to make substantial adjustments in their current accounts.
4.2 A more serious challenge to conduct of monetary policy emerges from the capital account. A distinctive feature of capital flows is the greater volatility vis-à-vis the trade flows. Capital flows in gross terms are much higher than those in net terms. Global capital flows impact the conduct of monetary policy on a daily basis, imparting volatility to monetary conditions. Along with the explosion in financial innovations and the information technology revolution, this has led to the swift transmission of market impulses across countries and a structural change in the process of financial intermediation. All this has fundamentally altered not only the environment of monetary policy formulation but also its instrumentality and operating framework. Monetary policy formulation has become much more interdependent than before across economies and has to factor in the developments in the global economic situation, the international inflationary situation, interest rates, exchange rate movements and capital flows (Mohan, 2004a). A stylised fact in regard to many, if not most, emerging market economies (EMEs) is that their external borrowings are usually denominated in foreign currency. Large devaluations not only lead to inflation but can also cause serious currency mismatches with adverse impact on balance sheets of borrowers (banks as well as corporates). A financial accelerator mechanism can exacerbate these effects and threaten financial stability. Accordingly, with the opening up of the economies and greater integration,monetary authorities are no longer concerned with mere price stability. Financial stability has emerged as a key objective of monetary policy.
4.3 A more recent challenge in monetary management in EMEs has emanated from a significant increase in capital flows coupled with current account surpluses which have led to large overall balance of payments surpluses in these economies. In their efforts to maintain external competitiveness and financial stability, the central banks in EMEs have absorbed the market surpluses. Consequently, the foreign exchange reserves of the EMEs have nearly doubled in the last seven years. The share of reserves held by EMEs in global reserves has increased from 36 per cent in 1990 to 61 per cent in 2003, with Asian EMEs accounting for much of the increase. The absorption of excess supplies by the central banks has, however, implications for monetary expansion and the objective of price stability. The central banks, therefore, face a trade-off: by preventing nominal appreciation, they may ultimately endanger their primary objective of price stability. Typically, central banks attempt to overcome the policy dilemma by undertaking a variety of operations such as open market sales of government/own bonds to neutralise the expansionary monetary effect arising out of their market purchases. Such sterilisation operations, in turn, have their own limitations and involve costs, especially if external flows are persistent. Globalisation, thus, transforms the environment in which monetary policy operates, throwing up a number of challenges. The foremost challenge is the progressive loss of discretion in the conduct of monetary policy.
4.4 Like other EMEs, India too has witnessed a progressive opening up of the economy. External sector reforms were a key aspect of the structural reforms initiated in the early 1990s. While current account convertibility was achieved in 1994, the Indian approach towards capital account liberalisation has been one of caution. Trade openness of the economy has increased significantly. There has been a sustained increase in capital flows and the balance of payments has recorded large surpluses. Since 1993-94, balance of payments developments have thus come to play a dominant role in the conduct of monetary policy. Net capital inflows to India have been largely stable, reflecting a prudent approach to capital account liberalisation with a focus on attracting stable capital flows. Nonetheless, there have been brief episodes of volatility in capital flows and these periods have been associated with volatility in the foreign exchange market. Overall, however, the past decade has seen a significant increase in capital flows and the balance of payments has posted surpluses. External developments have thus been a key driver of money supply. A number of steps were taken to manage the surplus conditions as well as periods of volatility in order to retain discretion over the conduct of monetary policy so as to ensure domestic macroeconomic and financial stability.
4.5 Against this background, Section I of this Chapter discusses implications of globalisation on conduct of monetary policy. It undertakes a critical assessment of recent trends in capital flows to developing economies and examines factors that have led emerging economies in the recent years to become net exporters of capital to the mature economies. Impact of increased integration on business cycle synchronisation and implications of global macroeconomic imbalances are addressed. The Section also discusses constraints imposed by surges in capital flows on monetary management and the policy options, drawing upon cross-country experiences. Section II assesses the Indian experience of monetary management in an open economy context. It presents a brief overview of the developments in India’s balance of payments to place in context the challenges to monetary policy emanating from an open capital account. Policy responses to manage capital flows during times of volatility as well as times of persistent surpluses are highlighted. As sterilisation through open market sales has been a key instrument, an empirical exercise is undertaken to examine dynamics of the adjustment of monetary base and exchange rate in response to exogenous shocks to net foreign assets. The Section also undertakes a discussion of the efficacy of monetary measures in ensuring orderly conditions in the foreign exchange market. Finally, an attempt is made to measure synchronicity of business cycles in India with its trading partners to examine temporal changes in co-movement. Concluding observations are in Section III.
I. GLOBALISATION AND MONETARY POLICY
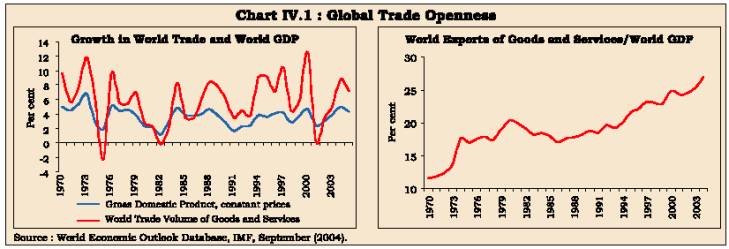
4.6 The 1990s have been marked by a further pickup in domestic as well as external liberalisation in a number of EMEs. Expansion in volume of world trade has continued to exceed the growth in world output. Even as world output growth decelerated from 3.3 per cent during the 1980s to 3.1 per cent during the 1990s, growth in volume of world trade in goods and services accelerated from 4.5 per cent to 6.4 per cent over the same period. Thus, between 1980 and 2003, while world output has doubled, world trade has trebled. Global trade openness has increased substantially. After showing some stagnation during the 1980s, trade openness - measured as the ratio of global exports of goods and services to world output - jumped from 19 per cent in 1990 to 25 per cent in 2003 (Chart IV.1). Apart from continuing trade liberalisation during the 1990s, the higher order of expansion in international trade can be attributed to three factors: (i) falling costs of trade; (ii) productivity growth in tradable goods sector; and, (iii) increasing income per head. As a country’s income rises, consumer spending shifts away from basic food and clothing towards manufacturing goods which offers scope for product differentiation, diversification and international trade. Quantitative analysis suggests that the fall in relative prices of tradable goods (relative to non-tradables) and the fall in tariffs are the key explanatory factors leading to increased trade. For a sample of 10 developed economies, these two factors alone explain nearly 65 per cent of the increase in the ratio of imports to total final expenditure (Dean and Sebastia-Barriel, 2004). While increased trade
4.7 While trade flows continue to be an important source of global transmission of shocks, a fundamental change that has taken place in recent years is the movements in capital flows. In the aftermath of the World War II, efforts to liberalise international trade in goods made significant progress from multilateral negotiations through various rounds of discussions under the General Agreement on Tariffs and Trade and subsequently, under the World Trade Organisation. Liberalisation of trade in services has, in particular, received a focus in the recent decades. In contrast the post-War period till the early 1970s was largely characterised by capital controls. This was, in turn, the outcome of the fixed but adjustable exchange rate systems under the Bretton Woods system. With the collapse of this system in the early 1970s, flexible exchange rates permitted countries to start liberalising their capital accounts. Initially, advanced economies opened up their capital accounts and in the 1990s, a number of emerging economies opened up their capital accounts. At the same time, it may be noted that while trade liberalisation is generally viewed to be welfare improving, a similar unanimity does not prevail in the case of capital account liberalisation.
4.8 Reflecting this progressive opening up of capital accounts, capital flows to EMEs increased significantly during the 1990s. As a consequence, it is capital flows that now influence exchange rate movements significantly as against trade deficits and economic growth, which were important in the earlier days. The latter do matter, but only over a period of time. Capital flows, on the other hand, have become the primary determinants of exchange rate movements on a day-today basis. Second, unlike trade flows, capital flows in 'gross' terms which affect the exchange rate can be several times higher than 'net' flows on any day. These are also much more sensitive to what everybody else is saying or doing than is the case with foreign trade or economic growth. Therefore, herding becomes unavoidable (Jalan, 2003). Thus, the analysis of capital flows and their behaviour - the volatility on account of the boom-bust pattern - becomes important for the conduct of monetary policy.
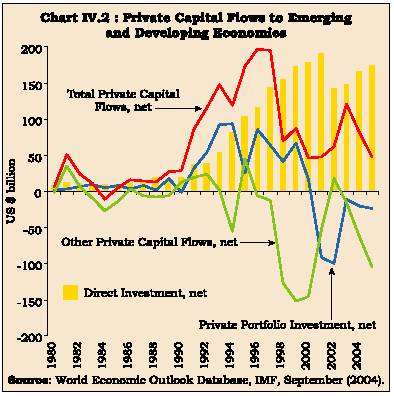
4.9 The nature of capital flows to EMEs has undergone significant shifts in the post-World War II period. In the period till the 1980s, capital flows were mainly in the form of aid flows and these were relatively stable. With external and financial liberalisation, net capital flows to developing economies have increased rapidly. This step-up was entirely on account of private capital flows, which increased from fairly low levels - about US $ 15 billion per annum - during the 1980s to a peak of almost US $ 166 billion by mid-1990s before dipping sharply in the aftermath of the East Asian crisis and a recovery in the subsequent period (Chart IV.2). As the Chart shows, the defining characteristic of private capital flows is their volatility. Monetary authorities thus need to understand the nature of these capital flows so as to make a distinction between enduring and volatile components of capital flows. Within private capital flows, direct investment inflows are relatively stable while portfolio and debt flows are highly volatile. Even with the sharp reversals, net private capital flows averaged US $ 122 billion per annum during the 1990s, eight times of that recorded during the 1980s.
4.10 Official flows on the other hand, at US $ 23 billion per annum during the 1990s were lower than that of US $ 26 billion per annum during the 1980s. Official flows were thus a fifth of private capital flows during the 1990s. Total capital flows to EMEs, therefore, moved in tandem with trends in private capital flows (Chart IV.3). While recent trends in private capital flows suggest an increase in financial integration, other indicators suggest that global financial markets are still not highly integrated (Parry, 1998). Correlation of national savings and national investment – the Feldstein-Horioka puzzle – remains very high, despite the significant opening up of global
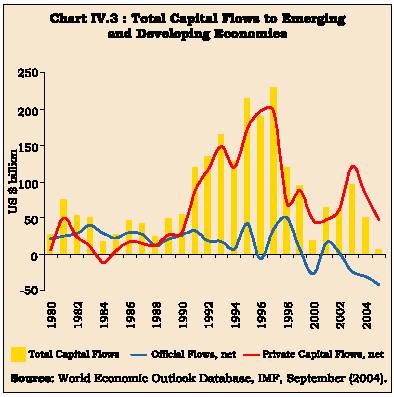
markets. However, it needs to be stressed that absorption of capital flows has to be matched by an equivalent current account deficit. This deficit cannot be too high on a sustained basis and if it is so, it has to be turned into a surplus later on. In this backdrop, high correlation between savings-investment is surely not a puzzle. Another piece of evidence that international markets are not highly integrated emerges from the substantial ‘home bias’ in the composition of investment portfolios. The proportion of foreign investments in total investments is less than 10 per cent in the case of the US and only 15 per cent in the case of Germany. Thus, capital flows to EMEs may rise further if domestic savings-investment correlation weakens over time or if residents increase the holdings of foreign assets in their portfolios.
4.11 Another factor that can lead to a sustained rise in capital flows to emerging economies emanates from the evolving pattern of demographics and this could exacerbate the challenges to monetary policy formulation over the longer term (Mohan, 2004a). In general, economies pass through three stages of demographic transition: (i) high youth dependency (large proportion of population in the 0-14 years group), (ii) rise in working age population (15-59 years) relative to youth dependency, and (iii) rise in elderly dependency (60+ years) relative to working age population. The second stage is regarded as the most productive from the point of view of secular growth since it is associated with the high rates of saving and work force growth relative to the other stages.
4.12 According to estimates made by IMF (2004), both savings and investment rates increase with an increase in the share of working age population. More importantly, the increase in the savings rate outpaces the increase in the investment rate and this increases the current account balance. An increase in the share of elderly population, on the other hand, has the reverse effect - both savings and investment rates decline, and the current account balance deteriorates as the decline in savings exceeds that in investment (Table 4.1). These results confirm that demographic factors have a significant influence on current account balances through their effect on savings and investment.
4.13 Over the next half-century, the population of the world will age faster than during the past half-century as fertility rates decline and life expectancy rises. Developed regions like Europe, North America and Japan have been leading the process of population ageing and are likely to be deep into the third stage of demographic transition. Illustratively, according to estimates of IMF (2004), Japan’s current account balance will deteriorate by around 2.5 per cent of its GDP between 2000 and 2050. These regions will switch to importing capital. On the other hand, high performers of East Asia and China are in the second stage of the demographic cycle. East Asia could increasingly become an important supplier of global savings up to 2025; however, rapid population ageing thereafter would reinforce rather than mitigate the inexorable decline of global saving. Increasingly, it would be the moderate and the low performers among the developing countries which would emerge as exporters of international capital. India is entering the second stage of demographic transition and over the next half-century, a significant increase in both saving rates and share of working age population is expected. The regional pattern of global population ageing is, thus, expected to get reflected in the magnitude and direction of international capital flows
|
Table 4.1: Macroeconomic Impact ofDemographic Changes |
|||
|
Item |
Savings/ |
Investment/ |
Current Account/ |
|
GDP |
GDP |
GDP |
|
|
1 |
2 |
3 |
4 |
|
Impact of : |
|||
|
Share of |
|||
|
Working Age |
|||
|
Population |
0.72 |
0.31 |
0.05 |
|
Share of |
|||
|
Elderly |
|||
|
Population |
-0.35 |
-0.14 |
-0.25 |
|
Note : Results
are based on panel instrumental variable regressions for a sample of 115
countries. |
|||
with implications for the conduct of monetary policy. While current global imbalances are more due to the US macroeconomic imbalances, the pattern of capital flows that may emerge from demographic transition is likely to be of a more enduring nature.
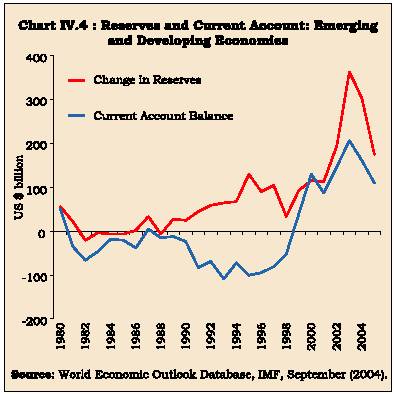
4.14 The behaviour of the capital flows during the 1990s reveals that these flows can increase rapidly but can be highly volatile. Surges in capital flows and the associated volatility have implications for the conduct of monetary, exchange rate and foreign exchange reserve policies. Emerging market economies, thus, need to be equipped to deal with such volatility in order to ensure monetary and financial stability. A striking feature of the last 3-4 years is the two-way movement of capital between EMEs and mature economies. Notwithstanding the recovery in capital flows, emerging market economies, as a group, have become net exporters of capital to the mature economies since 2000. Three key factors explain the recent movement in capital flows (IMF, 2004). First, EMEs have recorded current account surpluses. As against a deficit of US $ 65 billion per annum during the 1990s, the emerging economies recorded a surplus of US $ 149 billion during 2000-03 (Chart IV.4). The emergence of surpluses reflected the adjustment process in response to the financial crisis in Asia and elsewhere. Countries that experienced crisis had to reduce domestic absorption and increase exports to generate a trade surplus. This process is quite visible in the East Asian countries which have seen a sharp turnaround in their current accounts – as high as 17.8 percentage points of GDP in case of Malaysia and 14.5 percentage points of GDP in case of Thailand (Table 4.2).
|
Table 4.2: Current Account Balances in Select Economies |
||
|
(Per cent to GDP) |
||
|
Country |
1991-1996 |
1998-2003 |
|
1 |
2 |
3 |
|
China |
0.9 |
2.4 |
|
India |
-1.1 |
-0.1 |
|
Indonesia |
-1.3 |
0.5 |
|
Korea |
-2.3 |
3.1 |
|
Malaysia |
-6.4 |
11.4 |
|
Philippines |
-3.8 |
4.6 |
|
Thailand |
-6.4 |
8.1 |
|
Mexico |
-4.2 |
-2.8 |
|
Source : International Economic Trends, Federal Reserve Bank of St. Louis, July (2004). |
||
4.15 Countries affected by the crisis were also forced ‘external deleveraging’, i.e., a reduction in their external liabilities which also explains the pattern of capital outflows since 2001. This process which started in 1997 is still ongoing in some countries. Although non-crisis countries also exhibited some adjustment, the burden was mainly borne out by the crisis countries. The crisis-countries witnessed an average outflow of US $ 48.5 billion per annum during 2000-03 as compared with an average annual outflow of US $ 45.8 billion by non-crisis countries. The order of correction is better gauged when outflows are scaled by GDP; the outflows in the former group of countries at 2.8 per cent of their GDP were more than three-times of that recorded by non-crisis countries (0.9 per cent of GDP) (Table 4.3).
4.16 Second, global imbalances - large US current account deficit - also explain the reverse capital movements from EMEs. Third, the movements in capital flows reflect the accumulation of reserves to maintain a competitive exchange rate as well as self-insurance. Reflecting all these factors, foreign exchange reserves of the developing countries increased by US $ 1256 billion between December 1996 and June 2004 (Table 4.4). Concomitantly, net foreign assets have emerged as a key driver of reserve money (Table 4.5).
4.17 The need for reserves as self-insurance emanates from the volatile nature of the capital flows. It also reflects weakness in the existing international financial architecture (Reddy, 2003). Capital inflows can reverse quickly, leaving the country exposed to a liquidity crisis. In this context, the distinction between push and pull factors becomes important. While ‘push’ factors attribute capital flows to conditions in creditor countries, the ‘pull’ factors refer to conditions in debtor (recipient) countries. The former help explain the timing and
|
Table 4.3: Net Capital Flows to Emerging Markets |
||||||||
|
(US $ billion) |
||||||||
|
Item |
1996 |
1997 |
1998 |
1999 |
2000 |
2001 |
2002 |
2003 |
|
1 |
2 |
3 |
4 |
5 |
6 |
7 |
8 |
9 |
|
All EMEs |
||||||||
|
Net Inflows |
74.4 |
47.3 |
104.2 |
5.2 |
-99.1 |
-49.9 |
-90.5 |
-137.7 |
|
(1.3) |
(0.8) |
(1.7) |
(0.1) |
(-1.6) |
(-0.8) |
(-1.4) |
(-1.9) |
|
|
Net Non-resident Inflows |
274.9 |
334.9 |
255.7 |
211.8 |
192.8 |
132.9 |
150.0 |
243.4 |
|
Net Resident Inflows |
-200.5 |
-287.6 |
-151.5 |
-206.6 |
-291.9 |
-182.9 |
-240.5 |
-381.1 |
|
Crisis Countries |
||||||||
|
Net Inflows |
53.6 |
64.8 |
18.7 |
-21.6 |
-33.9 |
-30.4 |
-57.6 |
-72.0 |
|
(2.4) |
(2.9) |
(1.0) |
(-1.3) |
(-1.9) |
(-1.8) |
(-3.7) |
(-3.9) |
|
|
Net Non-resident Inflows |
138.8 |
128.9 |
76.2 |
50.8 |
48.6 |
-6.3 |
13.7 |
35.8 |
|
Net Resident Inflows |
-85.2 |
-64.1 |
-57.5 |
-72.4 |
-82.5 |
-24.1 |
-71.4 |
-107.8 |
|
Non-crisis Countries |
||||||||
|
Net Inflows |
20.9 |
-17.5 |
85.5 |
26.8 |
-65.2 |
-19.5 |
-32.8 |
-65.8 |
|
(0.6) |
(-0.4) |
(2.1) |
(0.6) |
(-1.4) |
(-0.4) |
(-0.7) |
(-1.2) |
|
|
Net Non-resident Inflows |
136.2 |
206.0 |
179.5 |
161.0 |
144.2 |
139.3 |
136.3 |
207.6 |
|
Net Resident Inflows |
-115.3 |
-223.5 |
-93.9 |
-134.2 |
-209.4 |
-158.8 |
-169.1 |
-273.4 |
|
Note : 1.
Crisis countries include Argentina, Brazil, Indonesia, Malaysia, Philippines,
Russia, Thailand and Turkey. |
||||||||
magnitude of new capital inflows and the latter explain the geographic distribution of capital inflows. According to Calvo, Leiderman and Reinhart (1994), low US interest rates - hence, push factors - were dominant in explaining capital flows to Latin America in the early 1990s. Similarly, in the most recent episode of capital flows to the EMEs since early 2000, push factors appear to be playing a key role. According to estimates by Ferruci, Herzberg, Soussa and Taylor (2004), almost two-thirds of the compression
|
Table 4.4: Total Reserves Minus Gold |
||||
|
(US $ billion) |
||||
|
Area/Country |
Dec- |
Dec- |
June- |
Variation @ |
|
1996 |
2003 |
2004 |
||
|
1 |
2 |
3 |
4 |
5 |
|
All Countries |
1647 |
3156 |
3463 |
1816 |
|
Industrial Countries |
789 |
1219 |
1349 |
560 |
|
Japan |
217 |
663 |
808 |
591 |
|
Europe |
89 |
252 |
272 |
183 |
|
United States |
64 |
75 |
72 |
8 |
|
Developing Countries |
858 |
1938 |
2114 |
1256 |
|
Asia |
495 |
1248 |
1385 |
890 |
|
China,P.R.: Mainland |
107 |
408 |
475 |
368 |
|
Taiwan Prov.of China |
88 |
207 |
230 |
142 |
|
Korea |
34 |
155 |
167 |
133 |
|
China,P.R.:Hong Kong |
64 |
118 |
121 |
57 |
|
India |
20 |
99 |
115 |
95 |
|
Singapore |
77 |
96 |
102 |
25 |
|
Russia |
11 |
73 |
84 |
73 |
|
Mexico |
19 |
59 |
60 |
41 |
|
Brazil |
58 |
49 |
50 |
-8 |
|
Malaysia |
27 |
45 |
54 |
27 |
|
Note:
@ Variation between June 2004 and December 1996. |
||||
in bond spreads between October 2002 and early 2004 can be attributed to push factors alone - in particular, the fall in the US short-term interest rates since 2001. This implies a need for caution by EMEs in borrowing too heavily during times of benign external financing environment, as a reversal in credit conditions is more often than not beyond the control of the borrower. Therefore, it would be more apposite if central banks attempt to hold these volatile flows into their reserves. The precautionary demand for reserves has increased, especially in the period after the Asian financial crisis. Aizenman, Lee and Rhee (2004) found that trade openness - the conventional explanatory variable - is no longer a significant factor in explaining international reserves after the crisis. In contrast, financial openness indicators and volatility of export receipts appear to be a significant factor in explaining the reserve accretion (Table 4.6). Precautionary demand for reserves by EMEs apparently outweighs the costs associated with reserve build-up. The overall experience is that capital flows are characteristically volatile, both in terms of longer term waves and even more so in the short term. The longer term waves influence monetary policy thinking during each era, whereas the short term volatility has to be mitigated through day to day monetary policy operations. Monetary authorities, therefore, need to decide as to whether capital flows are durable or reversible. In case, flows are perceived to be reversible, authorities need to be prepared through building up foreign exchange reserves.
|
Table 4.5: Ratio of Net Foreign Assets to Reserve Money |
||||||
|
(Per cent) |
||||||
|
Country |
1990 |
1996 |
2000 |
2001 |
2002 |
2003 |
|
1 |
2 |
3 |
4 |
5 |
6 |
7 |
|
Australia |
127.9 |
56.1 |
124.7 |
116.8 |
115.8 |
138.4 |
|
Brazil |
81.7 |
140.7 |
113.7 |
103.0 |
68.1 |
80.8 |
|
Chile |
652.4 |
537.4 |
450.8 |
453.6 |
490.5 |
447.9 |
|
Colombia |
131.3 |
140.3 |
189.2 |
205.5 |
220.4 |
189.9 |
|
Mexico |
99.5 |
140.1 |
130.7 |
127.0 |
128.8 |
138.0 |
|
China,P.R.: Mainland |
12.8 |
35.6 |
41.1 |
47.6 |
49.5 |
56.4 |
|
India |
11.9 |
44.5 |
65.8 |
74.0 |
98.3 |
117.9 |
|
Indonesia |
143.0 |
164.3 |
188.0 |
168.0 |
163.3 |
154.6 |
|
Korea |
78.3 |
109.5 |
430.5 |
434.4 |
409.0 |
476.2 |
|
Malaysia |
149.0 |
109.6 |
273.7 |
292.1 |
307.9 |
373.6 |
|
Pakistan |
13.2 |
19.3 |
25.2 |
42.5 |
79.9 |
90.6 |
|
Philippines |
40.3 |
91.3 |
189.8 |
228.7 |
210.5 |
209.5 |
|
Singapore |
438.9 |
592.4 |
753.9 |
698.6 |
714.9 |
790.2 |
|
Thailand |
194.1 |
215.5 |
206.4 |
203.3 |
227.7 |
179.4 |
|
Czech Republic |
… |
108.3 |
103.2 |
104.0 |
276.8 |
247.5 |
|
Hungary |
1141.7 |
243.9 |
225.5 |
213.5 |
149.8 |
156.1 |
|
Poland |
55.3 |
153.2 |
234.0 |
166.7 |
184.9 |
193.3 |
|
Russia |
… |
62.4 |
113.8 |
122.1 |
127.9 |
122.8 |
|
… : Not Available |
||||||
|
Source : International Financial Statistics (CD-ROM), IMF. |
||||||
4.18 As the preceding analysis shows, monetary authorities are required to take cognisance of external developments on their domestic economy. In this context,one issue is: whether ex ante coordination of monetary policies would be useful? Obstfeld and Rogoff (2002) argue that, even in a world with significant economic integration, the welfare gains from international coordination are likely to be quantitatively small in comparison to gains from domestic stabilisation policy. Their result is, however, contingent upon the premise that domestic monetary policy rules will improve over time and that international markets will become complete over time. Clarida, Gali and Gertler (2002), on the other hand, argue there may be benefits from coordination. An ex post empirical assessment of monetary policy for 14 OECD countries suggests that monetary policy interdependence has increased (Bergin and Jorda, 2004). There is some evidence of increased business cycle synchronisation, at least for advanced economies (Box IV.1).
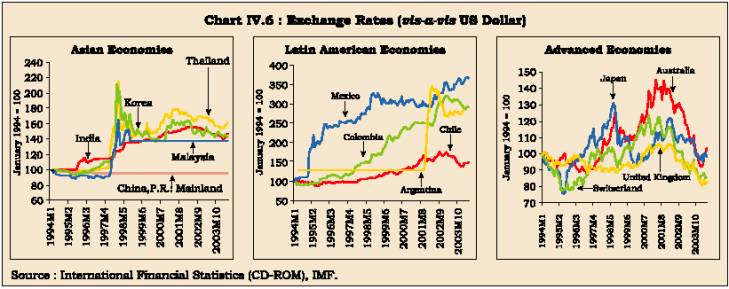
Exchange Rates
4.19 The experience of living with capital flows since the 1970s has fundamentally altered the context of monetary policy. In particular, there is a dramatic shift in the still unsettled debate on the determinants of the exchange rate and the choice of the appropriate exchange rate regime, although the weight of opinion is clearly in favour of a flexible regime. According to conventional wisdom, it was trade flows which were the key determinants of exchange rate movements. In more recent times, the importance of capital flows in determining the exchange rate movements has increased considerably, rendering some of the earlier guideposts of monetary policy formulation possibly anachronistic. On a day-to-day basis, it is capital flows which influence the exchange rate and interest rate arithmetic of the financial markets. Capital flows have
|
Table 4.6: Reserve Adequacy Indicators |
|||||||
|
(Per cent) |
|||||||
|
Country |
Outstanding Reserves |
Ratio of Foreign Exchange Reserves to |
Spreads *Reserves |
||||
|
(US $ Billion) |
to GDP |
||||||
|
2003 |
GDP |
Short-term Debt |
Bank Deposits |
||||
|
1 |
2 |
3 |
4 |
5 |
6 |
||
|
Brazil |
49.1 |
9.9 |
1.8 |
34.9 |
0.45 |
||
|
China |
408.2 |
28.9 |
14.2 |
… |
0.17 |
||
|
India |
98.9 |
17.2 |
6.4 |
31.1 |
… |
||
|
Indonesia |
36.2 |
17.4 |
1.5 |
34.4 |
… |
||
|
Korea |
155.3 |
25.7 |
3.4 |
34.7 |
0.19 |
||
|
Malaysia |
44.5 |
43.2 |
5.4 |
46.2 |
0.43 |
||
|
Mexico |
59.0 |
9.4 |
2.2 |
39.3 |
0.19 |
||
|
Philippines |
13.5 |
17.0 |
1.6 |
34.5 |
0.70 |
||
|
Russia |
73.2 |
16.9 |
3.1 |
77.4 |
0.43 |
||
|
Thailand |
42.1 |
29.5 |
2.1 |
32.0 |
0.20 |
||
|
... : Not Available |
|||||||
|
Note:Spreads
are EMBI Global spreads as of December 31. The last column, therefore,
provides |
|||||||
Box IV.1
Business Cycle Synchronisation
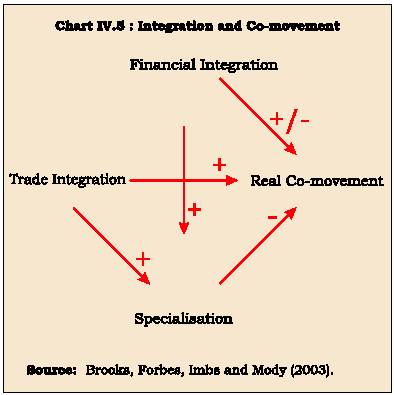
Forces of globalisation have led to substantial increases in international trade as well as financial flows during the 1990s. Private capital flows (net) to the EMEs during the 1990s were eight times of that during the 1980s while growth in trade has outpaced growth in output. An issue in this context is whether increased integration has led to a larger degree of synchronisation of business cycles across countries. A global shock - say, an increase in global oil prices - will affect all countries simultaneously. As regards country-specific shocks, a number of forces are at work - some tend to increase co-movement while others reduce co-movement (Brooks, Forbes, Imbs and Mody, 2003). For countries quite open to external trade, economic developments in their partner countries can get transmitted through exports and imports and this is expected to increase the co-movement of output across countries. Enhanced financial integration, on the other hand, allows countries to smoothen their consumption through borrowing and lending in international markets. This can weaken the output co-movement. Financial integration can, however, lead to an increase in output co-movement through demand-side effects. Illustratively, if investors from different countries have a significant fraction of their investments in a particular stock market, then large movements in that stock market can induce wealth effects across countries and hence output co-movement (Kose, et al., 2003). Furthermore, due to herd behaviour, capital flows move in similar patterns across countries which can also increase co-movement. Finally, trade as well as financial integration allows countries to specialise in industries in which they have a comparative advantage. This can result in more vulnerability to industry- or country-specific shocks but reduce cross-country output movements. A diversified structure of export destinations tends to weaken the co-movement of business cycles (Anderson, Kwark and Vahid, 1999). In view of various offsetting factors at work, the net impact of trade and financial integration on business cycles synchronisation remains uncertain in theory and, therefore, it becomes an empirical issue to gauge the net effect (Chart IV.5).
Baxter and Kouparitsas (2004) find that variables such as bilateral trade between countries, total trade in each country, sectoral structure, similarity in export and import baskets are significant determinants of business cycle co-movement when considered in isolation. Amongst these variables, however, only bilateral trade is a 'robust'1 determinant of co-movement. Greater similarity in industrial structure is not found to be 'robust', in contrast to findings of Imbs (2003).
As regards temporal trends in co-movement of output, most studies find evidence that synchronisation has increased in the case of advanced economies, reflecting faster cross-border transmission of shocks (Kose, et al., 2003; Bordo and Helbling, 2003). Some studies, however, suggest that synchronisation during the 1980s and the 1990s was broadly unchanged from that in the 1960s and the 1970s, mainly due to common international shocks themselves being smaller (Stock and Watson, 2003).
As regards emerging economies, evidence does not suggest any increase in output co-movements - rather, there appears to be a decline in output correlations (Kose, et al., 2003). Cross-country consumption correlations also showed no increase during the 1990s. The empirical evidence, therefore, suggests that developing countries were unable to gain from the benefits of international risk sharing. Business cycles synchronisation in the Asia-Pacific region is more by way of similar structural features such as technological know-how and manufacturing structure than by way of trading linkages (Crosby and Voss, 2002).
According to IMF (2001), although transmission channels have intensified due to globalisation, there is no global cycle. Country-specific shocks such as German unification and the bursting of the Japanese asset price bubble have interrupted integration trends. Lack of bilateral data complicates the analysis of transmission channels over time. Therefore, it is difficult to decide whether increased correlations were the result of tighter transmission channels or of more frequent common shocks. Cultural similarity and institutional factors such as accounting standards, legal systems, common language and receptiveness to new technologies have a relatively significant impact on growth correlations rather than the traditional transmission channels such as similarity of monetary policy, integration of long-term bond markets and common industry structure (Otto et al., 2001).
To conclude, the empirical evidence suggests that the co-movement between business cycles has increased in recent years. Thus, economic developments abroad now have a larger degree of influence on the domestic economy. Monetary authorities, consequently, need to devote more attention to global economic developments in framing their forecasts of inflation and output. Furthermore, the financial stability objective assumes greater importance due to threats of contagion and herding.
1 The authors define a variable to be 'robust' if it has a significant coefficient in a regression when all other potential explanatory variables are also included.
4.20 For more open economies, sharp movements in the exchange rate can have significant effects on domestic inflation as well as on domestic balance sheet in view of liability dollarisation. This raises the issue of appropriate monetary policy response to exchange rate movements. Three alternative views exist on this issue (Ho and McCauley, 2003). According to the first view - the strict constructionist view - monetary policy should respond to the exchange rate only to the extent that it affects inflation. The second view - flexible inflation targeter view - holds that exchange rate can also be a legitimate policy objective alongside inflation and output targets.
4.21 The third view - Singaporean view - believes that for a sufficiently open economy, stabilising inflation requires close management of the exchange rate. Managing the exchange rate, in this view, is not an objective by itself but a means to achieve the objective of low inflation. As EMEs are more exposed to the influence of the exchange rate, they may be required to accord a bigger role in policy assessment and decision-making. Although a real depreciation of the exchange rate may be helpful for external competitiveness and growth, it also increases the vulnerability from factors such as high exchange rate pass-through and liability dollarisation. There is, thus a 'fear of floating' (Calvo and Reinhar t, 2002) although there is some evidence that exchange rate pass-through to prices has generally tended to decline during the 1990s (see Chapter V). Empirical evidence suggests that not only EMEs but even industrial economies also keep an eye on the exchange rate and often intervene in the foreign exchange market. Out of a sample of 18 countries (emerging as well as industrial countries) studied by Ho and McCauley (op cit.), 12 countries intervened in the foreign exchange market, above and beyond the impact of exchange rate on inflation.
4.22 That even industrial economies are quite concerned with exchange rate is amply illustrated by the recent experience of New Zealand. According to the Reserve Bank of New Zealand (2004), 'the amplitude of the New Zealand exchange rate cycle has long been a concern. The exchange rate varies to a far greater extent than the underlying economic situation warrants. …Excess exchange rate variation makes engaging in business more difficult, reducing investment and thereby restricting the opportunities for New Zealand in growth. Excessive exchange rate variability can also make the Bank’s task of achieving and maintaining price stability more difficult, potentially leading to unnecessary output, inflation and interest rate variability. … As inflation has been brought down and stabilised around the world and as a result economies have become more stable overall, exchange rate cycles have not noticeably diminished'. Therefore, the Reserve Bank of New Zealand whose extant stance was to use foreign exchange reserves to 'intervene only if the foreign exchange market became disorderly' recommended, in March 2004, that as one of its monetary policy tools, 'it should have the capacity to intervene in the foreign exchange market to influence the level of the exchange rate'.
4.23 The above discussion suggests that monetary authorities cannot ignore movements in exchange rates, at least in EMEs. This raises the issue: whether monetary policy reaction functions such as Taylor-type rules should be augmented to include exchange rates. According to Ball (1998), the policy instrument for an open economy should be a monetary conditions index (MCI). MCI is a weighted average of the short-term interest rate and the exchange rate. The underlying assumption of the MCI is that higher interest rates and an appreciation of the exchange rate are qualitatively equivalent, i.e., for an open economy, if the exchange rate were to appreciate, the interest rates should be lowered and vice versa to keep output growth and inflation at their desired trajectory. The use of the MCI as an indicator of market conditions, however, may be misleading since it depends upon the nature of the shocks to the exchange rates (Mishkin, 2001). Illustratively, in the presence of cost-push shocks, the interest rate needs to increase - and, not decrease - in combination with exchange rate appreciation to stabilise inflation expectations (Detken and Gaspar, 2003). Notwithstanding this debate on the usefulness of MCI, exchange rate movements remain a source of concern to the policy authorities in emerging markets.
4.24 For the majority of developing countries which continue to depend on export performance as a key to the health of the balance of payments, exchange rate volatility has had significant real effects in terms of fluctuations in employment and output and the distribution of activity between tradables and non-tradables. In the fiercely competitive trading environment, where countries seek to expand market shares aggressively by paring down margins, even a small change in exchange rates can develop into significant and persistent real effects. The heightened exchange rate volatility of the era of capital flows has had adverse implications for all countries except the reserve currency economies. The latter have been experiencing exchange rate movements which are not in alignment with their macro imbalances and the danger of persisting currency misalignments looms large over all non-reserve currency economies (Mohan, 2004a).
Global Macroeconomic Imbalances
4.25 On the positive side, globalisation has contributed to sustained lowering of inflation as well as inflation expectations during the last two decades (see Chapter V). At the same time, globalisation appears to hold a threat for future inflation. One such threat emerges from the US twin deficits. Fiscal as well as current account deficits in the US, at present, are close to 5 per cent of GDP. This order of current account deficit being run by the US would probably not have been funded in the past as readily as it is today. It is the increased degree of financial globalisation that has permitted the financing of such a large order of US current account deficit. However, such a large deficit may not be sustainable and, at some point of time, the US current account deficit has to narrow. As observed by Obstfeld (2004), unusually large current account deficits 'should remain high on policymakers’ list of concerns, even for the richer and less-constrained countries. Extreme imbalances signal the need for large and perhaps abrupt real exchange rate changes in the future, changes that might have undesired political and financial consequences, given the incompleteness of domestic and international capital markets'. The threat to global inflation emerges from the adjustment dynamics that might accompany the reduction in the US current account deficit (Box IV.2). Depreciation of the US dollar would increase external demand and this would put upward pressure on aggregate demand and inflation. The concomitant monetary tightening in the US can have serious implications for the sustainability of growth not only in the US but in several developing countries. According to Ferguson (2004), however, the correction of the US current account deficit, if properly managed, need not lead to undue distress. 'To minimise the harmful effects, there is a need for a coordinated and cooperative approach. The current account deficit in the US is, to a large extent, a manifestation of its large saving-investment gap which widened to a high level of 5.3 per cent in 2003. The US, therefore, will have to try to curb household and government borrowings and strengthen national savings. The Euro area continues to depend largely on external demand. It, therefore, will need to pursue some structural reforms, especially in the labour policies, to boost domestic demand. Japan also needs to continue to take some concrete measures to strengthen its financial system and reduce huge fiscal imbalances' (Mohan, 2004b).

ಈ ಪುಟವನ್ನು ಹಂಚಿಕೊಳ್ಳಿ:


ಭಾರತೀಯ ರಿಸರ್ವ್ ಬ್ಯಾಂಕ್ ಮೊಬೈಲ್ ಅಪ್ಲಿಕೇಶನ್ ಅನ್ನು ಇನ್ಸ್ಟಾಲ್ ಮಾಡಿ ಮತ್ತು ಇತ್ತೀಚಿನ ಸುದ್ದಿಗಳಿಗೆ ತ್ವರಿತ ಅಕ್ಸೆಸ್ ಪಡೆಯಿರಿ!
ನಮ್ಮ ಅಪ್ಲಿಕೇಶನ್ ಅನ್ನು ಸ್ಥಾಪಿಸಲು QR ಕೋಡ್ ಅನ್ನು ಸ್ಕ್ಯಾನ್ ಮಾಡಿ


ಪೇಜ್ ಕೊನೆಯದಾಗಿ ಅಪ್ಡೇಟ್ ಆದ ದಿನಾಂಕ:


