Table
VI.17: Public Deposits held by NBFCs-D by Classification of NBFCs |
(Amount
in Rs. crore) | Classification | As
at end-March | Percentage
Variations | Number
of NBFCs | Public
Deposits | 2007 | 2008
P | 2007 | 2008
P | 2007-08 |
1 | 2 | 3 | 4 | 5 | 6 |
Asset Finance | 72 | 178 | 186 | 1,156 | 522.4 |
|
| | (8.9) | (56.7) |
| Equipment Leasing | 28 | 14 | 43 | 8 | -81.8 |
|
| | (2.1) | (0.4) |
| Hire Purchase | 240 | 78 | 1,683 | 533 | -68.3 |
|
| | (81.0) | (26.2) |
| Investment | 3 | 1 | 45 | 19 | -58.1 |
|
| | (2.2) | (0.9) |
| Loan | 29 | 62 | 117 | 321 | 174.3 |
|
| | (5.6) | (15.8) |
| MNBC | 1 | – | 2 | – | – |
|
| | (0.1) | (0.0) |
| Total | 373 | 333 | 2,077 | 2,038 | -1.9 |
– : Nil/Negligible. P
: Provisional. Note : 1) Figures in respect of 2007-08
include 'IFCI Ltd' and 'TFCI Ltd'. 2) Figures in parentheses are percentages
to respective totals. Source : Annual Returns. |
Table
VI.18: Range of Deposits held by NBFCs-D |
(Amount
in Rs. crore) | Deposit
Range | As
at end-March | No.
of NBFCs | Amount
of Deposit | 2007 | 2008
P | 2007 | 2008
P | 1 | 2 | 3 | 4 | 5 |
1. | Less
than Rs.0.5 crore | 226 | 205 | 31 | 27 |
|
| |
| (1.5) | (1.3) |
2. | More
than Rs.0.5 crore and up to Rs.2 crore | 92 | 80 | 86 | 76 |
|
| |
| (4.1) | (3.7) |
3. | More
than Rs.2 crore and up to Rs.10 crore | 36 | 35 | 161 | 174 |
|
| |
| (7.7) | (8.5) |
4. | More
than Rs.10 crore and up to Rs.20 crore | 7 | 4 | 93 | 61 |
|
| |
| (4.5) | (3.0) |
5. | More
than Rs.20 crore and up to Rs.50 crore | 5 | 1 | 177 | 29 |
|
| |
| (8.5) | (1.4) |
6. | Rs.50
crore and above | 7 | 8 | 1,529 | 1,671 |
|
| |
| (73.6) | (82.0) |
Total |
| 373 | 333 | 2,077 | 2,038 |
P : Provisional. Note
: 1) Figures in respect of 2007-08 include 'IFCI Ltd' and 'TFCI
Ltd'. 2) Figures in parentheses are percentages to respective totals.
Source: Annual Returns. | crore and up
to Rs.10 crore' and ‘Rs.50 crore and above’. Significantly, the share
of the deposit class ‘Rs.50 crore and above’ in total deposits was
82 per cent, while that of other deposit classes combined together was only about
18 per cent of total public deposits of the NBFC sector. Region-wise Composition
of Deposits held by NBFCs 6.56 Following the trend of the previous year,
deposits held by NBFCs across all the regions declined during 2007-08 (Table
VI.19). As in the previous year, the southern region accounted for the largest
share of
Table
VI.19: Public Deposits Held by NBFCs-D | Region-wise
| (Amount
in Rs.crore) | Region | As
at end-March | 2007 | 2008
P | Number | Amount | Number | Amount |
1 | 2 | 3 | 4 | 5 |
1. Central | 59 | 27 | 51 | 23 |
|
| (1.3) |
| (1.1) |
2. Eastern | 9 | 28 | 8 | 16 |
|
| (1.3) |
| (0.8) |
3. North-Eastern | 1 | 0 | 0 | 0 |
|
| (0.0) |
| (0.0) |
4. Northern | 196 | 289 | 181 | 285 |
|
| (13.9) |
| (14.0) |
5. Southern | 85 | 1,647 | 70 | 1,630 |
|
| (79.3) |
| (80.0) |
6. Western | 23 | 86 | 23 | 84 |
|
| (4.2) |
| (4.1) |
Total (1 to 6) | 373 | 2,077 | 333 | 2,038 |
Memo |
| |
| |
Metropolitan cities: |
| |
| |
1. Kolkata | 6 | 21 | 5 | 13 |
2. Chennai | 47 | 1,541 | 36 | 1,564 |
3. Mumbai | 10 | 78 | 10 | 76 |
4. New Delhi | 68 | 219 | 64 | 205 |
Total (1 to 4) | 131 | 1,859 | 115 | 1,857 |
P : Provisional.
Note : 1) Figures in respect of 2007-08 include 'IFCI Ltd'
and 'TFCI Ltd'. 2) Figures in parentheses are percentages to respective
totals. Source: Annual Returns. | deposits
(80 per cent), followed by the northern region (14 per cent) and the western region
(4.1 per cent). The presence of NBFCs in the north-eastern region continued to
be nil during the year. Among the metropolitan cities, Chennai continued to hold
the largest share of deposits, while New Delhi continued to account for the largest
number of NBFCs. Interest Rate on Public Deposits with NBFCs
6.57 The share of deposits contracted by NBFCs in the interest rates up to 10
per cent declined (from 88.5 per cent to 73.1 per cent), while those contracted
in the bracket ‘more than 10 per cent and up to 12 per cent’ witnessed
a sharp rise (from 9.7 per cent to 25.4 per cent), partly reflecting the hardening
of interest rates during the year (Table VI.20).
Table
VI.20: Distribution of Public Deposits of NBFCs-D According
to Rate of Interest | (Amount
in Rs.crore) | Deposit
Interest Rate Range | As
at end-March | 2007 | 2008
P | 1 | 2 | 3 |
Up to 10 per cent | 1,839 | 1,489 |
| (88.5) | (73.1) |
More than 10 per cent and up
to 12 per cent | 202 | 517 |
| (9.7) | (25.4) |
12 per cent and above | 36 | 32 |
| (1.7) | (1.5) |
Total | 2,077 | 2,038 |
P : Provisional.
Note : 1)Figures in respect of 2007-08 include ' IFCI Ltd'
and ' TFCI Ltd'. 2)Figures in parentheses are percentages to respective
totals. Source : Annual Returns. | Maturity
Pattern of Public Deposits 6.58 Deposits with the maturity period
of 'less than 1 year', 'more than 3 years and up to 5 years' and '5 years and
above' declined during the year. Deposits in the maturity bucket of ‘more
than 1 years and up to 2 years’ increased marginally, while deposits in
the maturity bucket of ‘ more than 2 years and up to 3 years’ increased
significantly at end-March 2008. As a result, their share in total deposits increased
(Table VI.21).
Table
VI.21: Maturity Pattern of Public Deposits | Held
by NBFCs-D | (Amount
in Rs.crore) | Maturity
Period | As
at end-March |
| 2007 | 2008
P | 1 | 2 | 3 |
1. Less than 1 year | 724 | 609 |
| (34.9) | (29.9) |
2. More than 1 and up to 2
years | 477 | 480 |
| (23.0) | (23.6) |
3. More than 2 and up to 3
years | 561 | 653 |
| (27.0) | (32.0) |
4. More than 3 and up to 5
years | 234 | 229 |
| (11.3) | (11.3) |
5. 5 years and above | 80 | 66 |
| (3.8) | (3.3) |
Total | 2,077 | 2,038 |
P : Provisional
Note:1)Figures in respect of 2007-08 include ' IFCI Ltd' and
' TFCI Ltd' 2)Figures in parentheses are percentages to respective totals.
Source : Annual Returns. | Borrowings
by NBFCs 6.59 The outstanding borrowings by NBFCs increased by
55.3 per cent during 2007-08 (Table VI.22). Borrowings by equipment
Table
VI.22: Borrowings by NBFCs-D -Group-wise | (Amount
in Rs.crore) | NBFC
Classification | As
at end-March | Percentage
Variations | Number
of NBFCs | Total
Borrowings |
| 2007 | 2008
P | 2007 | 2008
P | 2007-08 |
1 | 2 | 3 | 4 | 5 | 6 |
Asset Finance | 72 | 178 | 19,091 | 32,461 | 70.0 |
|
| | (58.8) | (64.4) |
| Equipment Leasing | 28 | 14 | 128 | 69 | -46.3 |
|
| | (0.4) | (0.1) |
| Hire Purchase | 240 | 78 | 10,683 | 3,516 | -67.1 |
|
| | (32.9) | (7.0) |
| Investment Company | 3 | 1 | 133 | 358 | 168.9 |
|
| | (0.4) | (0.7) |
| Loan Company | 29 | 62 | 2,417 | 13,980 | 478.3 |
|
| | (7.4) | (27.7) |
| MNBC | 1 | 0 | - | - | - |
Total | 373 | 333 | 32,452 | 50,384 | 55.3 |
P : Provisional
Note : 1) Figures in respect of 2007-08 include 'IFCI Ltd'
and 'TFCI Ltd' 2) Figures in parentheses are percentages to respective totals.
Source: Annual Returns. | leasing and
hire purchase companies declined, while those by loan companies, investment
companies and asset finance companies increased during the year partly reflecting
the reclassification of NBFCs. AFCs continued to hold the largest share
(64.4 per cent) of borrowings of all NBFCs, followed by loan companies (27.7 per
cent). 6.60 Borrowings by NBFCs from banks and financial institutions and
by way of bonds and debentures and ‘other sources’ (which include
miscellaneous factors including inter alia, money borrowed from other
companies, unsecured loans from directors/ promoters, commercial paper, borrowings
from mutual funds and any other type of funds which are not treated as public
deposits), increased sharply during 2007-08. This broadly reflected the
pattern of borrowings of asset finance companies (Table VI.23).
Significantly, the borrowing from Government, which was nil during 2006-07, increased
sharply to Rs.2,319 crore during 2007-08 largely due to inclusion of IFCI Ltd.
and TFCI Ltd. in this category.
Table
VI.23: Sources of Borrowings by NBFCs-D - Group wise |
(Amount
in Rs. crore) | NBFC
Classification | As
at end-March | Government | External
Sources @ | Banks
and Financial Institutions | Debentures | Others |
2007 | 2008
P | 2007 | 2008
P | 2007 | 2008
P | 2007 | 2008
P | 2007 | 2008
P | 1 | 2 | 3 | 4 | 5 | 6 | 7 | 8 | 9 | 10 | 11 |
Asset Finance |
| |
| |
| |
| |
| |
| 0 | 0 | 975 | 828 | 9,148 | 16,329 | 5,808 | 10,216 | 3159 | 5,088 |
|
| |
| (-15.2) |
| (78.5) |
| (75.9) |
| (61.1) |
Equipment Leasing |
| |
| |
| |
| |
| |
| 0 | 0 | 0 | 0 | 39 | 2 | 0 | 0 | 89 | 67 |
|
| |
| |
| (-95.5) |
| |
| (-24.7) |
Hire Purchase |
| |
| |
| |
| |
| |
| 0 | 0 | 225 | 0 | 4,295 | 501 | 1,950 | 3 | 4212 | 3,012 |
|
| |
| |
| (-88.3) |
| (-99.9) |
| (-28.5) |
Investment |
| |
| |
| |
| |
| |
| 0 | 72 | 0 | 0 | 0 | 82 | 7 | 0 | 126 | 204 |
|
| |
| |
| |
| |
| (62.3) |
Loan |
| |
| |
| |
| |
| |
| 0 | 2,247 | 1 | 627 | 1,442 | 1,848 | 901 | 1,690 | 74 | 7,568 |
|
| |
| |
| (28.2) |
| (87.6) |
| |
MNBC | 0 | 0 | 0 | 0 | 0 | 0 | 0 | 0 | 0 | 0 |
Total | 0 | 2,319 | 1,201 | 1,455 | 14,925 | 18,762 | 8,667 | 11,909 | 7,659 | 15,939 |
|
| |
| (21.1) |
| (25.7) |
| (37.4) |
| (108.1) |
P : Provisional. @ :
Comprises (i) foreign Government, (ii) foreign authority, and (iii) foreign citizen
or person. Note : 1. Figures in respect of 2007-08
include 'IFCI Ltd' and 'TFCI Ltd'. 2. Figures in parentheses are percentage
variations over the previous year. Source : Annual
Returns. | Assets of NBFCs 6.61
The sharp increase in assets of deposit-taking NBFCs was mainly on account of
increase in assets of asset finance companies and loan companies. Loans and advances
as well as investments of NBFCs also increased during the year (Table
VI.24). At end-March 2008, 64.1 percent of assets, 71.2 per cent of total
loans and advances and 34.5 per cent of investments by all NBFCs were held by
asset finance companies.
Table VI.24: Major Components
of Assets of NBFCs-D -Group -wise | (Amount
in Rs.crore) | Classification | As
at end-March | Assets | Advances | Investment |
2007 | 2008
P | 2007 | 2008
P | 2007 | 2008
P | 1 | 2 | 3 | 4 | 5 | 6 | 7 |
|
| |
| |
| | Asset
Finance | 24,718 | 45,071 | 20,882 | 38,341 | 2,413 | 3,964 |
| (50.9) | (64.1) | (54.0) | (71.2) | (32.6) | (34.5) |
Equipment Leasing | 325 | 156 | 252 | 85 | 56 | 47 |
| (0.7) | (0.2) | (0.7) | (0.2) | (0.8) | (0.4) |
Hire Purchase | 17,376 | 5,302 | 14,781 | 4,953 | 1,743 | 238 |
| (35.8) | (7.5) | (38.2) | (9.2) | (23.5) | (2.1) |
Investment | 1,633 | 402 | 498 | 146 | 1,110 | 256 |
| (3.4) | (0.6) | (1.3) | (0.3) | (15.0) | (2.2) |
Loan | 4,499 | 19,362 | 2,240 | 10,348 | 2,089 | 6,995 |
| (9.3) | (27.5) | (5.8) | (19.2) | (28.2) | (60.8) |
MNBC | 2 | 0 | 0 | 0 | 0 | 0 |
| (0.0) | (0.0) | (0.0) | (0.0) | (0.0) | (0.0) |
Total | 48,554 | 70,292 | 38,653 | 53,873 | 7,412 | 11,500 |
P: Provisional. Note
: 1) Figures in respect of 2007-08 include 'IFCI Ltd' and 'TFCI
Ltd' 2) Figures in parentheses are percentages to respective totals.
Source : Annual Returns. | Distribution
of NBFCs-D According to Asset Size 6.62 The asset size of NBFCs varies
significantly from less than Rs.25 lakh to above Rs.500 crore. The asset holding
pattern remained skewed in 2007-08, with fifteen NBFCs with asset size of ‘above
Rs.500 crore’ holding 94.9 per cent of total assets of all NBFCs, while
the remaining 318 NBFCs held about 5.1 per cent of total assets at end-March 2008
(Table VI.25).
Table
VI.25: NBFCs-D According to Asset Size | (Amount
in Rs.crore) | Asset
Size | As
at end-March | No.
of Reporting Companies | Assets |
2007 | 2008
P | 2007 | 2008
P | 1 | 2 | 3 | 4 | 5 |
1. | Less
than 0.25 crore | 8 | 38 | 1 | 4 |
|
| |
| (0.0) | (0.0) |
2. | More
than 0.25 crore and up to 0.50 crore | 27 | 27 | 11 | 10 |
|
| |
| (0.0) | (0.0) |
3. | More
than 0.50 crore and up to 2 crore | 163 | 114 | 185 | 127 |
|
| |
| (0.4) | (0.2) |
4. | More
than 2 crore and up to 10 crore | 102 | 86 | 435 | 361 |
|
| |
| (0.9) | (0.5) |
5. | More
than 10 crore and up to 50 crore | 45 | 37 | 1,073 | 764 |
|
| |
| (2.2) | (1.1) |
6. | More
than 50 crore and up to 100 crore | 5 | 9 | 339 | 558 |
|
| |
| (0.7) | (0.8) |
7. | More
than 100 crore and up to 500 crore | 8 | 7 | 1,386 | 1,729 |
|
| |
| (2.9) | (2.5) |
8. | Above
500 crore | 15 | 15 | 45,125 | 66,739 |
|
| |
| (92.9) | (94.9) |
| Total
| 373 | 333 | 48,554 | 70,292 |
P : Provisional. Note
: 1) Figures in respect of 2007-08 include 'IFCI Ltd' and 'TFCI
Ltd' . 2) Figures in parentheses are percentages to respective totals.
Source : Annual Returns. | Distribution
of Assets of NBFCs – Type of Activity 6.63 While
assets held in the form of equipment and leasing witnessed a sharp decline during
2007-08, assets in the form of loans and inter-corporate deposits as also other
assets witnessed a sharp growth. Assets in the form of loans and bills, which
had witnessed a decline during 2006-07, increased sharply by 39.8 per cent. Assets
held in the hire purchase activity as well as investment activity, however witnessed
a deceleration. The hire purchase activity continued to constitute the largest
share (46.7 per cent) in total assets, followed by loans and inter-corporate deposits
(28.3 per cent) and investments (16.4 per cent) (Table VI.26).
Table
VI.26: Distribution of Assets of NBFCs-D | Activity-wise
| (Amount
in Rs. crore) | Activity | As
at | Percentage |
end-March | Variations |
2007 | 2008
P | 2006-07 | 2007-08 |
1 | 2 | 3 | 4 | 5 |
Loans and Inter- |
| |
| |
corporate Deposits | 11,059 | 19,921 | 3.5 | 80.1 |
| (22.8) | (28.3) |
| |
Investments | 7,412 | 11,500 | 71.3 | 55.2 |
| (15.3) | (16.4) |
| |
Hire Purchase | 26,222 | 32,842 | 31.1 | 25.2 |
| (54.0) | (46.7) |
| |
Equipment and Leasing | 740 | 411 | 20.0 | -44.5 |
| (1.5) | (0.6) |
| |
Bills | 7 | 10 | -83.1 | 39.8 |
| (0.0) | (0.0) |
| |
Other assets | 3,113 | 5,607 | 45.0 | 80.2 |
| (6.4) | (8.0) |
| |
Total | 48,554 | 70,292 | 28.4 | 44.8 |
P: Provisional. |
| |
| | Note
: 1) Figures in respect of 2007-08 include 'IFCI Ltd' and
'TFCI Ltd'. 2) Figures in parentheses are percentages to respective totals.
Source : Annual Returns. | 
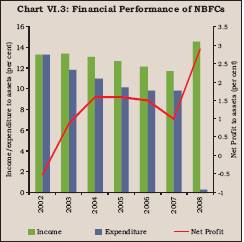
Financial
Performance of NBFCs 6.64 Financial
performance of NBFCs continued to improve during 2007-08. Both fund based income
(79.8 per cent) and fee based income (56.6 per cent) increased sharply.
As a result, even though expenditure witnessed an increase of 45.4 per cent, operating
profits increased by 263.2 per cent and net profits by 298.3 per cent. The cost
to income ratio declined sharply (to 68.5 per cent in 2007-08 from 84.4 per cent
in 2006-07) (Table VI.27).
Table VI.27: Financial
Performance of NBFCs-D | (Amount
in Rs. crore) | Indicator | As
at end-March | Percentage
Variations | 2007 | 2008
P | 2006-07 | 2007-08
P | 1 | 2 | 3 | 4 | 5 |
A. | Income
(i+ii) | 5,721 | 10,255 | 24.4 | 79.3 |
| (i) | Fund
Based | 5,590 | 10,051 | 25.5 | 79.8 |
|
| | (97.7) | (98.0) |
| |
| (ii) | Fee-Based | 131 | 204 | -11.2 | 56.6 |
|
| | (2.3) | (2.0) |
| |
B. | Expenditure
(i+ii+iii) | 4,831 | 7,023 | 28.7 | 45.4 |
| (i) | Financial | 2,765 | 4,696 | 29.0 | 69.8 |
|
| | (57.2) | (66.9) |
| |
| of
which | |
| |
| | Interest
Payment | 508 | 385 | -6.1 | -24.1 |
| (ii)
Operating | 1,261 | 2,167 | 33.4 | 71.9 |
|
| | (26.1) | (30.9) |
| |
| (iii) | Others | 804 | 160 | 21.1 | -80.1 |
|
| | (16.6) | (2.3) |
| |
C. | Tax
Provisions | 385 | 1,223 | 32.5 | 217.3 |
D. | Operating
Profit (PBT) | 890 | 3,232 | 5.1 | 263.2 |
E. | Net
Profit (PAT) | 504 | 2,009 | -9.3 | 298.3 |
F. | Total
Assets | 48,554 | 70,292 | 28.4 | 44.8 |
G. | Financial
Ratios | |
| |
| | (as
percentage of total assets) |
| |
| | i) | Income | 11.8 | 14.6 |
| |
| ii) | Fund
Income | 11.5 | 14.3 |
| |
| iii) | Fee
Income | 0.3 | 0.3 |
| |
| iv) | Expenditure | 9.9 | 10.0 |
| |
| v) | Financial
Expenditure | 5.7 | 6.7 |
| |
| vi) | Operating
Expenditure | 2.6 | 3.1 |
| |
| vii) | Tax
Provision | 0.8 | 1.7 |
| |
| viii)
Net Profit | 1.0 | 2.9 |
| |
H. | Cost
to Income Ratio | 84.4 | 68.5 |
| |
P : Provisional. Note
: 1) Figures in respect of 2007-08 include 'IFCI Ltd' and 'TFCI
Ltd'. 2) Figures in parentheses are percentages to respective totals.
Source : Annual Returns. | 6.65 Out of
the total cost incurred by NBFCs, the non-interest cost continued to constitute
the largest share (94. 5 per cent in 2007-08 as compared with 89.5 per cent in
2006-07). The interest cost constituted a smaller share of the total cost (Table
VI. 28).
Table
VI.28: Interest Cost of NBFCs-D | (Amount
in Rs. crore) | End-March | Total
Income | Total
Cost | Interest
Cost | Non-
Interest Cost | 1 | 2 | 3 | 4 | 5 |
2006-07 | 5,721 | 4,831 | 508 | 4,323 |
2007-08 P | 10,255 | 7,023 | 385 | 6,638 |
P: Provisional. Note:
1) Figures in respect of 2007-08 include 'IFCI Ltd' and 'TFCI Ltd'. 2) Figures
in parentheses are percentages to respective totals. Source :
Annual Returns. | 6.66 While income as
percentage of assets increased, expenditure (including provisions) as percentage
of assets declined sharply, resulting in a rise in the net profits to asset ratio
(Chart VI.3). 
Soundness
Indicators Asset Quality of NBFCs-D
6.67 Continuing the trend witnessed during the last few years, gross NPAs as well
as net NPAs (as percentage of gross advances and net advances, respectively) of
reporting NBFCs declined further during the year ended March 2008 (Table
VI.29).
Table
VI.29: NPA Ratios of NBFCs-D | (Per
cent) | End-March | Gross
NPAs to Gross Advances | Net
NPAs to Net Advances | 1 | 2 | 3 |
2001 | 11.5 | 5.6 |
2002 | 10.6 | 3.9 |
2003 | 8.8 | 2.7 |
2004 | 8.2 | 2.4 |
2005 | 5.7 | 2.5 |
2006 | 3.6 | 0.5 |
2007 | 2.2 | 0.2 |
2008 P | 1.5 | -8.7 |
P: Provisional. Note
: Figures in respect of 2007-08 include 'IFCI Ltd' and 'TFCI Ltd'.
Source : Half-Yearly Returns. | 6.68
Gross NPAs (as percentage of gross advances) of equipment leasing and hire purchase
companies increased during 2007-08, due to reclassification of NBFCs, while those
of asset finance companies and loan companies declined. Net NPAs (as percentage
of net advances) increased marginally in case of asset finance companies, hire
purchase companies and investment companies, while those of equipment leasing
companies, and loan companies improved further (Table VI.30).
Table
VI.30: NPAs of NBFCs-D by Classification of NBFCs |
(Amount
in Rs. crore) | Classification/
End-March | Gross
Advances | Gross
NPAs | Net
Advances | Net
NPAs | Amount | Percent
to Gross Advances | Percent
to Assets | Amount | Percent
to Net Advances | Percent
to Advances | 1 | 2 | 3 | 4 | 5 | 6 | 7 | 8 | 9 |
Asset Finance |
| |
| |
| |
| | 2007 | 11,824 | 262 | 2.2 | 2.2 | 11,548 | -14 | -0.1 | -0.1 |
2008 P | 37,254 | 656 | 1.8 | 1.7 | 36,626 | 28 | 0.1 | 0.1 |
Equipment Leasing
| 2001 | 4,118 | 304 | 7.4 | 6.1 | 3,826 | 12 | 0.3 | 0.2 |
2002 | 1,625 | 646 | 39.7 | 28.0 | 1,330 | 351 | 26.3 | 15.2 |
2003 | 5,969 | 932 | 15.6 | 11.1 | 5,506 | 469 | 8.5 | 5.6 |
2004 | 3,306 | 582 | 17.6 | 13.3 | 3,067 | 344 | 11.2 | 7.8 |
2005 | 4,187 | 514 | 12.3 | 11.0 | 4,018 | 345 | 8.6 | 7.4 |
2006 | 2,878 | 69 | 2.4 | 2.2 | 2,786 | -23 | -0.8 | -0.7 |
2007 | 1,057 | 45 | 4.2 | 4.0 | 992 | -20 | -1.9 | -1.8 |
2008 P | 26 | 6 | 24.3 | 7.2 | -10 | -29 | -114.9 | -34.2 |
Hire Purchase
| 2001 | 8,296 | 1,324 | 16.0 | 12.3 | 7,604 | 631 | 8.3 | 5.9 |
2002 | 6,825 | 1,167 | 17.1 | 14.8 | 6,068 | 410 | 6.8 | 5.2 |
2003 | 16,489 | 1,288 | 7.8 | 6.8 | 15,305 | 104 | 0.7 | 0.5 |
2004 | 10,437 | 942 | 9.0 | 7.3 | 9,748 | 253 | 2.6 | 2.0 |
2005 | 15,900 | 610 | 3.8 | 3.6 | 15,544 | 253 | 1.6 | 1.5 |
2006 | 17,607 | 444 | 2.5 | 2.4 | 17,238 | 74 | 0.4 | 0.4 |
2007 | 18,280 | 464 | 2.5 | 2.3 | 17,884 | 67 | 0.4 | 0.3 |
2008 P | 249 | 73 | 29.2 | 26.0 | 181 | 4 | 1.8 | 1.6 |
Investment
| 2001 | 232 | 53 | 22.9 | 5.1 | 223 | 45 | 20.0 | 4.3 |
2002 | 149 | 2 | 1.6 | 0.1 | 147 | 1 | 0.4 | – |
2003 | 93 | 11 | 11.9 | 2.1 | 90 | 8 | 8.9 | 1.5 |
2004 | 63 | 15 | 24.2 | 2.6 | 55 | 7 | 12.7 | 1.2 |
2005 | 58 | 10 | 18.0 | 1.8 | 58 | 10 | 18.0 | 1.8 |
2006 | 59 | – | 0.4 | 0.0 | 59 | – | 0.4 | – |
2007 | 31 | 1 | 2.8 | 0.1 | 31 | 1 | 2.8 | 0.1 |
2008 P | – | – |
| – | – | – |
| – |
Loan
| 2001 | 7,414 | 595 | 8.0 | 5.9 | 7,118 | 299 | 4.2 | 3.0 |
2002 | 3,986 | 549 | 13.8 | 10.1 | 3,615 | 177 | 4.9 | 3.3 |
2003 | 2,707 | 144 | 5.3 | 4.8 | 2,503 | -60 | -2.4 | -2.0 |
2004 | 2,038 | 142 | 7.0 | 4.1 | 1,833 | -63 | -3.4 | -1.8 |
2005 | 1,955 | 117 | 6.0 | 5.1 | 1,772 | -65 | -3.7 | -2.8 |
2006 | 690 | 252 | 36.5 | 19.3 | 483 | 45 | 9.3 | 3.4 |
2007 | 7,594 | 124 | 1.6 | 5.9 | 7,463 | -6 | -0.1 | -0.3 |
2008 P | 16,487 | 34 | 0.2 | 0.2 | 11,007 | -5,447 | -33.0 | -27.7 |
– : Nil/Negligible. P:
Provisional. Note : Figures in respect of 2007-08
include 'IFCI Ltd' and 'TFCI Ltd'. Source : Half-Yearly
Returns. | 6.69 Asset
quality of various types of NBFCs as reflected in various categories of NPAs (substandard,
doubtful and loss) remained broadly at the previous year’s level.
The sharp increase in the standard assets of asset finance companies and the corresponding
sharp decline in the case of equipment leasing companies and hire purchase companies
was mainly due to the reclassification of NBFCs (Table VI.31).
Table
VI.31: Classification of Assets of NBFCs-D - Group-wise |
(Amount
in Rs. crore) | Classification/ | Standard | Sub- | Doubtful | Loss
Assets | Gross
NPAs | Credit |
End-March | Assets | Standard Assets | Assets |
|
| Exposure |
1 | 2 | 3 | 4 | 5 | 6 | 7 |
Asset Finance |
| |
| |
| | 2007 | 11,562 | 242 | 17 | 3 | 262 | 11,824 |
| (97.8) | (2.1) | (0.1) | – | (2.2) |
| 2008 P | 36,599 | 586 | 41 | 29 | 656 | 37,254 |
| (98.2) | (1.6) | (0.1) | (0.1) | (1.8) |
| Equipment Leasing |
| |
| |
| |
2005 | 3,673 | 383 | 91 | 39 | 514 | 4,187 |
| (87.7) | (9.1) | (2.2) | (0.9) | (12.3) |
| 2006 | 2,809 | 12 | 21 | 36 | 69 | 2,878 |
| (97.6) | (0.4) | (0.7) | (1.2) | (2.4) |
| 2007 | 1,013 | 4 | 2 | 38 | 45 | 1,057 |
| (95.8) | (0.4) | (0.2) | (3.6) | (4.3) |
| 2008 P | 19 | 1 | 1 | 4 | 6 | 26 |
| (75.7) | (4.7) | (4.5) | (15.0) | (24.3) |
| Hire Purchase |
| |
| |
| |
2005 | 15,290 | 386 | 130 | 94 | 610 | 15,900 |
| (96.2) | (2.4) | (0.8) | (0.6) | (3.8) |
| 2006 | 17,163 | 184 | 47 | 212 | 444 | 17,607 |
| (97.5) | (1.0) | (0.3) | (1.2) | (2.5) |
| 2007 | 17,817 | 194 | 81 | 188 | 464 | 18,280 |
| (97.5) | (1.1) | (0.4) | (1.0) | (2.5) |
| 2008 P | 177 | 8 | 7 | 58 | 73 | 249 |
| (70.8) | (3.0) | (3.0) | (23.2) | (29.2) |
| Investment |
| |
| |
| |
2005 | 48 | 1 | 10 | – | 10 | 58 |
| (82.8) | (1.7) | (17.2) | – | (17.2) |
| 2006 | 59 | – | – | – | – | 59 |
| (99.6) | – | – | – | (0.4) |
| 2007 | 31 | 1 | – | – | 1 | 31 |
| (97.2) | (2.8) | – | – | (2.8) |
| 2008 P | – | – | – | – | – | – |
Loan |
| |
| |
| |
2005 | 1,837 | 14 | 42 | 61 | 117 | 1,955 |
| (94.0) | (0.7) | (2.1) | (3.1) | (6.0) |
| 2006 | 438 | 19 | 99 | 134 | 252 | 690 |
| (63.5) | (2.7) | (14.3) | (19.4) | (36.5) |
| 2007 | 7,470 | 9 | 91 | 24 | 124 | 7,594 |
| (98.4) | (0.1) | (1.2) | (0.3) | (1.6) |
| 2008 P | 16,454 | 21 | 11 | 2 | 34 | 16,487 |
| (99.8) | (0.1) | (0.1) | – | (0.2) |
| – : Nil/Negligible.
P: Provisional Note : 1) Figures in respect of 2007-08
include 'IFCI Ltd' and 'TFCI Ltd'. 2) Figures in parentheses are percentages
to credit exposures. Source : Half-Yearly Returns |
Capital Adequacy Ratio
6.70 Capital to risk-weighted assets ratio (CRAR) norms were made applicable to
NBFCs in 1998, in terms of which every deposit-taking NBFC is required to maintain
a minimum capital, consisting of Tier-I and Tier-II capital, of not less than
12 per cent (15 per cent in the case of unrated deposit-taking loan/investment
companies) of its aggregate risk-weighted assets and of risk-adjusted value of
off-balance sheet items. Total of Tier-II capital, at any point of time, cannot
exceed 100 per cent of Tier-I capital. The number of NBFCs with less than the
minimum regulatory CRAR of 12 per cent increased to 44 at end-March 2008 from
20 at end-March 2007 (Table VI.32). At end-March 2008, 276
out of 320 NBFCs had CRAR of 12 per cent or more as against 354 out of 374 NBFCs
at end-March 2007. The number of NBFCs with CRAR more than 30 also declined
to 238 at end-March 2008 from 305 at end-March 2007. Notwithstanding this, it
is noteworthy that the NBFC sector is witnessing a consolidation process in the
last few years, wherein the weaker NBFCs are gradually exiting, paving the way
for a stronger NBFC sector. 6.71 Net owned fund (NOF) of
NBFCs is the aggregate of paid-up capital and free reserves, netted by (i) the
amount of accumulated losses; and (ii) deferred revenue expenditure and other
intangible assets, if any, and
Table
VI.32: Capital Adequacy Ratio of NBFCs-D |
(per
cent) | CRAR
Range | As
at end-March | 2007 | 2008
P | AFC | EL | HP | LC/
IC | Total | AFC | EL | HP | LC/
IC | Total |
1 | 2 | 3 | 4 | 5 | 6 | 7 | 8 | 9 | 10 | 11 |
1) | Less
than 12 per cent (a+b) | 0 | 4 | 13 | 3 | 20 | 20 | 4 | 12 | 8 | 44 |
| a)
Less than 9 per cent | 0 | 4 | 13 | 3 | 20 | 20 | 4 | 12 | 7 | 43 |
| b)
More than 9 and up to 12 per cent | 0 | 0 | 0 | 0 | 0 | 0 | 0 | 0 | 1 | 1 |
2) | More
than 12 and up to 15 per cent | 2 | 0 | 2 | 0 | 4 | 3 | 0 | 0 | 1 | 4 |
3) | More
than 15 and up to 20 per cent | 3 | 1 | 7 | 1 | 12 | 5 | 0 | 0 | 1 | 6 |
4) | More
than 20 and up to 30 per cent | 2 | 2 | 23 | 6 | 33 | 24 | 0 | 1 | 3 | 28 |
5) | Above
30 per cent | 44 | 22 | 217 | 22 | 305 | 115 | 10 | 70 | 43 | 238 |
Total | 51 | 29 | 262 | 32 | 374 | 167 | 14 | 83 | 56 | 320 |
P: Provisional. Note
: AFC: Asset Finance Companies; EL: Equipment Leasing
Companies; HP: Hire Purchase Companies; LC/IC = Loan Companies/Investment
Companies. Source : Half-yearly Returns. |
adjusted by investments in shares, and loans and advances
to (a) subsidiaries, (b) companies in the same group, and (c) other NBFCs (in
excess of 10 per cent of owned fund). Information about NOF can complement the
information on CRAR. The ratio of public deposits to NOF in the case of
loan companies and MNBCs declined during the year ended March 2008, while that
of other category companies witnessed a marginal increase.
The ratio of equipment leasing companies continued to be negative because of negative
net owned funds, although there was some moderation. The ratio of public deposit
to NOF for all categories of NBFCs taken together was 0.2 per cent at end-March
2008 as compared with 0.3 per cent at end-March 2007 (Table VI.33).
Table
VI.33 Net Owned Fund vis-à-vis Public Deposits of NBFCs-D
| (Amount
in Rs.crore) | Classification | As
at end-March | Net
Owned Fund | Public
Deposits | 2007 | 2008
P | 2007 | 2008
P | 1 | 2 | 3 | 4 | 5 |
1. | Asset
Finance | 2,673 | 6,452 | 186 | 1,156 |
|
| |
| (0.1) | (0.2) |
2. | Equipment
Leasing | -15 | -42 | 43 | 8 |
|
| |
| (-2.9) | (-0.2) |
3. | Hire
Purchase | 3,004 | 675 | 1,683 | 533 |
|
| |
| (0.6) | (0.8) |
4. | Investment | 822 | 83 | 45 | 19 |
|
| |
| (0.1) | (0.2) |
5. | Loan | 437 | 3,379 | 117 | 321 |
|
| |
| (0.3) | (0.1) |
6. | MNBC | 0 | 0 | 2 | 0 |
|
| |
| (6.6) | (0.0) |
Total | 6,921 | 10,546 | 2,077 | 2,038 |
|
| | (0.3) | (0.2) |
P: Provisional Note
: 1) Figures in respect of 2007-08 include 'IFCI Ltd' and 'TFCI
Ltd'. 2) Figures in parentheses are ratio of public deposits to net owned
fund. Source : Annual Returns. | 6.72
Net owned funds of NBFCs range from less than Rs.25 lakh to above Rs.500 crore.
Public deposits, as ratio of NOF, held by NBFCs in the category of NOF of ‘more
than Rs.2 crore and up to Rs.10 crore’, ‘more than Rs.50 crore and
upto Rs.100 crore' and 'above Rs.500 crore' remained constant, while those by
NBFCs in all other ranges of NOF generally declined except in the case of the
category ‘more than Rs.100 crore and upto Rs.500 crore’ (Table
VI.34).
Table
VI.34: Range of Net Owned Funds vis-à-vis Public
Deposits of NBFCs-D | (Amount
in Rs.crore) | Ranges
of Net Owned Fund | As
at end-March | 2006-07 | 2007-08
P | No.
of | Net
Owned | Public | No.
of | Net
Owned | Public |
Companies | Fund | Deposits | Companies | Fund | Deposits |
1 | 2 | 3 | 4 | 5 | 6 | 7 |
1. | Up
to Rs.0.25 crore | 18 | -442 | 173 | 8 | -229 | 137 |
|
| |
| -(0.4) |
| | -(0.6) |
2. | More
than Rs.0.25 crore and up to Rs.2 crore | 255 | 181 | 101 | 227 | 163 | 88 |
|
| |
| (0.6) |
| | (0.5) |
3. | More
than Rs.2 crore and up to Rs.10 crore | 63 | 287 | 129 | 60 | 258 | 135 |
|
| |
| (0.5) |
| | (0.5) |
4. | More
than Rs.10 crore and up to Rs.50 crore | 22 | 498 | 275 | 21 | 440 | 145 |
|
| |
| (0.6) |
| | (0.3) |
5. | More
than Rs.50 crore and up to Rs.100 crore | 2 | 125 | 45 | 3 | 226 | 91 |
|
| |
| (0.4) |
| | (0.4) |
6. | More
than Rs.100 crore and up to Rs.500 crore | 7 | 1540 | 683 | 7 | 1496 | 677 |
|
| |
| (0.4) |
| | (0.5) |
7. | Above
Rs.500 crore | 6 | 4733 | 671 | 7 | 8192 | 765 |
|
| |
| (0.1) |
| | (0.1) |
Total | 373 | 6,921 | 2,077 | 333 | 10,546 | 2,038 |
|
| | (0.3) |
| | (0.2) |
P: Provisional. Note
: 1) Figures in respect of 2007-08 include 'IFCI Ltd' and 'TFCI
Ltd'. 2) Figures in parentheses are ratio of public deposit to the respective
net owned fund. Source : Annual Returns. |
Residuary Non-Banking Companies (RNBCs) 6.73
Assets of the RNBCs increased by 5.5 per cent during the year ended March 2008.
Their assets in the form of unencumbered approved securities declined, while those
in bonds/debentures and fixed deposits/ certificates of deposit of SCBs registered
an increase. Net owned funds of RNBCs increased by 25.5 per cent during 2007-08
on top of the rise of 15.5 per cent witnessed during 2006-07 (Table
VI.35).
Table
VI.35: Profile of RNBCs | (Amount
in Rs.crore) | Item | As
at end-March | Percentage
Variation | 2007 | 2008
P | 2006-07 | 2007-08
P | 1 | 2 | 3 | 4 | 5 |
A. | Assets
(i to v) | 23,172 | 24,452 | 5.9 | 5.5 |
| (i) | Investment
in Unencumbered Approved Securities | 3,317 | 3,137 | 41.4 | -5.4 |
| (ii) | Investment
in Fixed deposits/ Certificates of Deposit of |
| |
| |
| | Scheduled
Commercial Banks/ Public Financial Institutions | 5,604 | 6,562 | -8.0 | 17.1 |
| (iii)
Debentures/Bonds/Commercial Papers of Govt. |
| |
| |
| | Companies/Public
Sector Banks/Public Financial | |
| |
| |
| Institution/Corporation | 11,700 | 12,320 | 22.2 | 5.3 |
| (iv) | Other
investments | 1,156 | 573 | -30.2 | -50.4 |
| (v) | Other
Assets | 1,394 | 1,860 | -37.2 | 33.5 |
B. | Net
Owned Funds | 1,366 | 1,714 | 15.5 | 25.5 |
C. | Total
Income (i+ii) | 1,893 | 2,325 | 16.9 | 22.8 |
| (i) | Fund
Income | 1,886 | 2,303 | 16.7 | 22.1 |
| (ii) | Fee
Income | 8 | 22 | 156.7 | 191.7 |
D. | Total
Expenses (i+ii+iii) | 1,648 | 1,725 | 14.5 | 4.7 |
| (i) | Financial
Cost | 1,230 | 1,321 | 5.5 | 7.5 |
| (ii) | Operating
Cost | 284 | 329 | 78.8 | 15.5 |
| (iii) | Other
cost | 134 | 75 | 17.4 | -44.1 |
E. Taxation | 44 | 224 | 101.1 | 406.8 |
F. Operating Profit
(PBT) | 246 | 601 | 36.5 | 144.5 |
G. Net profit (PAT) | 201 | 377 | 27.5 | 86.9 |
P : Provisional Note
: PBT - Profit Before Tax; PAT - Profit After Tax Source:
Annual Returns. | 6.74
In continuation of the trend witnessed in 2006-07, the increase in income of RNBCs
during 2007-08 was more than the increase in expenditure, as a result of which
the operating profit of RNBCs increased sharply. Even though the provision for
taxation also registered a sharp rise, the net profit of RNBCs increased by 86.9
per cent during 2007-08 as compared with 27.5 per cent during 2006-07. Regional
Pattern of Deposits of RNBCs 6.75 Of the two RNBCs, one is based in
the Eastern region (Kolkata) and the other in the Central region. The public deposits
held by RNBCs in both the Eastern region and Central region registered a marginal
decline. Of the four metropolitan cities, RNBCs held public deposits only in one
metropolitan city, i.e., Kolkata (Table VI.36).
Table
VI.36: Public Deposits Held by | RNBCs
- Region-wise | (Amount
in Rs.crore) | Region | As
at end-March | 2006-07 | 2007-08
P | No
of RNBCs | Amount | No
of RNBCs | Amount |
1 | 2 | 3 | 4 | 5 |
1. | Central | 1 | 18,108 | 1 | 18,056 |
|
| | (80.0) |
| (80.8) |
2. | Eastern | 2 | 4,515 | 1 | 4,302 |
|
| | (20.0) |
| (19.2) |
3. | North-Eastern | - | - | - | - |
4. | Northern | - | - | - | - |
5. | Southern | - | - | - | - |
6. | Western | - | - | - | - |
Total (1 to 6) | 3 | 22,622 | 2 | 22,358 |
Metropolitan Cities: |
| |
| |
1. | Chennai | - | - | - | - |
2. | Kolkata | 2 | 4,515 | 1 | 4,302 |
3. | Mumbai | - | - | - | - |
4. | New
Delhi | - | - | - | - |
Total (1 to 4) | 2 | 4,515 | 1 | 4,302 |
-: Nil/Negligible; P: Provisional.
Note : Figures in parentheses are percentages to respective totals.
Source : Annual Return. | Investment
Pattern of RNBCs 6.76 The investment pattern of RNBCs as prescribed
in the Residuary Non-Banking (Reserve Bank) Directions, 1987 was reviewed and
modified on March 31, 2006. The aggregate liability to depositor (ALD) was bifurcated
under two heads, viz., aggregate liability to depositor (ALD) as on December
31, 2005 and incremental ALDs. Incremental ALDs are the liabilities to the depositors
exceeding the aggregate amount of the liabilities to the depositors as on December
31, 2005. RNBCs were advised to invest, with effect from April 1, 2006, not less
than 95 per cent of the ALD as on December 31, 2005 and the entire incremental
ALD in the prescribed manner. RNBCs were also advised that on and from April 1,
2007, the entire amount of ALD would be invested in directed investments only
and no discretionary investment would be allowed to be made by them. 6.77
Aggregate liability to depositor (ALD) declined marginally by 1.7 per cent during
2007-08. While fixed deposits with banks and bonds and debentures increased,
unencumbered approved securities and other investments registered a decline (Table
VI.37).
Table
VI.37: Investment Pattern of RNBCs |
(Amount in
Rs.crore) | Item | End-
March | 2006-07 | 2007-08
P | 1 | 2 | 3 |
Aggregated Liabilities to the
Depositors (ALD) | 22,622 | 22,358 |
(i) | Unencumbered
Approved Securities | 3,317 | 3,137 |
|
| (14.7) | (14.0) |
(ii) | Fixed
Deposits with Banks | 5,604 | 6,562 |
|
| (24.8) | (29.3) |
(iii) | Bonds
or debentures or commercial papers of a Govt. company/ |
| |
| public
sector bank/ public financial institution/ corporations | 11,700 | 12,320 |
|
| (51.7) | (55.1) |
(iv) | Other
investments | 1,156 | 573 |
|
| (5.1) | (2.6) |
P: Provisional. Note
: Figures in parentheses are percentages to ALDs. Source
: Annual Returns. | Non-Deposit Taking
Systemically Important Non-Banking Finance Companies (NBFCs - ND - SI) 6.78
Information based on the returns received from non-deposit taking systemically
important NBFCs (with asset size of Rs.100 crore and above) for the year ended
March 2008 showed an increase of 28.6 per cent in their liabilities/assets over
the year ended March 2007. Unsecured loans continued to constitute the single
largest source of funds for NBFCs-ND-SI, followed by secured loans and reserves
and surplus (Table VI.38).
TableVI.38:
Liabilities of NBFCs-ND-SI | (Amount
in Rs.crore) | Items | As
at end | March
2007 | March
2008 | June
2008 | 1 | 2 | 3 | 4 |
Total Liabilities | 3,17,898 | 4,08,705 | 4,23,083 |
of which: |
| |
| a) Paid up Capital | 18,904 | 24,490 | 27,217 |
| (5.9) | (6.0) | (6.4) |
b) Preference Shares | 2,192 | 4,573 | 4,845 |
| (0.7) | (1.1) | (1.1) |
c) Reserve & Surplus | 52,090 | 81,055 | 78,467 |
| (16.4) | (19.8) | (18.5) |
d) Secured Loans | 93,765 | 1,21,082 | 1,23,764 |
| (29.5) | (29.6) | (29.3) |
e) Unsecured Loans | 1,18,221 | 1,50,206 | 1,55,727 |
| (37.2) | (36.8) | (36.8) |
Note : Figures
in parentheses are percentages to Total Liabilities. Source : Monthly
return by NBFCs-ND-SI. | Borrowings
6.79 Total borrowings (secured and unsecured) by NBFCs-ND-SI increased by 28.0
per cent to Rs.2,71,288 crore during the year ended March 2008, constituting 66.4
per cent of their total liabilities. During the quarter ended June 2008, the total
borrowings increased further by 3.0 per cent to Rs.2,79,491 crore (Table
VI.39).
Table
VI.39: Borrowings by NBFCs-ND-SI |
(Amount in
Rs crore) | Items | As
at end | March
2007 | March
2008 | June
2008 | 1 | 2 | 3 | 4 |
A | Secured
Borrowings (i to vi) | 93,765 | 1,21,082 | 1,23,764 |
|
| | (44.2) | (44.6) | (44.3) |
| i. | Secured
Debentures | 32,564 | 44,439 | 44,809 |
|
| | (15.4) | (16.4) | (16.0) |
| ii. | Deferred
Credit | 0 | 0 | 0 |
|
| | (0.0) | (0.0) | (0.0) |
| iii. | Term
Loan from Banks | 19,503 | 25,774 | 27,795 |
|
| | (9.2) | (9.5) | (9.9) |
| iv. | Term
Loan from FIs | 5,030 | 5,988 | 5,757 |
|
| | (2.4) | (2.2) | (2.1) |
| v. | Others | 35,745 | 42,864 | 42,608 |
|
| | (16.9) | (15.8) | (15.2) |
| vi. | Interest
accrued | 923 | 2,017 | 2,795 |
|
| | (0.4) | (0.7) | (1.0) |
B | Unsecured
borrowings( i to viii) | 1,18,221 | 1,50,206 | 1,55,727 |
|
| | (55.8) | (55.4) | (55.7) |
| i. | Loans
from Relatives | 1,621 | 1,822 | 1,390 |
|
| | (0.8) | (0.7) | (0.5) |
| ii. | ICDs | 20,018 | 22,019 | 20,610 |
|
| | (9.4) | (8.1) | (7.4) |
| iii. | Loans
from Banks | 33,191 | 46,243 | 45,946 |
|
| | (15.7) | (17.0) | (16.4) |
| iv. | Loans
from FIs | 4,218 | 2,956 | 4,030 |
|
| | (2.0) | (1.1) | (1.4) |
| v. | Commercial
Papers | 14,031 | 20,068 | 21,282 |
|
| | (6.6) | (7.4) | (7.6) |
| vi. | Unsecured
Debentures | 30,549 | 44,432 | 47,008 |
|
| | (14.4) | (16.4) | (16.8) |
| vii. | Others | 13,786 | 10,847 | 13,193 |
|
| | (6.5) | (4.0) | (4.7) |
| viii. | Loans
Interest accrued | 807 | 1,819 | 2,268 |
|
| | (0.4) | (0.7) | (0.8) |
| Total
Borrowings | 2,11,986 | 2,71,288 | 2,79,491 |
| Memo:
| |
| |
| Total
Liabilities | 3,17,898 | 4,08,705 | 4,23,083 |
Note : Figures
in parentheses are percentages to 'Total Borrowings'. Source:
Monthly returns of NBFCs-ND-SI. | Application
of Funds 6.80 The pattern of application of funds
by NBFCs-ND-SI during the year ended March 2008 remained broadly in line with
the pattern witnessed during the previous year. The secured loans continued to
constitute the largest share (44.7 per cent), followed by unsecured loans with
a share of 24.8 per cent (Table VI.40).
Table
VI.40: Select Indicators on Application of Funds by NBFCs-ND-SI |
(Amount
in Rs.crore) | Items | As
at end | March
2007 | March
2008 | June
2008 | 1
| 2 | 3 | 4 |
Secured Loan | 1,14,898 | 1,60,017 | 1,67,767 |
| (41.5) | (44.7) | (44.0) |
Unsecured Loan | 69,609 | 88,783 | 90,746 |
| (25.2) | (24.8) | (23.8) |
Hire Purchase Assets | 28,160 | 29,832 | 34,693 |
| (10.2) | (8.3) | (9.1) |
Long-term Investment | 43,309 | 53,856 | 57,888 |
| (15.7) | (15.0) | (15.2) |
Current Investment | 20,671 | 25,758 | 29,763 |
| (7.5) | (7.2) | (7.8) |
Total | 2,76,647 | 3,58,246 | 3,80,855 |
Memo Items: |
| |
| Capital Market Exposure | 81,435 | 1,11,630 | 1,05,111 |
of which: |
| |
| Equity Market | 34,196 | 35,957 | 35,203 |
Note :
Figures in parentheses are percentages to respective totals. Source
: Monthly returns of NBFCs-ND-SI. | Financial
Performance 6.81 NBFCs-ND-SI earned a profit of Rs.8,705
crore during the year ended March 2008, which was higher by 16.7 per cent as compared
with the profit earned during the year ended March 2007 (Rs.7,460 crore) (Table
VI.41).
Table
VI.41: Financial Performance by NBFCs-ND-SI | (Amount
in Rs.crore) | Items
| Year
Ended | Quarter
Ended | March
2007 | March
2008 | June
2008 | 1 | 2 | 3 | 4 |
Total Assets | 3,17,898 | 4,08,705 | 4,23,083 |
Total Income @ | 31,281 | 39,537 | 11,564 |
| (9.8) | (9.7) | (2.7) |
Total Expenses @ | 20,552 | 27,291 | 8,877 |
| (6.5) | (6.7) | (2.1) |
Net Profit @ | 7,460 | 8,705 | 2,150 |
| (2.3) | (2.1) | (0.5) |
@: Cumulative
Note: Figures in parentheses are percentages to Total Assets.
Source: Monthly returns of NBFCs-ND-SI. | 6.82
The gross NPAs to total assets ratio of NBFCs-ND-SI remained unchanged at 2.3
per cent for the year ended March 2008 and also for the quarter ended June 2008.
The net NPAs to total assets ratio increased from 1.5 per cent as at end March
2007 to 1.6 per cent as at end March 2008, but declined to 1.4 per cent during
the quarter ended June 2008 (Table VI.42).
Table
VI.42: Gross and Net NPAs of NBFCs-ND-SI | (Per
cent) | Items | As
at end | March | March | June |
2007 | 2008 | 2008 |
1 | 2 | 3 | 4 |
1 | Gross
NPAs to Total Assets | 2.3 | 2.3 | 2.3 |
2 | Net
NPAs to Total Assets | 1.5 | 1.6 | 1.4 |
3 | Gross
NPAs to Total Credit Exposure | 4.9 | 3.1 | 4.5 |
4 | Net
NPAs to Net Credit Exposure | 1.9 | 2.0 | 2.2 |
Source :
Monthly returns of NBFCs-ND-SI. | 4. Primary
Dealers 6.83 In order to strengthen the market
infrastructure of Government securities market and make it vibrant, liquid and
broad-based, the primary dealers (PDs) system was introduced by Reserve Bank in
1995. The PD system is designed to facilitate Government's market borrowing programme
and improve the secondary market trading system by contributing to price discovery,
enhancing liquidity and turnover and encouraging voluntary holding of Government
securities amongst a wider investor base. The PD system developed significantly
over the years and currently it serves as an effective conduit for conducting
open market operations. 6.84 The PD system continued to
play a significant role in the Government securities market during the year 2007-08.
The number of PDs increased to 19 at end-March 2008 as compared with 17
at the end-March 2007. Of these 19 entities, 10 were banks undertaking PD business
departmentally (Bank-PDs) and the remaining nine were stand-alone, non-bank entities.
HDFC Bank Limited was authorised to take up PD business with effect from April
2, 2007 and one new stand-alone PD, viz., Lehman Brothers Fixed Income
Securities Pvt. Limited (LBFISL), was also authorised to undertake PD business
with effect from November 1, 2007. However, following the filing of a petition
under Chapter 11 of the US Bankruptcy code by Lehman Brothers Holding Inc. in
the US, the Reserve Bank announced certain measures in public interest and in
the interest of financial stability. As such, LBFISL was advised not to declare
any interim dividend or remit any amount to its holding company or any other group
company without prior approval of the Reserve Bank. Further, they were advised
not to undertake transactions in Government securities as a PD in the primary
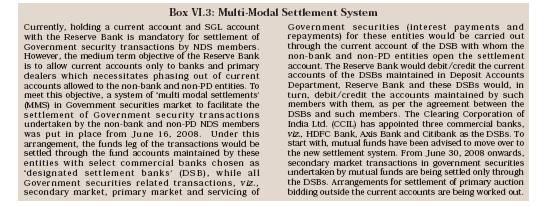
market. 6.85 The regulatory guidelines issued in July 2006 prohibited PDs
from setting up step-down subsidiaries. Accordingly, PDs that already had step-down
subsidiaries (in India and abroad) were required to restructure the ownership
pattern of those subsidiaries. The stand-alone PDs complied with these guidelines
during the year. 6.86 The Reserve Bank initiated steps to
phase out current account facility allowed to the non-bank and non-PD entities.
The establishment of Multi Modal Settlements (MMS) system was a major step in
this regard (Box VI.3) 
6.87 In recent years, the non-competitive bidding facility has been receiving
good response. The Working Group on Auction Process of Government of India Securities
(Chairman: H.R. Khan), which submitted its report in March 2008, made several
important recommendations regarding the non-competitive bidding facility (Box
VI.4). 
6.88 The bidding commitment of PDs in the underwriting auction of dated Government
of India securities was revised from the earlier stipulation of a minimum of 3
per cent of the notified amount to an amount equal to the minimum underwriting
commitment (MUC) with effect from November 22, 2007. Operations
and Performance of PDs 6.89 A significant portion
of the market demand for Government securities in the primary market emanates
from the PDs. The aggregate bids submitted by the PDs in the auctions of Treasury
Bills and dated securities, as reflected in the bid-cover ratio, tended to increase
in recent years in tandem with the increase in issuances. The PDs also maintained
a dominant share of over 45 per cent in primary auction allotments.
6.90 During 2007-08, cumulative bidding commitments in Treasury Bills auctions
were fixed to ensure that PDs bid for the notified amount. The aggregate bids
at Rs.3,18,201 crore were, however, much higher at 3.04 times of the aggregate
commitment of Rs.1,04,385 crore (under the regular borrowing programme). Bids
amounting to Rs.1,04,819 crores were accepted in Treasury Bill auctions. PDs are
required to achieve a success ratio of 40 per cent of bidding commitment in respect
of Treasury Bill auctions on a half-yearly basis. While the PDs achieved a success
ratio of 94.43 per cent during the year 2006-07, the achievement during 2007-08
was higher at 100.42 per cent. The PDs’ share in the primary auctions of
Treasury Bills increased to 48 per cent during 2007-08 from 38 per cent during
2006-07. 6.91 In terms of the Fiscal Responsibility and
Budget Management Act, 2003, the Reserve Bank was prohibited from participating
in the primary auctions of Central Government securities. The PDs were, therefore,
enjoined to underwrite the entire notified amount in the auctions of dated Government
of India securities. During 2007-08, the PDs offered to underwrite the auctions
of Central Government dated securities to the extent of Rs.2,76,518 crore as against
the notified amount of Rs.1,56,000 crore. This represented a bid-cover ratio of
1.77 in underwriting auctions. Of the total thirty five primary auctions of dated
securities held during the year, there was a devolvement of Rs.957 crore on PDs
in one auction. 6.92 The actual bids tendered by the PDs
(Rs.2,54,253 crore) in the auction of dated securities were 1.6 times of the notified
amount. Of the total bids made by PDs in dated securities, bids worth Rs.72,122
crore were accepted. The success ratio at 46.2 per cent was a marginal increase
over 44.3 per cent during the period 2006-07 (Table VI.43).
Table VI.43: Performance
of the PDs in the Primary Market (At end-March)
| (Amount
in Rs. crore) | Items | 2007 | 2008 |
1 | 2 | 3 |
Treasury Bills |
| | 1.
Bidding Commitment | 1,02,675 | 1,04,385 |
2. Actual Bids Submitted | 2,84,686 | 3,18,201 |
3. Bid to Cover Ratio (in per cent) | 2.77 | 3.04 |
4. Bid Accepted | 96,952 | 1,04,819 |
5. Success Ratio (in per cent) | 94.43 | 100.42 |
Central Govt. Securities |
| |
1. Notified Amount | 1,46,000 | 1,56,000 |
2. Actual Bids submitted | 2,02,462 | 2,54,253 |
3. Bid to Cover Ratio (in per cent) | 1.39 | 1.63 |
4. Bid Accepted | 64,727 | 72,122 |
5. Success Ratio in (in per cent) | 44.33 | 46.23 |
6.93 The secondary market turnover of Treasury Bills
and Government dated securities (both outright and repo) traded by stand-alone
PDs amounted to Rs.1,57,747 crore and Rs.16,80,073 crore, respectively, constituting
16 per cent and 17 per cent, respectively, of the market turnover. The share of
PDs in total market turnover worked out to 16 per cent.
Sources and Application of Funds 6.94 The consolidated
balance sheet size of nine stand-alone PDs at end-March 2008 declined by 19.7
per cent as compared with the position at end-March 2007 due to restructuring
of their businesses. Three PDs hived off their PD operations to newly set up group
entities with reduced capital. Capital funds of the stand-alone PDs declined by
27.8 per cent as on March 31, 2008 in contrast with the sharp increase of 46.3
per cent as on March 31, 2007. On the sources side, secured loans increased by
17.1 per cent during 2007-08, while unsecured loans registered a sharp decline
of 36.1 per cent. The decline in the growth rate of unsecured loans during 2007-08
was in contrast with the sharp rise (of 20.3 per cent) witnessed during 2006-07.
On the deployment side, investments in corporate bonds increased by 4.3 per cent
(from Rs.595 crore to Rs.621 crore) in contrast to the decline of 12.7 per cent
witnessed during 2006-07. (Table VI.44). The share of Government
securities and Treasury Bills in total assets of PDs increased to 70 per cent
at end-March 2008 from 55 per cent at end-March 2007.
Table
VI.44: Sources and Applications of Funds of Primary Dealers
| (Amount
in Rs. crore) | Items | End-March | Percentage
Variations | 2007 | 2008 | 2007 | 2008 |
1 | 2 | 3 | 4 | 5 |
Sources of Funds | 13,557 | 10,882 | 26.1 | -19.7 |
1. | Capital | 2,088 | 1,508 | 46.3 | -27.8 |
2. | Reserves
and Surplus | 3,102 | 1,944 | 8.6 | -37.3 |
3. | Loans
(a+b) | 8,367 | 7,430 | 29.4 | -11.2 |
| a)
Secured | 3,910 | 4,580 | 41.7 | 17.1 |
| b)
Unsecured | 4,457 | 2,850 | 20.3 | -36.1 |
Application of Funds | 13,557 | 10,882 | 26.1 | -19.7 |
1. | Fixed
Assets | 72 | 14 | 12.2 | -80.5 |
2. | Investments
(a to c) | 9,248 | 8,291 | 16.3 | -10.3 |
| a)
Government Securities | 7,412 | 7,584 | 11.5 | 2.3 |
| b)
Commercial Papers | 1,241 | 86 | 98.2 | -93.1 |
| c)
Corporate Bonds | 595 | 621 | -12.7 | 4.3 |
3. | Loans
and Advances | 1,135 | 429 | -39.7 | -62.2 |
4. | Non-current
Assets | - | - | - | - |
Equity, Mutual Funds, etc. | 928 | 150 | - | -83.9 |
Others* | 2,174 | 2,148 | 156.4 | -1.2 |
No. of PDs ** | 8 | 9 | 8 | 9 |
*: Others include cash+ bank
balances + accrued interest + DTA - current liabilities and provisions.
** : Stand-alone PDs only. Source : Annual Reports of respective
PDs. | Financial Performance of PDs
6.95 The income earned by the PDs declined by 33 per cent during
the year 2007-08 as compared with that in 2006-07, due to restructuring of business
by PDs and consequent decline in income from other activities that were not allowed
to be undertaken by PDs. However, a corresponding sharp decline on the expenditure
front and a rise in trading profits restricted the decline in net profit during
the year (Table VI.45).
Table
VI.45: Financial Performance of | Primary
Dealers | (Amount
in Rs. crore) | Items |
| 2006-07 | 2007-08 | Percentage
Variations |
|
|
|
| 2006-07 | 2007-08 |
1 |
| 2 | 3 | 4 | 5 |
A. Income (i to iii) | 1,950 | 1,307 | 17 | -33 |
i) | Interest
and discount | 986 | 914 | 21 | -7 |
ii) | Trading
Profit | -17 | 255 | - | - |
iii) | Other
income | 979 | 138 | 22 | -86 |
B. Expenses (i+ii) | 1,314 | 775 | 49 | -43 |
i) | Interest | 668 | 595 | 38 | -11 |
ii) | Administrative
Costs | 645 | 180 | 62 | -76 |
Profit Before Tax | 636 | 531 | -18 | -16 |
Profit After Tax | 444 | 373 | -20 | -16 |
No. of PDs ** | 8 | 9 | 8 | 9 |
** : Stand-alone PDs only.
Source: Primary Dealers' Return (PDR) | however,
increased from 9.5 per cent during 2006-07 to 10.8 per cent in 2007-08, reflecting
the better use of capital. (Appendix
Table VI.5). The cost-income ratio declined from 50 per cent in 2006-07 to
25 per cent in 2007-08 as some PDs significantly improved their efficiency ratio.
6.97 Stand-alone PDs continued to be adequately capitalised.
The capital to risk weighted-assets ratio (CRAR) of individual stand-alone PDs
remained above the prescribed minimum CRAR of 15 per cent. The CRAR of the stand-alone
PDs as a group was at 38 per cent as on March 31, 2008. (Appendix
Table VI.6 and Table VI.47).
Table
VI.47: Select Indicators of Primary Dealers (At end-March)
| (Amount
in Rs. crore) | Items | 2007 | 2008 |
1 | 2 | 3 |
Total Assets* | 13,557 | 10,882 |
Of which: Government Securities | 7,412 | 7,584 |
Government Securities as Per cent of Total
Assets | 55 | 70 |
Total Capital Funds | 4,026 | 3,611 |
CRAR (in per cent) | 33 | 38 |
Liquidity Support Limit | 3,000 | 3,000 |
No. of PDs ** | 8 | 9 |
* : Net of Current Assets and
Liabilities. ** : Stand-alone PDs only. Source : Primary
Dealers' Returns (PDR). | |