 IST,
IST,
Operations and Performance of Commercial Banks
The Indian banking sector remained resilient in 2021-22 and 2022-23 so far, as banks witnessed healthy balance sheet growth on broad-based acceleration in credit. Deposit growth moderated from the COVID-19 induced precautionary surge. Augmented capital buffers, better asset quality and enhanced profitability indicators reflected their robustness. Going forward, fuller transmission of increased policy interest rate to deposit rates may augment deposit growth to meet credit demand. Slippages in restructured assets need to be monitored closely. 1. Introduction IV.1 During 2021-22, the balance sheet of commercial banks expanded at a multi-year high pace. Timely policy support cushioned the impact of the pandemic on banks’ financial performance and soundness indicators. The legacy challenge of non-performing assets (NPAs) is easing, and profitability has been improving sequentially to levels last observed in 2014-15. This has been accompanied by lower slippages and the bolstering of capital buffers. IV.2 Against this backdrop, this chapter addresses the operations and performance of commercial banks during 2021-22 and H1:2022-23. An analysis of balance sheet developments and financial performance is presented in Sections 2 and 3, respectively. A discussion of their financial soundness is set out in Section 4, followed by an evaluation of the pattern of sectoral deployment of credit in Section 5. Sections 6 to 11 deal with themes relating to ownership patterns, corporate governance and compensation practices, foreign banks’ operations in India and overseas operations of Indian banks, developments in payments systems, consumer protection and financial inclusion. Specific issues pertaining to regional rural banks (RRBs), local area banks (LABs), small finance banks (SFBs) and payments banks (PBs) are examined in Sections 12 to 15 individually. Section 16 concludes the chapter by highlighting major issues emerging from the analysis and provides some perspectives on the way forward. IV.3 The consolidated balance sheet of scheduled commercial banks (SCBs) registered double digit growth in 2021-22, after a gap of seven years (Chart IV.1). Deposit growth moderated from the COVID-19-induced precautionary surge a year ago. A rebound in borrowings after a two year hiatus shored up the liabilities side. On the asset side, the main development was the strengthening of the credit pick-up through the year. Concomitantly, investments moderated. 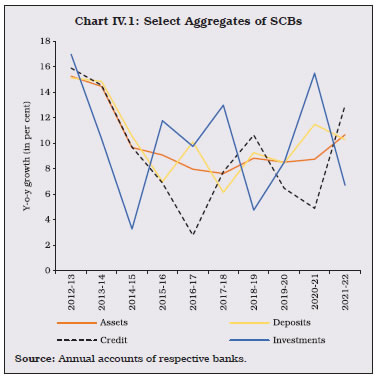 IV.4 Despite some recent moderation, public sector banks (PSBs) still have the lion’s share in the consolidated balance sheet. At end-March 2022, they accounted for 62 per cent of total outstanding deposits and 58 per cent of total loans and advances extended by SCBs (Table IV.1).
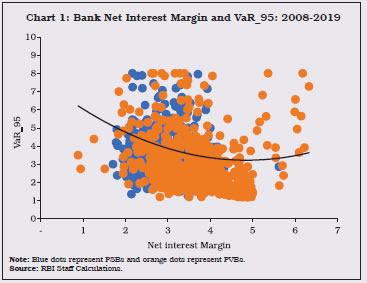
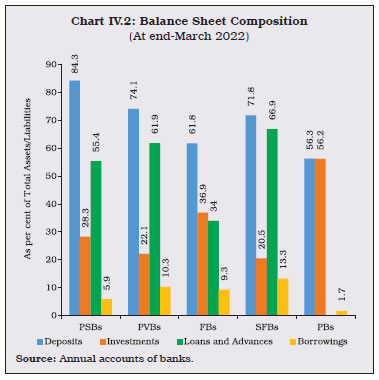 IV.5 A closer look into the balance sheet composition across bank groups highlights their operational idiosyncracies. The deposit funding ratio, defined as the share of deposits in total liabilities, is higher for PSBs than for private sector banks (PVBs). This suggests that the latter resort to borrowings to fuel credit growth. Furthermore, while the loans-to-assets ratio of PSBs has historically remained lower than PVBs, the investments-to-assets ratio of the former has remained higher, reflective of high investments in risk-free government securities (Chart IV.2). 2.1. Liabilities IV.6 Household financial saving rates declined to a 5-year low in 2021-22, which was also reflected in subdued deposit growth (Chart IV.3a). The transmission of the 190 basis points (bps) increase in the repo rate during May-October 2022 to deposit rates is likely to provide a fillip to deposit growth rates (Chart IV.3b). IV.7 Borrowings of SCBs accelerated in 2021-22, as deposit growth did not keep pace with credit offtake (Chart IV.4). This, combined with the higher statutory reserve requirements1 that involved withdrawal of durable liquidity from the system, propelled borrowings by PVBs and foreign banks (FBs). 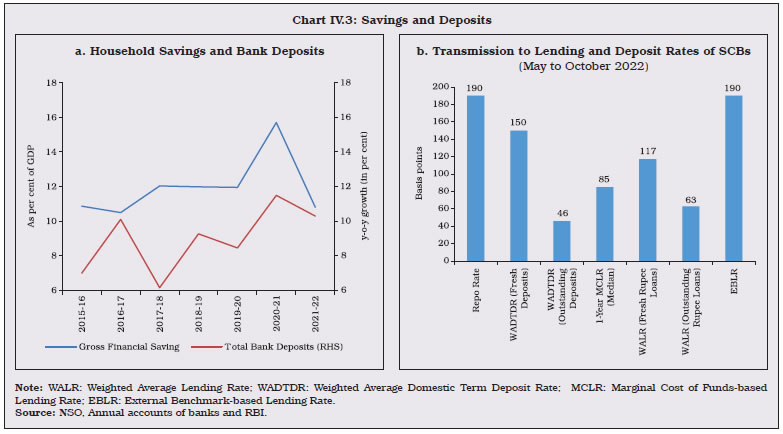 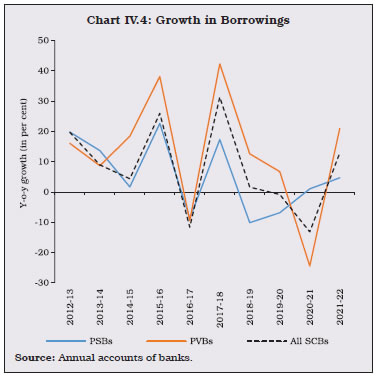 2.2. Assets IV.8 Credit growth accelerated to a ten-year high at end-September 2022, led by PVBs (Chart IV.5a). Both working capital and term loans, which were decelerating since Q4:2018-19, showed steady growth during 2021-22. Around 75 per cent of incremental credit during the year was in the form of term lending, which grew at a 10-quarter high pace (Chart IV.5b). IV.9 Historically, metropolitan areas have garnered the largest share of incremental credit. In the aftermath of the COVID-19 lockdowns, however, their share declined to 20 per cent by end-March 2021 on higher credit flows to rural and semi-urban areas. Subsequently, as credit flows revived, metropolitan areas regained their share (Chart IV.6). IV.10 Around 80 per cent of SCBs’ investments are in government securities (G-secs) and the overall G-sec holdings of banks are impacted by factors such as credit demand conditions, demand-supply dynamics of G-secs and interest rate cycle. Special dispensation of enhanced HTM limits for statutory liquidity ratio (SLR) eligible securities has ensured greater headroom for banks to invest in such securities3. Reflecting a confluence of these factors, SLR investments of SCBs increased across all bank groups (Table IV.2). 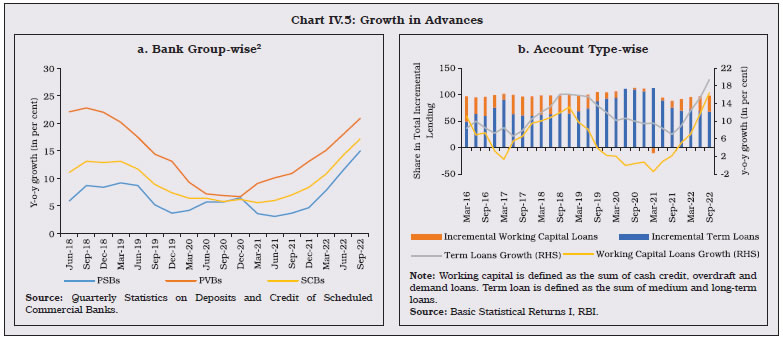 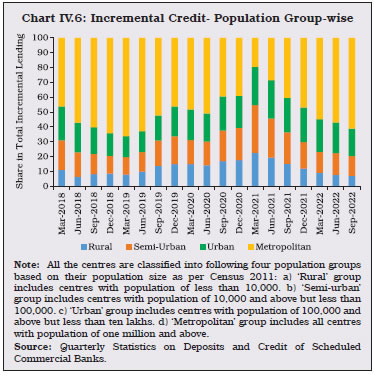 IV.11 During 2021-22, as credit growth picked up and deposit growth moderated, the incremental credit-deposit (C-D) ratio reached a four-year high. As investments decelerated, the incremental investment-deposit (I-D) ratio declined (Chart IV.7). Going forward, fuller transmission of increased policy interest rate to deposit rates is likely to augment deposit flows to meet credit demand. 2.3. Maturity Profile of Assets and Liabilities IV.12 Maturity transformation is the essence of banking business, and asset-liability maturity mismatches are inevitable as banks extend longer-term loans against short-term deposits. During 2021-22, however, the maturity mismatch moderated across all durations in comparison with the previous year, reflecting improvements in asset-liability management (Chart IV.8). IV.13 Banks, especially from the private sector, ramped up short-term borrowings4 in 2021-22, taking advantage of low interest rates in that year. The investment portfolio of PVBs and FBs is concentrated in the short-term category, indicative of active investment risk management by these banks (Table IV.3). 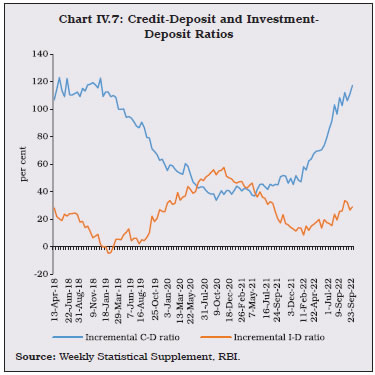 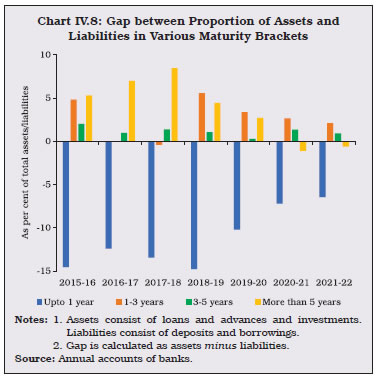 2.4. International Liabilities and Assets IV.14 During 2021-22, international liabilities of Indian banks, especially non-resident ordinary (NRO) rupee accounts and foreign currency borrowings, rose substantially, encouraged by interest rate differentials in favour of India (Appendix Table IV.2). On the other hand, an increase in international assets was led by loans and deposits and holding of debt securities. Loans to non-residents declined relative to a year ago, while foreign currency loans to residents and NOSTRO balances increased (Appendix Table IV.3). Reflecting these factors, the international assets to liabilities ratio of Indian banks has been increasing for three consecutive years (Chart IV.9a). IV.15 During the period under review, the share of international claims of Indian banks i.e., assets held abroad by domestic as well as foreign branches of Indian banks, excluding FBs, shifted towards short-term maturities and moved away from non-financial private institutions towards banks (Appendix Table IV.4 and Chart IV.9b). Banks’ country composition of international claims underwent geographical changes favouring the United States (U.S.) and the United Kingdom (U.K.) (Appendix Table IV.5). 2.5. Off-Balance Sheet Operations IV.16 Contingent liabilities’ growth of all SCBs crossed 23 per cent – the highest in 11 years – led by growth in forward exchange contracts, and acceptances and endorsements (Chart IV.10a). As a proportion of balance sheet size, contingent liabilities increased from 119 per cent in 2020-21 to 133 per cent in 2021-22 (Appendix Table IV.6). FBs’ contingent liabilities are more than 10 times their balance sheet size and constitute about half of the banking system’s total off-balance sheet exposures (Chart IV.10b). Their non-interest income, however, has not increased commensurately. 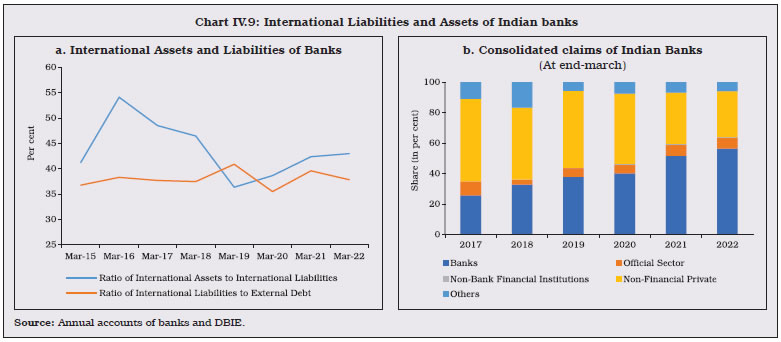 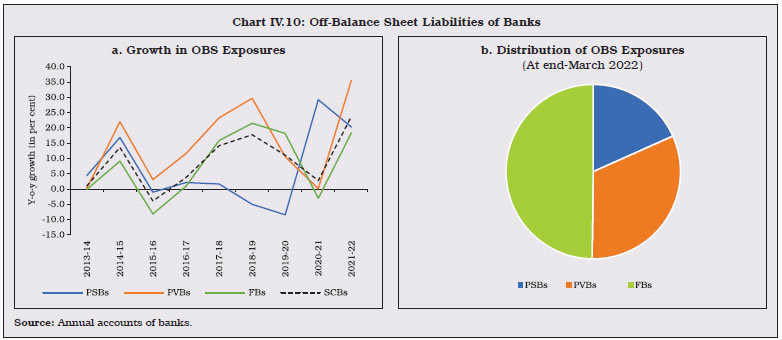 IV.17 With greater transparency in asset recognition and stronger capital and provision buffers, banks faced the pandemic on a stronger footing. Enhanced credit monitoring processes, coupled with portfolio diversification, helped arrest slippages and strengthened their balance sheets. Accordingly, the pr ofitability of SCBs, measured in terms of return on equity and return on assets (RoA), improved to levels last observed in 2014-15 (Chart IV.11). IV.18 Robust bank profitability is an indicator of a healthy financial system, which augurs well for financial stability. An alternative view is that high profitability could loosen leverage constraints and lead to more risk-taking5. Empirical estimates for India suggest the existence of a threshold beyond which higher bank profitability may be detrimental to financial stability (Box IV.1). The net interest margin (NIM) of SCBs at 2.9 per cent at end-March 2022 remained much below the threshold. 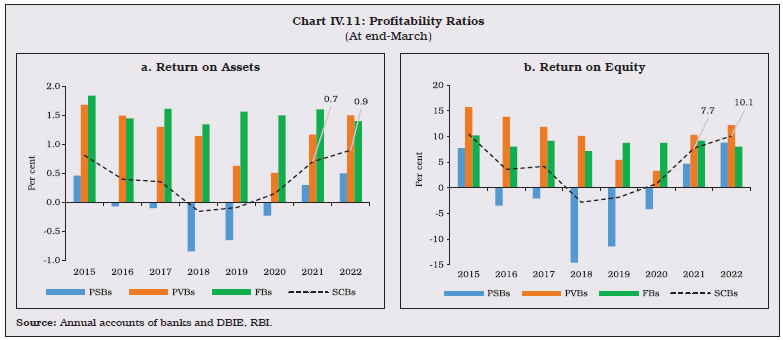
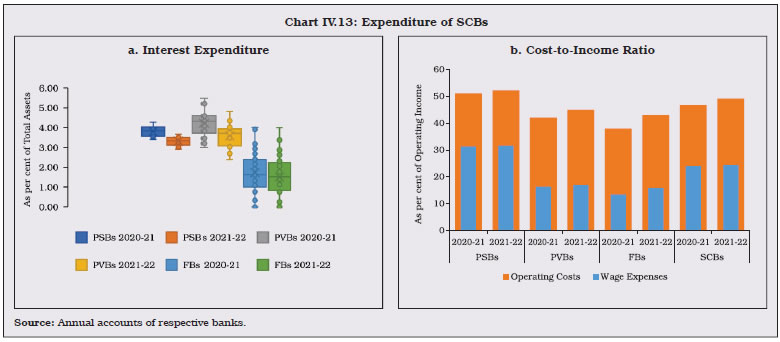
IV.19 Higher profits during 2021-22 were contributed by acceleration in income and contraction in expenditure (Table IV.4). Interest income, which forms 84 per cent of SCBs’ total income, reversed the contraction experienced a year ago. Higher lending and investment volumes led to higher interest income from these channels, notwithstanding then prevailing lower interest rates. Expenditure contracted, aided by decline in interest expended and lower provisions and contingencies. IV.20 Typically, an inverse relationship between G-sec yields and the non-interest income of banks is observed in India (Chart IV.12). The other income of PSBs and FBs declined during the year, partly reflecting trading losses on their investment portfolios. In contrast, the increase in other income of PVBs was mainly contributed by acceleration in commission and brokerage income that forms more than 60 per cent of non-interest income. IV.21 Ongoing synchronised monetary policy actions across the world may have an asymmetric impact on various components of bank profitability viz, net interest income, non-interest income and loan loss provisions. An increase in interest rate can lead to a rise in net interest income. On the other hand, as banks suffer trading losses on their treasury investments when yields go up, their non-interest income may suffer. Increased provisioning on these losses as well as for NPAs could further erode profitability. The net impact of monetary policy on banks’ profitability is thus an empirical issue (Box IV.2). 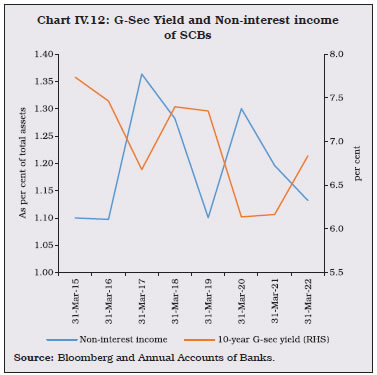 IV.22 The contraction in total expenditure of SCBs was led by interest expenditure, which declined due to low deposit rates. As deposits form a relatively small portion of FBs’ balance sheet, their interest outgo as per cent of total assets is lower than that of the other two bank groups (Chart IV.13 a). On the other hand, the cost-to-income ratio, which is the ratio of operating expenses to operating income, was the highest for PSBs, owing to their high wage expenditure (Chart IV.13 b). IV.23 As banks were required to maintain higher provisions on loans which were granted moratorium during the pandemic, their net profits were adversely affected in 2019-20 and 2020-21. During 2021-22, a reduction in provisions, inter alia, boosted banks’ net profits (Chart IV.14 a). Moreover, as the GNPAs declined, the provision coverage ratio surged (Chart IV.14 b).
 IV.24 As the reduction in return on funds was slightly higher than the reduction in cost of funds, the spread declined marginally. The cost of deposits went down across the board as the share of current and savings account (CASA) deposits in total deposits increased. At end-March 2022, 44 per cent of SCBs’ outstanding floating rate rupee loans were at external benchmark linked lending rates (EBLRs). The comparable positions for PSBs and PVBs were 33 per cent and 62 per cent, respectively. The return on advances decreased, primarily due to re-pricing of existing floating rate loans at the then prevailing lower rates as also incremental lending at lower rates (Table IV.5). 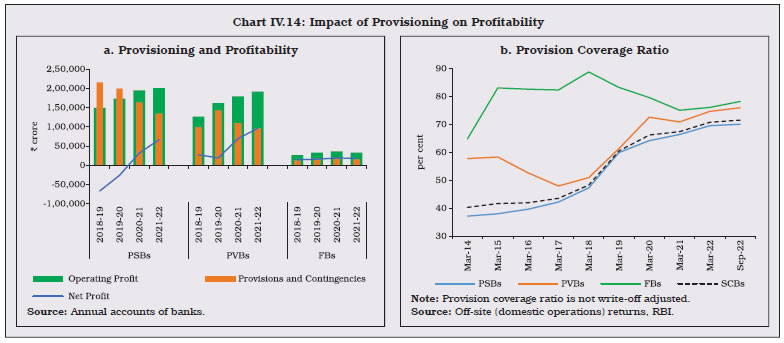 IV.25 During 2021-22, SCBs’ capital position, asset quality and leverage ratios improved, and liquidity position remained robust. The number of banks under the Reserve Bank’s prompt corrective action (PCA) framework reduced from three at end-March 2021 to one at end-March 2022. At end-September 2022, there was no bank under the PCA framework. 4.1. Capital Adequacy IV.26 The capital to risk-weighted assets ratio (CRAR) of SCBs has been rising sequentially in the post-asset quality review (AQR) period (Table IV.6). This increase kept pace during 2021-22, despite growth in risk-weighted assets (RWAs). Since 2016, the growth in RWAs has remained lower than the overall assets growth, signifying a move towards safer assets (Chart IV.15). Around 92 per cent of increase in the capital funds was contributed by increase in Tier-I capital of banks, indicative of robustness of capital buffers. At end-September 2022, the CRAR of SCBs stood at 16 per cent. 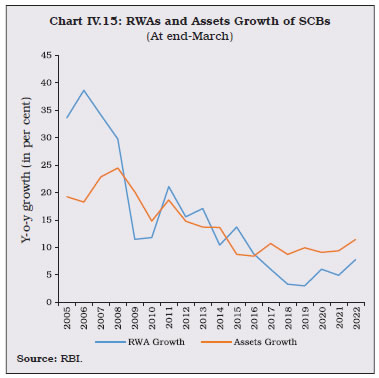 IV.27 With activation of the last tranche in October 2021, the total capital conservation buffer (CCB) to be maintained by banks increased to 2.5 per cent, thereby raising the total minimum capital requirement to 11.5 per cent. At end-March 2022, all banks met this regulatory minimum as also the CET-1 ratio requirement of 8 per cent (Chart IV.16). IV.28 Resource mobilisation by banks through private placements, which had accelerated in 2020-21, slowed during 2021-22. Although the number of issues tripled for PVBs in 2021-22, the total amount raised increased by only 5 per cent. The majority of the resources mobilised by PVBs through private placements in 2021-22 were via bonds/debentures, while during 2020-21, it was entirely via equity issuances (Table IV.7). 4.2. Leverage and Liquidity IV.29 The leverage ratio (LR), calculated as the ratio of tier-I capital to total exposures, serves as a backstop to risk-weighted capital requirements. It is required to be maintained at a minimum of 4 per cent and 3.5 per cent for domestic systemically important banks and other banks, respectively. At end-March 2022, all bank groups met the stipulated minimum requirement ratio. PVBs and FBs maintained LR much above the required levels. 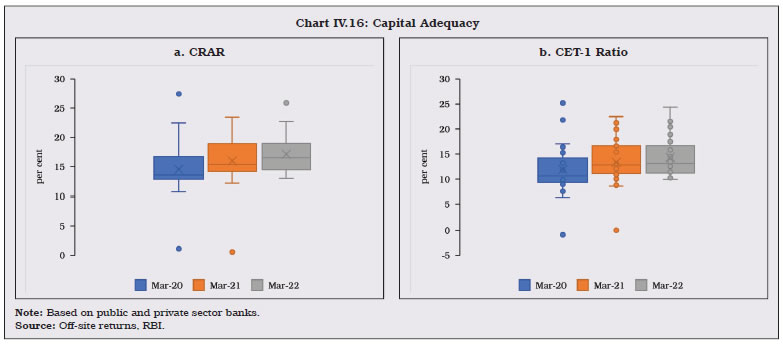 IV.30 The liquidity coverage ratio (LCR) stipulates that banks should maintain high quality liquid assets (HQLAs) to meet 30 days’ net cash outflows under stressed conditions. Although all the bank groups met the Basel requirement of 100 per cent LCR at end-March 2022, the ratio was lower than a year ago (Chart IV.17). 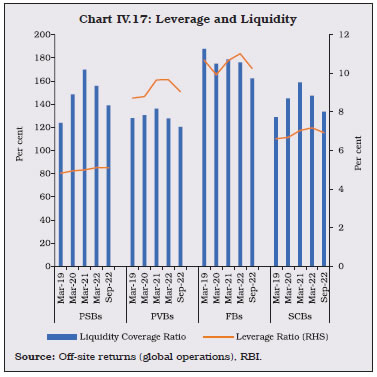 IV.31 The net stable funding ratio (NSFR) – the ratio of available stable funding to the required stable funding – is a measure of a sustainable finance structure. Implementation of the NSFR, which was halted during the COVID-19 pandemic, was made effective October 1, 2021. With this, banks are required to maintain NSFR at a minimum of 100 per cent, which was met by all bank groups at end-March 2022 (Table IV.8). 4.3. Non-Performing Assets IV.32 NPAs adversely affect credit deployment, banks’ profitability through increased provisioning, and impinge on their capital, apart from entailing recovery costs. F rom its peak in 2017-18, the GNPA ratio of SCBs has been declining sequentially to reach 5 per cent at end- September 2022. This decrease was led by lower slippages as well as reduction in outstanding GNPAs through recoveries, upgradations and write-offs (Chart IV.18). 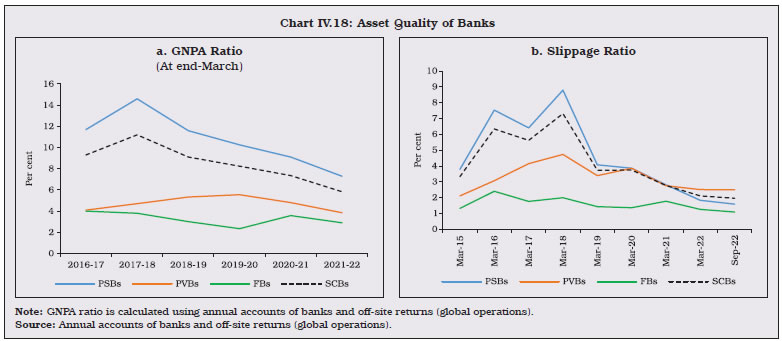 IV.33 In 2021-22, the reduction in NPAs was mainly contributed by written-off loans in the case of PSBs, while upgradation of loans was the primary driver for asset quality improvement for PVBs (Chart IV.19). 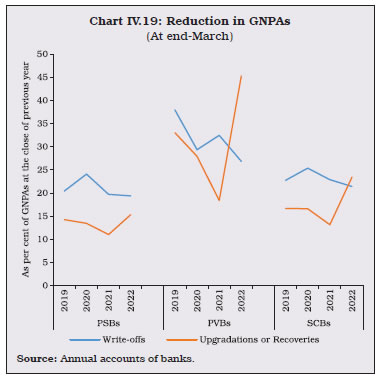 IV.34 Taking into account the global operations of banks, asset quality improved across the board for all bank groups. Lower GNPAs, combined with high provisions accumulated in recent years, contributed to a decline in net NPAs (Table IV.9). IV.35 As far as banks’ domestic operations are concerned, the proportion of standard assets to total advances increased and there was an overall reduction in GNPAs for all bank groups, except in case of FBs, during 2021-22 (Table IV.10). IV.36 Large borrowal accounts i.e., accounts with a total exposure of ₹5 crore and above, comprised 47.8 per cent of total advances in 2021-22, down from 48.4 per cent in 2020-21. Their share in total NPAs declined during the year to 63.4 per cent from 66.4 per cent in 2020-21. The special mention accounts-0 (SMA-0) ratio, which is the proportion of loan accounts that were overdue for 0-30 days, shot up for overall as well as large borrowal accounts for both bank groups (PSBs and PVBs) at end-March 2022 pointing towards temporary stress among borrowers (Chart IV.20). SMA-1 and SMA-2, which indicate impending stress for longer time buckets, declined to their lowest levels since end-March 2016 for all accounts. IV.37 In response to COVID-19, the Reserve Bank announced inter alia two restructuring schemes. In August 2020, the Reserve Bank announced resolution framework 1.0, which was largely aimed at corporate exposures and personal loans facing COVID-19 related stress. The framework had a deadline of December 31, 2020 for invocation. A scheme for resolution of micro, small and medium enterprises (MSMEs) was already operational since 2019. Resolution framework 2.0 announced in May 2021 and subsequently revised in June 2021, was aimed specifically at MSMEs, individual borrowers and small businesses which had a deadline of September 30, 2021 for invocation. These frameworks were designed with sufficient safeguards, which helped in avoiding restructuring of inherently weak accounts. 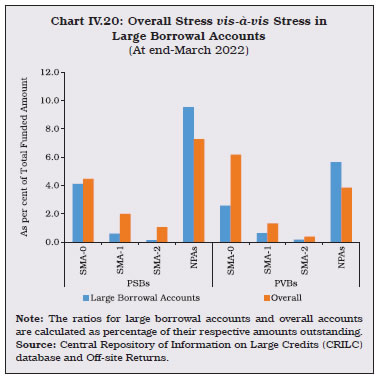 IV.38 The impact of these schemes could be gauged through the restructured standard advances (RSA) ratio, which is the share of RSA in total gross loans and advances. During 2020-21, the RSA ratio increased by 0.3 percentage points for all the borrowers taken together, while the comparative increase for large borrowers was 0.4 percentage points. In contrast, during 2021-22, the ratio increased by 1.1 percentage points for all the borrowers and by 0.5 percentage points for large borrowers (Chart IV.21a). The higher order of increase in the RSA ratio of all borrowers in 2021-22 may indicate that the objective of the Reserve Bank’s resolution framework 2.0, i.e., of aiding retail loans and MSMEs in dealing with COVID-related stress, was largely successful. IV.39 The number of accounts restructured by PVBs through both resolution frameworks 1.0 as well as 2.0 grew multi-fold, albeit on a low base. In contrast, PSBs had restructured fewer accounts under resolution framework 1.0 but they picked up steam in resolution framework 2.0 (Chart IV.21b). The differential behaviour of PSBs vis-à-vis PVBs may be reflective of the former’s legacy of stress in large borrowal accounts. 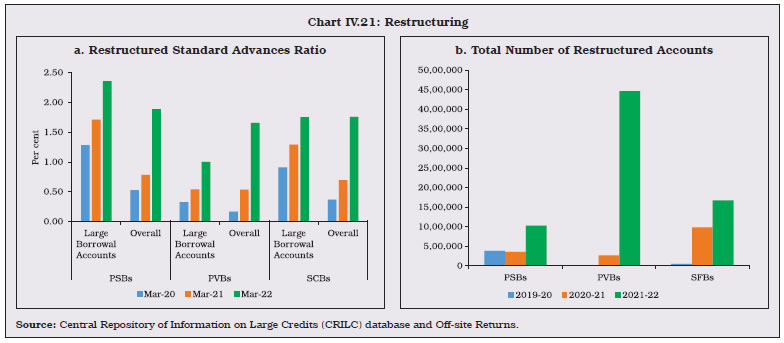 4.4. Recoveries IV.40 Banks have multiple channels through which stressed assets can be resolved. As fresh insolvency cases could be admitted after the one-year suspension during COVID-19, admissions under the IBC increased by 65 per cent during 2021-22. Although the number of cases referred under Lok Adalats and SARFAESI Act increased by 336 per cent and 335 per cent, respectively, the IBC mechanism was the leader in terms of amount involved (Table IV.11). Defying the lull in the interim years, SARFAESI and DRTs yielded recovery rates comparable to the IBC mechanism. The pre-pack insolvency resolution process, introduced for MSMEs in April 2021, is yet to gain traction and only two cases have been admitted under the channel so far (up to September 2022). IV.41 Sales of stressed assets to asset reconstruction companies (ARCs) is another mode of their resolution. However, sales to ARCs have gradually decreased over the years, and in 2021-22, only 3.2 per cent of the previous year’s GNPAs were sold to ARCs (Chart IV.22a). The ratio of acquisition cost to book value increased marginally, denoting slightly higher recovery rates for the selling banks (Chart IV.22b). IV.42 Although the Reserve Bank has been disincentivising banks from holding excess security receipts (SRs) through increased provisioning, the share of SRs subscribed by banks in total SRs issued increased to 68 per cent in 2021-22. Further, the share of ARCs also increased to 18.1 per cent from 17.5 per cent a year ago. Redemption of SRs issued by ARCs, which is an indicator of recovery through this mode, increased during the year, resulting in a decline in the total SRs outstanding (Table IV.12). 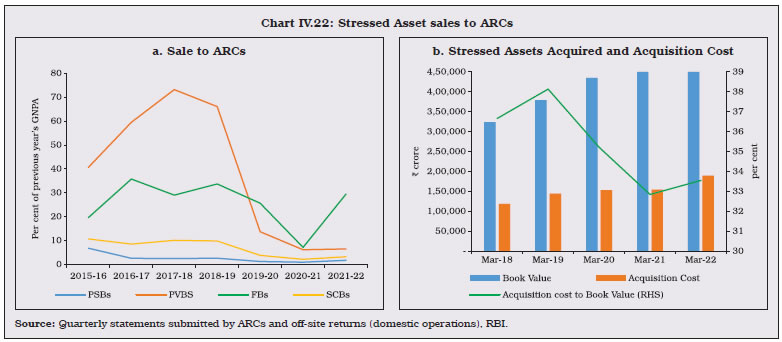 4.5. Frauds in the Banking Sector IV.43 Banking frauds have implications for financial stability as they are a source of reputational, operational and business risk, along with endangering customers’ trust in the system. During 2021-22, the average amount of fraud10 decreased substantially (Table IV.13). IV.44 Based on the date of occurrence of frauds, advances-related frauds formed the biggest category prior to 2019-20. Subsequently, however, in terms of number of frauds, the modus operandi shifted to card or internet-based transactions. Additionally, cash frauds are also on the rise (Table IV.14). IV.45 The number of fraud cases reported by PVBs outnumbered those by PSBs for the second consecutive year in 2021-22. In terms of the amount involved, however, the share of PSBs was 66.7 per cent in 2021-22, as compared with 59.4 per cent in the previous year (Chart IV.23). 4.6. Enforcement Actions IV.46 During 2021-22, the major reasons for imposition of monetary penalties on regulated entities (REs) included, inter alia, non-compliance with exposure and IRAC norms, frauds classification and reporting, and violation of cyber security framework guidelines. During the year, the average per instance penalty was the highest for PVBs and was the lowest for co-operative banks (Table IV.15). 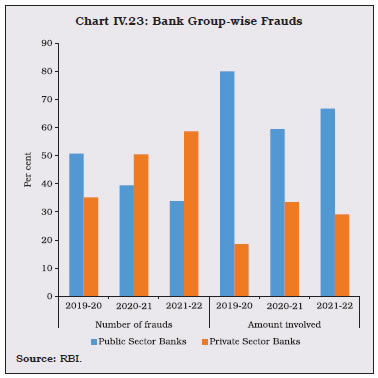 5. Sectoral Bank Credit: Distribution and NPAs IV.47 The sharp acceleration in credit growth during 2021-22 was led by services and retail loans, especially housing. Credit flows to the services sector revived from a contraction in the previous year. The recovery was broad-based, encompassing contact-intensive segments as well as commercial real estate and computer software (Table IV.16). 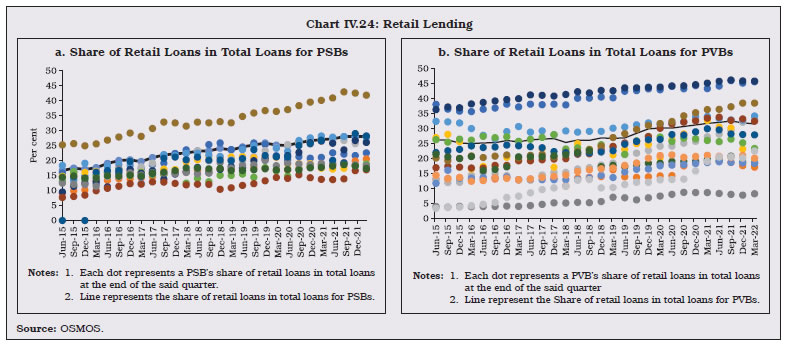 IV.48 Credit to industry grew at the highest rate in 8 years. In incremental terms, 21 per cent of the credit went to the industrial sector during the year as against 0.2 per cent in 2020-21. 5.1. Retail Credit IV.49 In recent years, Indian banks appear to have displayed ‘herding behaviour’ in diverting lending away from the industrial sector towards retail loans (Chart IV.24 a and b). The decline was evident across banks groups. IV.50 Empirical evidence suggests that a build-up of concentration in retail loans may become a source of systemic risk. The Reserve Bank is equipped with its policy toolkit to handle any systemic risk that may arise (Box IV.3).
IV.51 During 2021-22, credit to the housing sector accelerated, led by PVBs (Chart IV.25a), amid low and declining GNPA ratios (Chart IV.25b). IV.52 The education loans of SCBs had been decelerating since March 2016 against the backdrop of high NPAs in this sector. The share of education loans in total retail lending has fallen. In 2021-22, however, credit to this sector revived, albeit on a low base. In the case of PVBs, credit growth reflected declining GNPA ratios (Chart IV.26). 5.2. Credit to the MSME Sector IV.53 In the post-COVID period, credit growth to MSMEs in the industrial sector was distinctly higher on a year-on-year basis, as well as in comparison with credit growth to large industries (Chart IV.27a). Incentives provided by the Emergency Credit Line Guarantee Scheme (ECLGS), coupled with lower GNPA ratios, helped in boosting credit to MSMEs (Chart IV.27b). At the same time, addition of wholesale and retail trade in the MSME category since July 2021 also helped boost the overall credit to the MSME sector. 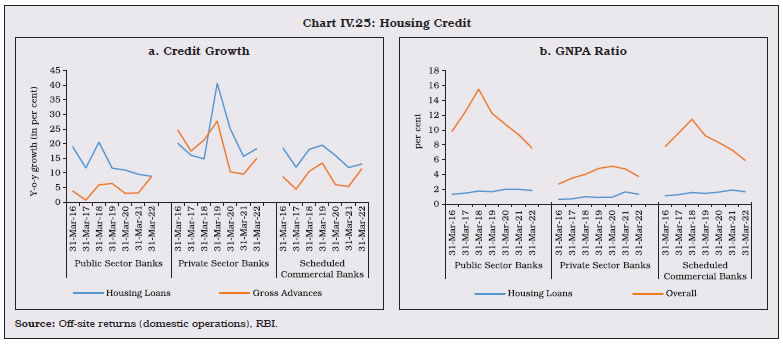 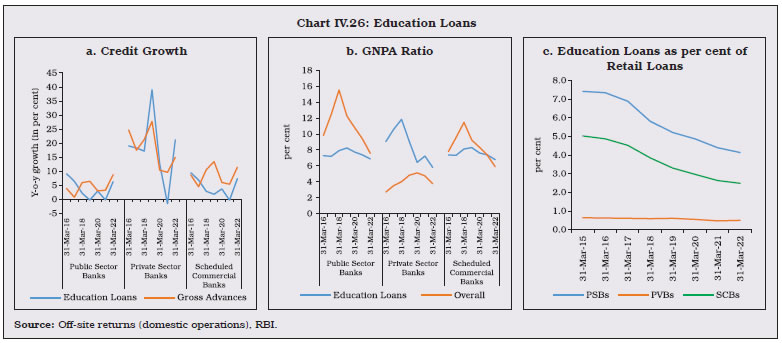 IV.54 Since 2018-19, MSME credit growth by PVBs has far exceeded that by PSBs. As a result, the share of the former in outstanding credit increased in 2021-22 as well (Table IV.17). 5.3. Priority Sector Credit IV.55 During 2021-22, outstanding priority sector advances grew at 12.34 per cent. All bank groups managed to meet their overall priority sector lending targets, while FBs and SFBs also achieved all the sectoral targets. PSBs fell short of achieving their target only in the micro enterprises category. PVBs, on the other hand, fulfilled their target only for micro enterprises (Table IV.18). After growing at only 1.3 per cent in 2020-21, the amount outstanding under operative kisan credit cards (KCCs) grew by 24.5 per cent during 2021-22, mainly contributed by the southern region – especially, Karnataka (Appendix Table IV.7). 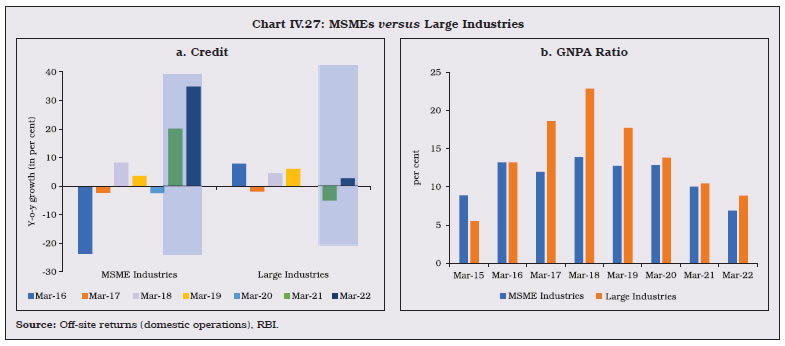 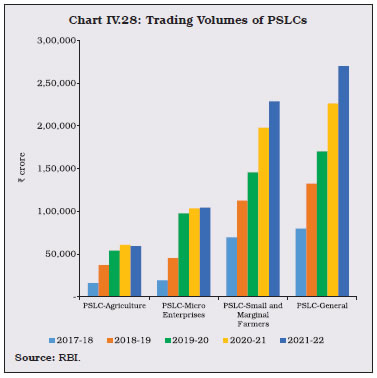 IV.56 The total trading volume of the priority sector lending certificates (PSLCs) registered a growth of 12.43 per cent and stood at ₹6,62,389 crore in 2021-22. Amongst the four PSLC categories, the highest trading was observed in PSLC-General and PSLC-Small and Marginal Farmers (SF/MF) (Chart IV.28). IV.57 In 2021-22, weighted average premiums (WAPs) increased across the board for all categories of PSLCs, except PSLC-A, with PSL-CSF/MF commanding the highest premium (Table IV.19). IV.58 Although the share of priority sector loans in total loans increased marginally from 35.3 per cent in 2020-21 to 35.8 per cent in 2021-22, their share in total GNPAs increased from 40.4 per cent to 43.1 per cent, led by defaults in the agricultural sector. While SFBs extend 76 per cent of their loans to the priority sector, close to 88 per cent of their NPAs originate from this portfolio. On the other hand, a disproportionately lower share of NPAs resulted from the priority sector for PVBs (Table IV.20). 5.4. Credit to Sensitive Sectors IV.59 The real estate sector constituted 95 per cent of SCBs’ lending to sensitive sectors at end-March 2022. As real estate market activity gained traction after a lull during the COVID period, lending to it also picked up, led by PVBs (Chart IV.29a). PSBs’ lending to capital market, which was subdued since 2017-18, picked up during the year, partly reflecting the buoyant equity market (Chart IV.29b and Appendix Table IV.8). 5.5. Unsecured lending IV.60 Unsecured lending — characterised by lack of collateral — presents a higher credit risk for banks, attracting greater provisions and risk weights. The share of unsecured credit in total credit has been increasing since 2015, largely due to the higher interest earnings of banks from such loans (Chart IV.30). 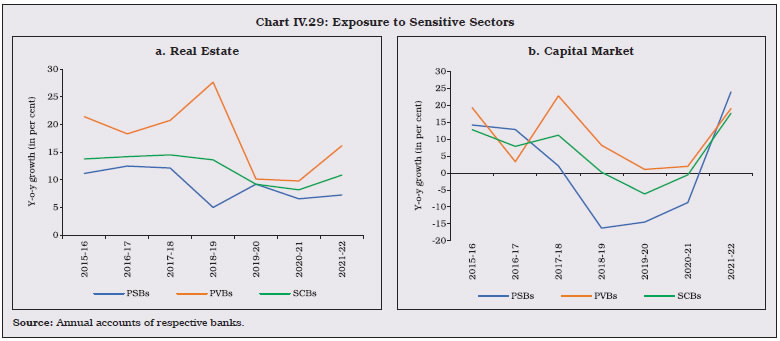 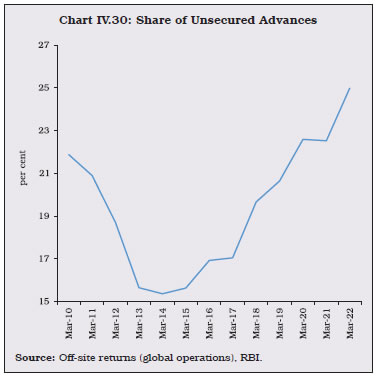 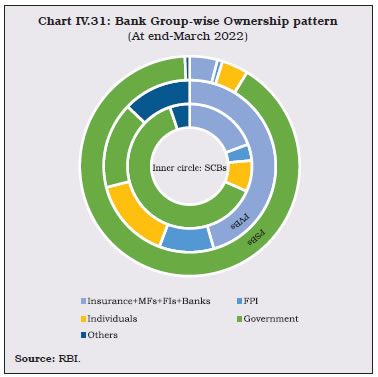 6. Ownership Pattern in Commercial Banks12 IV.61 The ownership pattern of PSBs and PVBs has been documented as an important idiosyncratic factor influencing their operations (Chavan and Gambacorta, 2016)13. PVBs have a more diversified ownership as compared with their public sector counterparts (Chart IV.31). IV.62 The government’s shareholding in PSBs declined during 2021-22 due to fresh equity issuances by Bank of India, Bank of Maharashtra, Canara Bank, Indian Bank, Punjab National Bank and Union Bank of India (Chart IV.32). Non-residents’ shareholding was within the limits of 74 per cent for PVBs, LABs and SFBs, and 20 per cent for PSBs (Appendix Table IV.9). 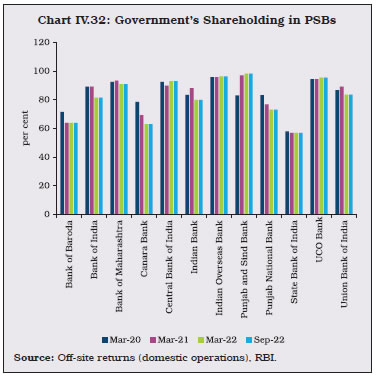 IV.63 Failures and weaknesses in corporate governance, especially in large financial institutions, was one of the important factors that contributed to the global financial crisis. Employees were often rewarded for increasing short-term profit without adequate recognition of the risks and long-term consequences. Compensation has, therefore, been at the centre stage of regulatory reforms. 7.1. Executive Compensation IV.64 The revised guidelines14 on compensation require the target variable pay (VP) component of the total pay to be in the range of 50 per cent to 75 per cent and the cash component of target VP to be between 33 per cent and 50 per cent15. Incidentally, actual VP16 for PVBs increased from 16 per cent of total remuneration (TR) at end-March 2020 to 31 per cent at end-March 2021. For SFBs, on the other hand, it has remained constant at around 25 per cent during the same period (Chart IV.33). For PVBs, the share of the cash component of VP reduced from 31 per cent at end-March 2020 to 22 per cent at end-March 2021 and for SFBs from 65 per cent to 59 per cent during the same period. The guidelines also require that a minimum of 60 per cent of the total VP must invariably be under deferral arrangements. In line with these revised guidelines, the deferred component of the performance linked pay of the MD and CEO increased from 41 per cent to 82 per cent for PVBs and from 22 per cent to 65 per cent for SFBs. 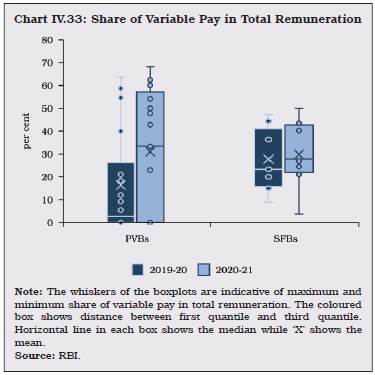 IV.65 The remuneration paid to the MD and CEO of a bank in comparison to the average employee pay varies across bank groups. At end-March 2021, for PVBs, on an average, CEOs earned 73 times the average employee remuneration, while in SFBs, CEOs earned 76 times the average employee. This was much higher than any of the PSBs, where on an average, CEOs earned 2.2 times the average employee remuneration (Chart IV.34). 7.2. Composition of Boards IV.66 The presence of independent directors on the board is considered necessary for objective decision making and for protecting interests of minority shareholders. Instructions on corporate governance issued by the Reserve Bank on April 26, 202117 mandate inter alia that at least half of the directors attending the meetings of the board shall be independent directors. The proportion of independent directors on the board of PVBs increased from 59 per cent at end-March 2021 to 63 per cent at end-March 2022. Similarly, the proportion of independent directors in the Risk Management Committee of the Board (RMCB) and Nomination and Remuneration Committee (NRC) also increased (Table IV.21). 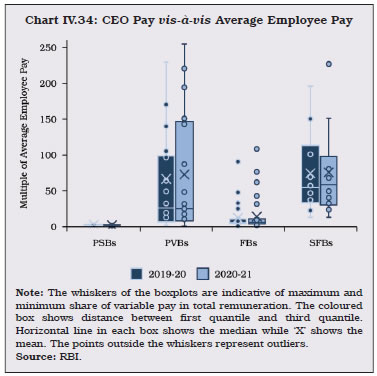 IV.67 As per the Reserve Bank’s directions, the board is required to constitute an RMCB with a majority of non-executive directors (NED). The chair of the board may be a member of the RMCB only if he / she has the requisite risk management expertise. The proportion of PVBs where the chair is not a member of the RMCB increased from 29 per cent at end-March 2021 to 39 per cent at end-March 2022. In SFBs, the proportion increased from 40 per cent to 50 per cent during the same period. Around 10 per cent of the PVBs at end-March 2021 did not have any management presence18 in the RMCB and the proportion remained unchanged at end-March 2022. For SFBs, however, there was a marginal increase from 30 per cent to 33 per cent. 8. Foreign Banks’ Operations in India and Overseas Operations of Indian Banks IV.68 During 2021-22, the number of foreign banks (FBs) operating in the country remained unchanged; however, the number of branches decreased (Table IV.22). PSBs reduced their overseas presence so as to rationalise their operations and improve cost efficiency by shutting down less profitable operations. Indian PVBs, however, increased their overseas presence by opening more representative offices during the year (Appendix Table IV.10). 9. Payment Systems and Scheduled Commercial Banks IV.69 The payments landscape across the world is evolving at a rapid pace, with the introduction of various innovative payment systems and instruments. The Indian payments ecosystem has emerged as a world leader with the availability of a plethora of payment systems, platforms, payment products and services catering to the various needs of consumers. This has been supported by the launch and acceptance of new modes of payment in the retail payment segment. IV.70 An exercise to benchmark India’s payment systems was undertaken in 2019 to ascertain its strengths and shortcomings and a follow-on exercise was conducted in 2022. The latest assessment showed that despite some challenges, the growth of Indian payment systems remained robust during the COVID-19 pandemic. India was categorised as ‘leader’ in 16 out of 40 indicators when compared with 20 other jurisdictions. Since the last exercise, India demonstrated progress in large value payment systems, fast payment systems, digital payment options available for bill payments, available channels for cross-border remittances and decline in cheque usage. The exercise highlighted that there is a scope for improvement in acceptance infrastructure i.e. ATMs and point of sale (PoS) terminals. The Payment Infrastructure Development Fund scheme was operationalised in 2021 to enhance the acceptance infrastructure and bridge the gap. 9.1. Digital Payments IV.71 Digital modes of payments have grown by leaps and bounds over the last few years. As a result, conventional paper-based instruments such as cheques and demand drafts now constitute a negligible share in both volume and value of payments (Chart IV.35). IV.72 The COVID-19 related lockdowns and restrictions on public movement, coupled with the sharp contraction in GDP, had an adverse impact on the growth of both value and volume of payment instruments in 2020-21. The volume of total payments accelerated by 63.8 per cent during 2021-22 from 26.6 per cent in 2020-21, with 99 per cent of total payments being done through digital modes. In terms of value, total payments grew by 23.1 per cent, reflecting a pickup in economic activity (Table IV.23). Almost all the digital instruments have surpassed the levels seen at end-March 2020, however, RTGS transactions still lag behind. 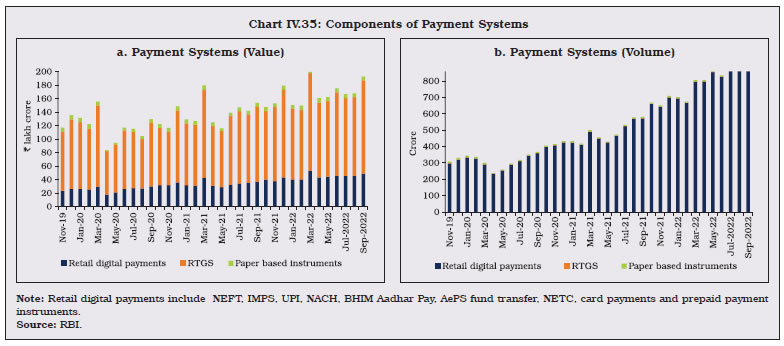 IV.73 The Reserve Bank launched a composite Digital Payments Index (DPI) in January 2021 to effectively capture the extent of digitisation of payments across the country. The index is based on five broad parameters – payment enablers; payment infrastructure - demand side factors; payment infrastructure - supply side factors; payment performance; and consumer centricity, and is computed semi-annually with March 2018 as the base. The RBI-DPI score has demonstrated significant growth representing the rapid adoption and deepening of various digital payments modes across the country in recent years. The index grew by 29.1 per cent in March 2022 over the previous year (Chart IV.36). 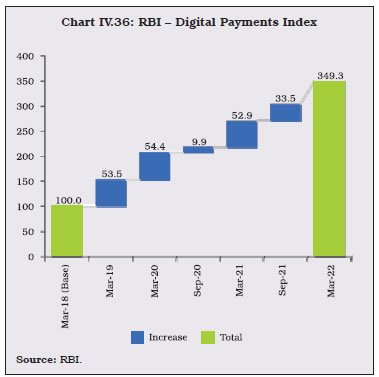 IV.74 The Bharat Bill Payment System (BBPS) is an interoperable platform for bill payments operated by National Payments Corporation of India Bharat Bill Pay Limited, guidelines for which were issued by the Reserve Bank in 2014. Users of BBPS enjoy benefits like standardised bill payment experience, centralised customer grievance redressal mechanism and prescribed customer convenience fee. The scope and coverage of BBPS initially covered five categories of billers viz., direct to home (DTH), electricity, gas, telecom, and water. The scope was expanded subsequently to include all categories of billers that raise recurring bills as eligible participants on a voluntary basis. The BBPS ecosystem has grown from 168 billers and processing of 1.10 crore transactions for value ₹1,900 crore in September 2019 to 20,519 billers and processing of 9.49 crore transactions for value ₹16,585 crore in November 2022. IV.75 At end-November 2022, 43 banks and 10 non-banks participated as Bharat Bill Payment Operating Units (BBPOUs). In May 2022, the minimum net worth requirement for non-bank BBPOUs was reduced from ₹100 crore to ₹25 crore to increase their participation and to align their net worth requirement with that of other non–bank participants in payment systems that handle customer funds and have a similar risk profile. 9.2. ATMs IV.76 At end-March 2022, PSBs and PVBs accounted for 63 per cent and 35 per cent share, respectively, in total ATMs deployed by all SCBs. PVBs as also WLAs spurred the growth of on-site as well as off-site ATMs (Table IV.24 and Appendix Table IV.11). IV.77 At end-March 2022, the share of ATMs in rural areas lagged behind other geographies. While ATMs of PSBs are more evenly distributed, those of other bank groups are skewed towards urban and metropolitan areas (Table IV.25). IV.78 The Reserve Bank has been taking various policy initiatives to improve the grievance redressal mechanism for resolving customer complaints against its REs. With effect from November 12, 2021, the Reserve Bank’s Ombudsman framework was restructured with a ‘One Nation One Ombudsman’ approach and provides cost free centralised redressal of customer complaints while doing away with jurisdictional limitations. This is supplemented by Centralised Receipt and Processing Centre (CRPC) and Contact Centre (CC). IV.79 During the year 2021-22, 4,18,184 complaints were received by the Reserve Bank’s Ombudsmen, an increase of 9.4 per cent19 year-on-year. Close to 98 per cent of complaints were redressed/ disposed and closed as on March 31, 2022. Complaints against REs not covered under the RB-IOS are dealt with by Consumer Education and Protection Cells (CEPCs) across 30 offices of the Reserve Bank. 45,106 complaints were received at CEPCs during the year. The disposal rate20 of CEPCs stood at 98.5 per cent as on March 31, 2022. IV.80 In order to gauge the effectiveness of the functioning of the RB-IOS, including CRPC and CC, the Reserve Bank conducted a pan-India customer satisfaction survey through telephonic interviews. The survey covered more than 4,000 respondents from across the country. More than 60 per cent respondents who had lodged a complaint under both mechanisms viz., one of the erstwhile ombudsman schemes and the current RB-IOS, felt that the overall process under the latter had improved in the first six months of the operationalisation of the scheme. IV.81 The structural changes in the Ombudsman framework make the year-on-year trend in inflow and disposal of complaints at RBIOs non-comparable. However, grievances pertaining to ATM/debit cards, mobile/electronic banking, non-observance of fair practices code and credit cards were the highest in 2021-22 and contributed 51.5 per cent of the total complaints (Table IV.26). IV.82 The share of complaints emanating from urban and metropolitan areas accounted for 73.8 per cent of the total complaints received during 2021-22, indicating higher awareness levels in these areas regarding grievance redressal mechanism of the Reserve Bank (Chart IV.37a). 46 per cent of complaints related to levy of charges without prior notice were filed against PVBs, while 98.2 per cent of complaints related to pension were filed against PSBs – the traditional preference for pensioners (Chart IV.37b and Appendix Table IV.12). IV.83 The deposit insurance system plays an important role in maintaining the stability of the financial system, particularly by safeguarding the interests of small depositors, thereby preserving public confidence. The deposit insurance extended by the Deposit Insurance and Credit Guarantee Corporation (DICGC) covers all commercial banks including LABs, PBs, SFBs, RRBs and co-operative banks. With the current limit of deposit insurance in India at ₹5 lakh, 97.9 per cent of total accounts were fully protected at end-March 2022, as against the international benchmark of 80 per cent. In terms of amount, 49.0 per cent of assessable deposits were covered by insurance, as against the international benchmark21 of 20 to 30 per cent (Table IV.27). 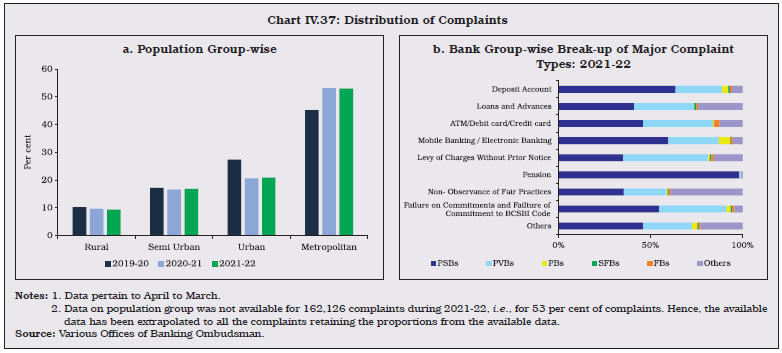 IV.84 The DICGC builds up its Deposit Insurance Fund (DIF) through transfer of its surplus, i.e., excess of income (mainly comprising premium received from insured banks, interest income from investments and cash recovery out of assets of failed banks) over expenditure (payment of claims of depositors and related expenses) each year, net of taxes. The fund is available for settlement of claims of depositors of banks taken into liquidation/amalgamation and stood at ₹1,46,842 crore as on March 31, 2022, yielding a reserve ratio (RR)22 of 1.81 per cent. IV.85 During 2021-22, the corporation settled aggregate claims of ₹8,516.6 crore23 under different channels. This includes the main claims and supplementary claims in respect of 15 urban co-operative banks (UCBs) amounting to ₹1,225.0 crore under Section 17 (1) of the DICGC Act, 1961 and an amount of ₹3,791.6 crore provided to Unity Small Finance Bank (USFB) for making payment to the depositors of the erstwhile Punjab and Maharashtra Co-operative Bank Ltd (PMCBL). This also includes the claims settled of 22 UCBs under All Inclusive Directions (AID) amounting to ₹3,457.4 crore as on March 31, 2022. IV.86 During 2021-22, the DICGC Act, 1961 was amended which facilitated disbursal of depositors’ insured money for the banks placed under AID. The DICGC is now empowered to disburse to depositors of these banks a sum of up to ₹5 lakh each, within a period of 90 days. An insured bank is required to submit its claim within 45 days of imposition of AID after which the DICGC is required to get the claims verified within 30 days and pay the depositors within the next 15 days. There is no provision in the DICGC Act to extend the timelines fixed by the statute either for the insured bank or the DICGC. However, there have been instances of non-submission of depositors claim list by some UCBs within the statutory timeline of 45 days, thereby constraining the DICGC from making pay-outs to eligible depositors of such banks. IV.87 Financial inclusion has been an important policy endeavour with a view to promoting economic development and social well-being. While the implementation of the Business Correspondent (BC) model and the Pradhan Mantri Jan Dhan Yojana (PMJDY) gave a strategic boost to these efforts, the National Strategy for Financial Inclusion (NSFI) 2019-2024 defines the vision and key objectives to help expand its reach and sustain the progress. The overarching goal is to provide access to formal financial services in an affordable manner, while promoting financial literacy and consumer protection. IV.88 In January 2020, the Reserve Bank set the target of having a banking outlet within a 5 km radius of every village or hamlet of 500 households in hilly areas. As on September 30, 2022 the milestone was fully achieved in 26 states and 7 union territories (UTs). The coverage of identified villages and hamlets across the country reached 99.97 per cent and only 40 villages were left to be covered in 2 states viz., Chhattisgarh and Odisha and 1 UT viz., Ladakh. IV.89 The latest Financial Access Survey (FAS) of the IMF shows that the per capita availability of bank branches in India has increased in the last decade, despite fast paced digitisation. In contrast, digitisation has led to fewer bank branches all over the world (Chart IV.38a). IV.90 Although India has the second largest number of ATMs deployed, the per capita availability remains low (Chart IV.38b). Facilities such as PoS terminals and micro-ATMs using Aadhaar enabled payment systems (AePS) help in bridging the gap. IV.91 According to the World Bank’s Global Findex Database, 78 per cent of Indian adults (population with 15 years or more of age) had a bank account in 2021, comparable to the world average. In 2021, while the gender gap24 in account ownership across the world fell to 4 percentage points from 7 percentage points in 2014, this gender gap has been eliminated in India. On the other hand, the proportion of the adult population receiving wages in cash in India is still higher at 43 per cent than the developing countries’ average of 26 per cent and the world average of 20 per cent (Chart IV.39). 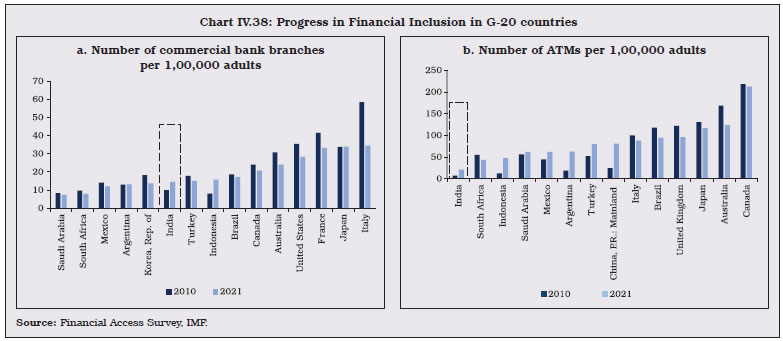 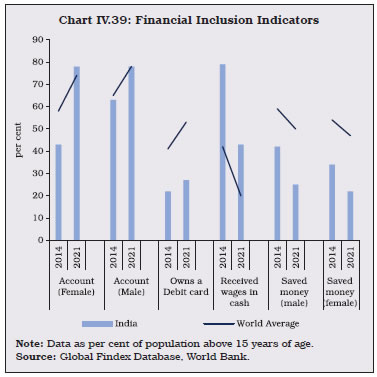 IV.92 Centres for Financial Literacy (CFLs) support financial education efforts in the country through innovative interventions and community participation. As on July 1, 2022 1,112 CFLs had been established, and 500 more centres are planned to be set up by December 2022. IV.93 In addition, Financial Literacy Centres (FLCs) undertook 1,07,564 financial literacy programs during 2021-22 to disseminate financial education. A Financial Literacy Week was observed during February 14-18, 2022 on the theme “Go Digital, Go Secure”. 11.1. Financial Inclusion Plans IV.94 Banks have been advised to put in place Financial Inclusion Plans (FIPs) to ensure a systematic approach towards increasing the level of financial inclusion in a sustainable manner. The FIPs capture banks’ achievements on various parameters like the number of banking outlets [branches and BCs], basic savings bank deposit accounts (BSBDAs), overdraft (OD) facilities availed in these accounts, transactions in Kisan Credit Cards (KCC) and General Credit Cards (GCCs) and transactions through Business Correspondents - Information and Communication Technology (BC-ICT) channel. IV.95 The BCs model has gained traction in solving the last mile problem and reaching the grassroots at a faster rate and lower cost than traditional brick-and-mortar branches. BC outlets constitute 97.5 per cent of the total banking outlets in villages in 2021-22 even as branches have decreased. The BC-ICT model has gained popularity even in rural areas as evident from its increasing usage (Table IV.28). IV.96 The state-wise distribution of fixed-point business correspondents (FBCs), however, remains uneven - more than 50 per cent of FBCs are located in Uttar Pradesh, Bihar, Maharashtra, West Bengal and Madhya Pradesh (Chart IV.40). Since March 2018, PBs have a dominant share in the total number of FBCs, with PVBs having a negligible presence (Chart IV.41). 11.2. Financial Inclusion Index IV.97 The Reserve Bank has constructed a composite Financial Inclusion Index (FI-Index) to capture the extent of financial inclusion across the country. It has three sub-indices, viz. FI-access, FI-usage and FI-quality. The index incorporates granular data on banking, investments, insurance, postal as well as the pension sector collated from the government and sectoral regulators. The value of FI Index for March 2022 was 56.4 vis-à-vis 53.9 in March 2021, with growth across all sub-indices. 11.3. Pradhan Mantri Jan Dhan Yojana IV.98 The flagship financial inclusion program PMJDY aims at ensuring access to various financial services like availability of basic savings bank accounts, access to need-based credit, remittances, insurance and pension to the unbanked weaker sections and low-income groups through effective usage of technology. After a high growth phase in the initial years, the rate of accretion of new PMJDY accounts has slowed in recent years. This is an indication that the programme is nearing its intended aim of universal access to financial services (Chart IV.42). 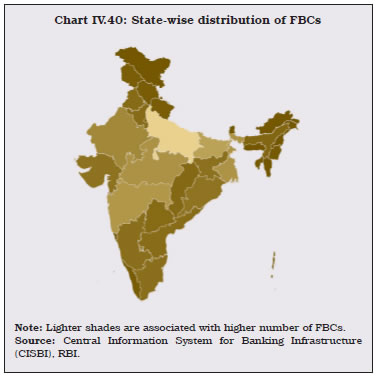 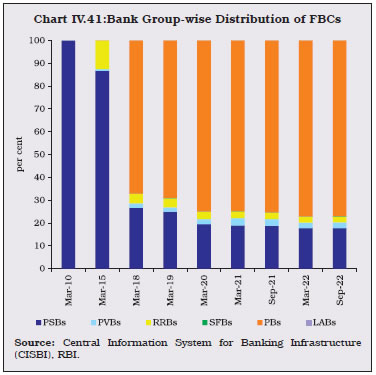 IV.99 Over eight years of its operations, the total deposit balances under PMJDY have increased, with the average deposit per account having also grown (Chart IV.43a). At end-August 2022, 56 per cent of account holders were women and 67 per cent PMJDY accounts were in rural and semi urban areas (Chart IV.43b). As per extant guidelines, a PMJDY account is treated as inoperative if there are no customer-induced transactions in it for two years. By August 2022, out of a total of 46.25 crore PMJDY accounts, 81.2 per cent were operative, up from 76 per cent in 201725. Only 8.2 per cent of PMJDY accounts were zero balance accounts. 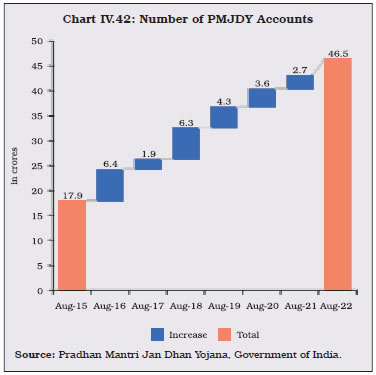 11.4. New Bank Branches by SCBs IV.100 After declining for two consecutive years, new bank branches opened by SCBs increased by 4.6 per cent during 2021-22. The growth was led by new branches opened in Tier 4, Tier 5 and Tier 6 centres. Although the share of Tier 2 and Tier 3 centres in new branches declined in 2021-22 from a year ago, more than half of the new branches opened during the year were in Tier 1 and Tier 3 centres (Table IV.29). 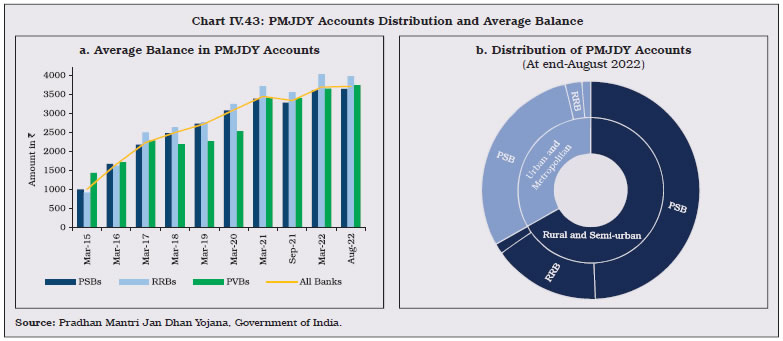 IV.101 During 2021-22, new branches opened by PVBs increased by 21.2 per cent as compared to a decline of 30.8 per cent in the previous year. Although PVBs opened new branches across all population groups, the increase was the sharpest in metropolitan areas. PSBs, on the other hand, opened fewer new branches in 2021-22. The share of rural areas in newly opened bank branches by PSBs, however, increased to 20.8 per cent in 2021-22 from 11.5 per cent in 2020-21, while the combined share of urban and metropolitan areas declined from 63.6 per cent to 52.6 per cent in the same period (Chart IV.44). 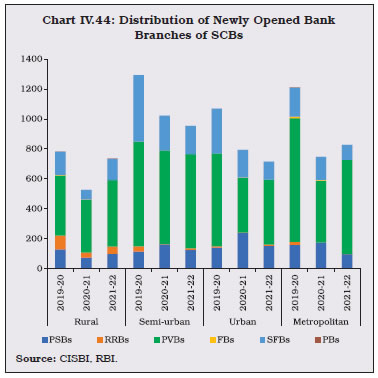 11.5. Microfinance Programme IV.102 The Self-Help Group - Bank linkage programme (SHG-BLP), which aims at extending formal credit facilities to the poor, has emerged as the world’s largest micro-finance movement. During 2021-22, close to 34 lakh SHGs availed loans from banks. The average size of loan disbursed during the year as well as that of loan outstanding had declined at end-March 2021 reflecting COVID-19 related disturbances. This revived by end-March 2022 and surpassed end-March 2019 levels (Chart IV.45). The southern region (36 per cent) had the highest share of savings linked SHGs during 2021-22, followed by the eastern region (27.4 per cent) and the western region (11.4 per cent) (Appendix Table IV.13). The NPA ratio of SHGs decreased to 3.80 per cent in 2021-22 from 4.73 per cent in 2020-21. 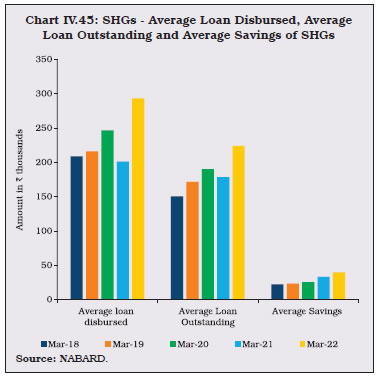 IV.103 Joint Liability Groups (JLGs) are a vehicle of strategic intervention for augmenting the flow of collateral free credit to landless farmers cultivating land as tenant farmers, oral lessees, sharecroppers and small/marginal farmers and other poor individuals taking up farm, off farm and non-farm activities. To boost JLG financing by banks, NABARD introduced a business model in 2017, whereby banks (PSBs, RRBs and co-operative banks) execute an MoU with NABARD for financing JLGs on terms and conditions as specified in the MoU. During 2021-22, keeping in view the increased participation under JLG financing, grant assistance under the Business Model Scheme was extended to SFBs and scheduled PVBs. Under the scheme, grant support towards JLG formation and linkage is assured from NABARD. During 2021-22, loans disbursed by banks to JLGs increased by 93.4 per cent as compared to a decline of 29.8 per cent a year ago. In terms of cumulative JLGs promoted as on 31 March 2022, the southern states recorded the highest growth of 49 per cent, followed by the western states at 48 per cent. 11.6. Trade Receivables Discounting System (TReDS) IV.104 TReDS is an electronic platform to help MSMEs in managing their working capital needs by facilitating the financing / discounting of trade receivables through multiple financiers. These receivables can be due from corporates and other buyers, including government departments and public sector undertakings (PSUs). TReDS was introduced by the Reserve Bank in 2014, and three platforms were granted licenses to operate in 2017. During 2021-22, the number of invoices uploaded and financed through the platform more than doubled and the success rate26 improved to 94.7 per cent from 91.3 per cent a year earlier (Table IV.30). 11.7. Regional Banking Penetration IV.105 At end-March 2022, due to concentration of bank branches in the western, southern and northern regions, the population served by each branch in other regions was comparatively higher. There was less variation across southern states than eastern and north-eastern states (Chart IV.46). 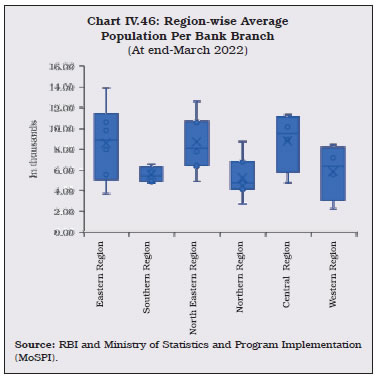 IV.106 At end-March 2022, there were 43 RRBs sponsored by 12 SCBs, with 21,892 branches, and operations extending to 29.7 crore deposit accounts and 2.7 crore loan accounts in 26 States and 3 Union Territories (Puducherry, Jammu & Kashmir, Ladakh). 92 per cent of their branches were in rural/semi-urban areas. The southern region had the highest number of RRBs, followed by the eastern region (Appendix Table IV.14). 12.1. Balance Sheet Analysis IV.107 During the past 46 years, all the stakeholders taken together (such as central government, state governments and sponsor banks) have infused capital of ₹8,393 crore in RRBs. In contrast, ₹10,890 crore is budgeted to be infused in RRBs during 2021-22 and 2022-23, with 50 per cent contribution from central government, 15 per cent from state governments and the rest from sponsor banks. The capital infusion is expected to help RRBs in greater adoption of technology, accompanied by operational and governance reforms. To this end, a Sustainable Viability Plan has been drawn up, aimed at credit expansion, business diversification, NPA reduction and cost rationalisation. IV.108 For 2021-22, ₹8,168 crore was sanctioned as recapitalisation assistance for 22 RRBs. At end-March 2022, NABARD had released the central government’s share of ₹3,197.29 crores to 21 RRBs after proportionate release of equivalent amount by sponsor banks and state governments. IV.109 During the year, the growth in consolidated balance sheet of RRBs moderated on account of slowdown in the growth of loans and advances as well as investments on the asset side, and deposits and borrowings on the liabilities side. The deposit growth of RRBs was lower than that of SCBs. At end-March 2022, RRBs had the highest share of low cost CASA deposits (54.5 per cent of total deposits) amongst all categories of SCBs27 (Table IV.31). IV.110 RRBs are mandated to lend 75 per cent of their adjusted net bank credit (ANBC) of the previous year to the priority sector. During 2021-22, all except 2 RRBs overachieved their targets by lending over 90 per cent to the priority sector, of which close to 70 per cent was to agriculture and 11.5 per cent to MSMEs (Table IV.32 and Appendix Table IV.15). 12.2. Financial Performance IV.111 After two consecutive years of reporting losses in 2018-19 and 2019-20, RRBs turned around in 2020-21 and posted net profits, which improved further in 2021-22. Their CRAR also increased significantly (Table IV.33). During the year, the number of RRBs with CRAR less than the regulatory requirement of 9 per cent declined from 16 to 13 and those with negative CRAR declined from 8 to 3. IV.112 During the year, interest income grew at a modest rate, but interest expenditure contracted, resulting in higher net interest income as well as net interest margin. The number of profit earning RRBs increased to 34 in 2021-22 from 30 in 2020-21 (Appendix Table IV.14). 12.3. Priority Sector Lending IV.113 Since RRBs lend around 48 per cent of their total loans to small and marginal farmers (SF/MF), they are the major sellers in the PSLC-SF/MF category. As PSLC-SF/MF are traded at a premium in comparison to the PSLC-general category, RRBs oversell PSLCs under the former category and compensate for the same by purchasing PSLCs under the latter category to meet the overall PSL target of 75 per cent (Table IV.34) IV.114 PSLCs have helped RRBs leverage their high PSL portfolio to augment miscellaneous income (Chart IV.47). Though RRBs account for just 3 per cent of the total bank credit of all SCBs, their share in total PSLC traded volume (issue and purchase) was 35 per cent during 2021-22. 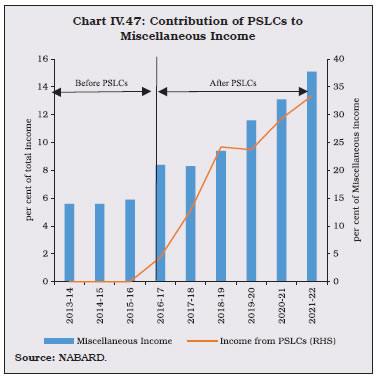 IV.115 LABs were established in 1996 for mobilising rural savings and making them available for investments in the local areas. As of March 2022, two LABs with 79 branches28 were operational in the country. In 2021-22, the consolidated balance sheet of LABs decelerated. As the deceleration in credit was lower than that in deposits, the credit-deposit ratio increased to 82 per cent in 2021-22 from 80.7 per cent in 2020-21 (Table IV.35). 13.1. Financial Performance of LABs IV.116 During the year, both interest expended as well as interest income earned decelerated, keeping net profits stable. Operating profits witnessed subdued growth as compared to previous year, owing to a sharp acceleration in operating expenses, especially the wage bill (Table IV.36). IV.117 The SFBs were set up in 2016 to further financial inclusion through tailored deposit products and for providing credit to small business units, small and marginal farmers, micro and small industries and other unorganized sector entities through technology led low-cost operations. At end-March 2022, twelve SFBs with 5,677 domestic branches across the country were operational, including Shivalik Small Finance Bank Ltd. and Unity Small Finance Bank Ltd., that were licensed in 2021-22. 14.1. Balance Sheet IV.118 During 2021-22, the consolidated balance sheet of SFBs grew at a pace faster than that of SCBs. Deposit growth as well as that of loans and advances accelerated year-on-year. On balance, the credit-deposit ratio of SFBs decreased to 93.2 per cent in 2021-22 from 99 per cent a year ago, though it remained higher than that of SCBs (Table IV.37). 14.2. Priority Sector Lending IV.119 The share of the priority sector in SFBs’ total lending increased during 2021-22 after declining over three consecutive years. After a break in the previous year, the SFBs met their priority sector lending target of 75 per cent in 2022. Within the priority sector, the focus remained on MSMEs, followed by agriculture and allied activities (Table IV.38). 14.3. Financial Performance IV.120 During 2021-22, the net profits and operating profits of SFBs contracted. The slowdown was on account of higher operating expenses and provisioning for bad loans. The asset quality of SFBs improved marginally during the year (Table IV.39). IV.121 PBs were set up as niche entities to facilitate small savings and to provide payments and remittance services to migrant labour, low-income households, small businesses and other unorganised sector entities. At end-March 2022, six PBs were operational, of which only three managed to become profitable in their operations. 15.1. Balance Sheet IV.122 In line with their mandate, the asset side of PBs’ balance sheet is concentrated in SLR investments and money placed at call and short notice with other banks. Deposits form 42.4 per cent of their liabilities, the majority of which are on demand. At end-March 2022, all PBs complied with the regulatory minimum CRAR of 15 per cent (Table IV.40). 15.2. Financial Performance IV.123 Notwithstanding the increase in both interest and non-interest income, PBs ended 2021-22 with losses due to high operating expenses (Table IV.41). PBs earn their revenues primarily from six income streams viz., (i) earnings from micro-ATMs for providing remittances and cash withdrawal services to customers; (ii) providing BC services to other banks; (iii) transaction charges on utility bill payments and other small transactions; (iv) cash management/ collection services; (v) commissions on transactions through PoS terminals and MDR charges; and (vi) para-banking activities. Since PBs are barred from offering credit as a product, their interest earnings are low. IV.124 Although efficiency, measured by the cost-to-income ratio, improved for the fourth consecutive year, margins were thin even for the profitable PBs. NIM declined for the third consecutive year. Other performance metrics, such as RoA, RoE, operating profit to working funds ratio and profit margins remained negative during the year, but the extent of losses reduced considerably (Table IV.42). 15.3. Inward and Outward Remittances IV.125 Income from remittance operations formed a major part of income of PBs, especially for those with a good network and reach. PBs’ transactions in centralised payment systems (RTGS and NEFT) increased by around 19 times from March 2020 to June 2022, while the amount involved in the transactions also increased by more than 4 times (Chart IV.48). IV.126 In 2021-22, the volume of inward and outward remittances by PBs increased by 76.3 per cent and 84.5 per cent, respectively, and the value of both inward and outward remittances increased by more than 100 per cent as against a 20 per cent decline recorded in the previous year in both value and volume terms. UPI had the highest share in the number of inward and outward remittances and it also occupied the first place in terms of share in the value of inward flows. In terms of the value of outward remittances, however, IMPS had the largest share (Table IV.43). 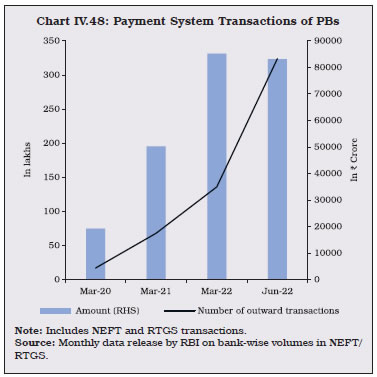 IV.127 The Indian banking sector has weathered the pandemic, emerging more resilient and robust. Owing to timely policy support, banks have reported improved profitability, asset quality and capital buffers. More recently, banks’ balance sheets have witnessed healthy acceleration with broad-based credit growth driving the flow of resources to the productive sectors of the economy. Credit to MSMEs received a boost from the government’s guarantee cover under the ECLGS. IV.128 Going forward, it is imperative that banks ensure due diligence and robust credit appraisal to limit credit risk. The uncertainties characterising fast-changing macroeconomic scenario amidst formidable global headwinds during 2022-23 can pose new challenges to the banking sector. If downside risks materialise, asset quality could be affected. Hence, slippages in restructured assets need to be monitored closely. Timely resolution of stressed assets is essential to prevent asset value depletion. IV.129 The push provided by the JAM trinity has resulted in increased access to banking services to the unserved and the underserved sections of the population. With the success of UPI and mass adoption of digital banking services, various concerns such as unbridled engagement of third parties, mis-selling, breach of data privacy, unfair business conduct, exorbitant interest rates, and unethical recovery practices have emerged. Banks need to develop appropriate business strategies, strengthen their governance framework and implement cybersecurity measures to mitigate these concerns. 1 The cash reserve ratio (CRR) was increased from 3.5 per cent to 4 per cent of net demand and time liabilities (NDTL) effective from the fortnight beginning May 22, 2021. Subsequently, it has been further increased to 4.5 per cent of NDTL effective from the reporting fortnight beginning May 21, 2022. 2 IDBI Bank Ltd. has been categorized as Private Sector Bank with effect from January 21, 2019. Hence, from March 2019 round onwards IDBI Bank Ltd. is excluded from Public Sector Banks group and included in Private Sector Banks group. ‘The Lakshmi Vilas Bank Ltd.’ (a Private Sector Bank) was amalgamated with ‘DBS Bank India Ltd.’ (a Foreign Bank) with effect from November 27, 2020. 3 Commercial banks were granted initial special dispensation of enhanced Held to Maturity (HTM) limit of 22 per cent of Net Demand and Time Liabilities (NDTL), for Statutory Liquidity Ratio (SLR) eligible securities acquired between September 1, 2020 and March 31, 2021. The limit was further extended to 23 per cent in April 2022, which is scheduled to be phased out gradually beginning from end June 2023. 4 Short-term is defined as up to 1 year while long-term is more than 3 years. 5 Xu, TengTeng & Hu, Kun & Das, Udaibir. (2019). Bank Profitability and Financial Stability. IMF Working Papers. 19.1.10.5089/9781484390078.001. 6 In the post 2019 period several bank mergers took place, constraining the availability of consistent time series data. In view of this, the analysis is limited to the period 2008-2019. 7 The 95 per cent confidence interval for optimal NIM is (4.9733, 5.2333). Testing whether this non-linear relationship has more than one threshold, the hypotheses of two and higher number of thresholds were rejected as bootstrap p-values were not found to be significant. 8 Banking data has been sourced from the Banker Database, while financial and macroeconomic data has been taken from Bloomberg and CEIC. 9 Refers to three-month OIS except for Brazil, where it pertains to the one-year OIS. 10 Defined as total amount involved in frauds divided by number of frauds. 11 The specific time period was chosen in accordance with data availability for bank-wise sectoral credit. Also, the data has been adjusted for M&As during this period. 12 Source: The shareholding data have been sourced from the NSE website as on March 31, 2022. 13 Chavan, Pallavi & Gambacorta, Leonardo. (2016). Bank lending and loan quality: The case of India. BIS Working Paper. 14 Guidelines on compensation of whole time directors/ chief executive officers/material risk takers and control function staff issued on November 4, 2019, became effective for the pay cycles beginning from/after April 01, 2020. 15 In case the VP is up to 200 per cent of the fixed pay, a minimum of 50 per cent of the VP should be via non-cash instruments and in case the VP is above 200 per cent, the same should be a minimum of 67 per cent of the VP. 16 VP used here is the actual amount paid by the bank. 17 Corporate Governance in Banks - Appointment of Directors and Constitution of Committees of the Board 18 Presence of whole time directors (WTDs) including MD & CEO. 19 3,82,292 complaints received in 2020-21 including complaints received under Banking Ombudsman Scheme, Ombudsman Scheme for NBFCs and Ombudsman Scheme for Digital Transactions. 20 The disposal rate is computed as: [(complaints disposed during the year) ÷ (opening complaints +receipt of complaints during the year)]. 21 IADI (2013), Enhanced Guidance for Effective Deposit Insurance Systems: Deposit Insurance Coverage, Guidance Paper, March, available at www.iadi.org. 22 Ratio of deposit insurance fund to insured deposits. 23 Inclusive of main claims settled under the expeditious claims settlement policy of the Corporation for an amount of ₹42.6 crore in case of three co-operative banks. 24 Gender gap relates to per cent of males holding a bank account minus per cent of females holding a bank account. 25 Source: https://pib.gov.in/PressReleasePage.aspx?PRID=1854909 26 Defined as per cent of invoices uploaded that get financed. 27 PSBs had 43.8 per cent CASA share in total deposits, PVBs 47 per cent, SFBs 40.5 per cent and Foreign Banks 43.8 per cent. 28 Source: Central Information System for Banking Infrastructure (CISBI). | ||||||||||||||||||||||||||||||||||||||||||||||||||||||||||||||||||||||||||||||||||||||||||||||||||||||||||||||||||||||||||||||||||||||||||||||||||||||||||||||||||||||||||||||||||||||||||||||||||||||||||||||||||||||||||||||||||||||||||||||||||||||||||||||||||||||||||||||||||||||||||||||||||||||||||||||||||||||||||||||||||||||||||||||||||||||||||||||||||||||||||||||||||||||||||||||||||||||||
ಪೇಜ್ ಕೊನೆಯದಾಗಿ ಅಪ್ಡೇಟ್ ಆದ ದಿನಾಂಕ:


