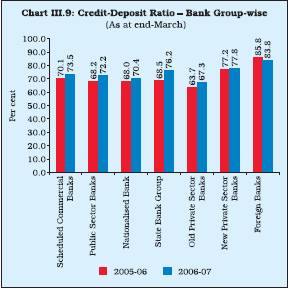
foreign banks, the CDR of as many as 10 banks was over 100 per cent (Appendix Table III.13).
Maturity Profile of Assets and Liabilities of Banks
3.50 Although the maturity structure of commercial banks’ assets and liabilities at end- March 2007 broadly followed the pattern of the previous year, some significant variations were observed over the year. The share of deposits of up to one year maturity of all bank groups (barring old private sector banks) increased significantly, while that of other maturity buckets declined. In the case of borrowings, a divergent trend was observed at the short-end of maturity amongst various bank groups. The share of borrowings up to one year maturity of public sector banks and foreign banks increased, while that of old private banks and new private sector banks declined. On the asset side, the maturity pattern of loans and advances and investments of all bank groups remained broadly the same, barring that of foreign bank group. On the whole, assets depicted a synchronous pattern with the liabilities. At end-March 2007, in general, public sector banks and old private sector banks had significantly higher proportion of both liabilities and assets under longer maturity bucket. Further, within the asset portfolio, while the maturity profile of loans and advances was nearly similar for most bank groups, investment pattern of new private sector banks and foreign banks was more tilted towards shorter term maturity (Table III.16).
Table III.16: Bank Group-wise Maturity Profile of Select Liabilities /Assets |
(As at end-March) |
(Per cent) |
Assets/Liabilities |
Public Sector |
Old Private |
New Private |
Foreign |
|
|
Banks |
Sector Banks |
Sector Banks |
Banks |
|
2006 |
2007 |
2006 |
2007 |
2006 |
2007 |
2006 |
2007 |
1 |
2 |
3 |
4 |
5 |
6 |
7 |
8 |
9 |
I. |
Deposits |
|
|
|
|
|
|
|
|
|
a) |
Up to 1 year |
40.1 |
42.4 |
48.0 |
47.0 |
58.7 |
60.4 |
53.2 |
64.0 |
|
b) |
Over 1 year and up to 3 years |
30.4 |
29.0 |
38.2 |
39.0 |
36.9 |
35.5 |
43.6 |
35.6 |
|
c) |
Over 3 years and up to 5 years |
11.7 |
11.2 |
6.0 |
7.8 |
3.0 |
2.6 |
0.4 |
0.4 |
|
d) |
Over 5 years |
17.8 |
17.5 |
7.8 |
6.1 |
1.4 |
1.5 |
2.8 |
– |
II. |
Borrowings |
|
|
|
|
|
|
|
|
|
a) |
Up to 1 year |
49.7 |
52.7 |
81.5 |
76.3 |
55.5 |
50.4 |
84.1 |
88.7 |
|
b) |
Over 1 year and up to 3 years |
21.8 |
19.3 |
3.7 |
8.3 |
18.7 |
26.7 |
14.1 |
11.2 |
|
c) |
Over 3 years and up to 5 years |
12.2 |
13.5 |
6.2 |
1.7 |
20.8 |
19.9 |
1.5 |
0.1 |
|
d) |
Over 5 years |
16.3 |
14.5 |
8.5 |
13.7 |
5.0 |
3.0 |
0.3 |
– |
III. |
Loans and Advances |
|
|
|
|
|
|
|
|
|
a) |
Up to 1 year |
36.3 |
36.8 |
42.9 |
40.0 |
30.7 |
30.4 |
55.8 |
52.2 |
|
b) |
Over 1 year and up to 3 years |
34.7 |
33.1 |
36.1 |
37.2 |
40.2 |
39.9 |
25.7 |
31.2 |
|
c) |
Over 3 years and up to 5 years |
11.5 |
12.6 |
10.0 |
11.0 |
11.3 |
12.0 |
5.3 |
6.1 |
|
d) |
Over 5 years |
17.5 |
17.5 |
10.9 |
11.9 |
17.9 |
17.6 |
13.2 |
10.5 |
IV. |
Investment |
|
|
|
|
|
|
|
|
|
a) |
Up to 1 year |
12.0 |
13.6 |
20.2 |
20.4 |
50.5 |
51.1 |
57.9 |
49.7 |
|
b) |
Over 1 year and up to 3 years |
14.5 |
14.6 |
9.7 |
11.5 |
25.5 |
25.0 |
30.0 |
30.7 |
|
c) |
Over 3 years and up to 5 years |
17.0 |
15.1 |
14.3 |
9.9 |
7.1 |
7.6 |
4.8 |
12.3 |
|
d) |
Over 5 years |
56.5 |
56.6 |
55.8 |
58.2 |
16.8 |
16.3 |
7.2 |
7.2 |
3. Off-Balance Sheet Operations
3.51 Continuing the trend of recent years, off-balance sheet (OBS) exposures of SCBs expanded rapidly by 74.9 per cent during 2006-07 over and above the increase of 50.0 per cent in 2005-06 and 58.0 per cent in 2004-05. As a result, the total off-balance sheet exposure of SCBs at end-March 2007 was more than twice the size of their combined balance sheet as compared with one and half times at end-March 2006 (Chart III.10). The sharp growth in off-balance sheet exposure reflected the banks’ attempt to diversify their sources of income.
3.52 Among bank-groups, off-balance sheet exposure of foreign banks constituted 67.9 per cent of total off-balance sheet exposure of all SCBs. The off-balance sheet exposure of foreign banks was at 1,816.6 per cent of their total assets, followed by new private sector banks (215.1 per cent), old private sector banks (44.8 per cent) and public sector banks (43.1 per cent) (Appendix Table III.14).
4. Financial Performance of Scheduled Commercial Banks
3.53 Financial performance of SCBs during 2006-07 was underpinned by hardening of interest rates, both on the liability and the asset sides. While interest income increased sharply, both in absolute terms and in relation to total assets, non-interest income declined in relative terms. Banks,

however, were able to maintain their profitability by containing operating expenses. Unlike last year, provisions and contingencies made by banks increased during the year, although they were a shade lower in relative terms (i.e., as percentage of assets). While return on assets (RoA) of SCBs remained stagnant, their return on equity (RoE) improved during the year.
Interest Rate Scenario
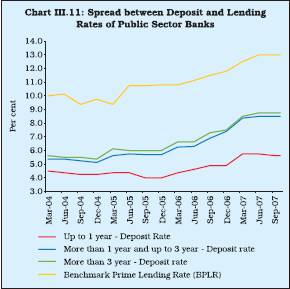
3.54 During 2006-07, interest rates hardened across the maturity spectrum both on the liability and the asset sides. The continued high credit demand during 2006-07 exerted an upward pressure on lending rates as well as deposit rates of banks. Interest rates offered on deposits by banks, in general, hardened during 2006-07 with the increase being more pronounced at the higher end of maturity (Table III.17). Among different bank groups, however, the movement in interest rates on term deposits of various maturities showed somewhat mixed trend during 2006-07. Foreign banks increased the maximum rate on term deposits by 300 to 375 basis points, followed by PSBs (225 to 275 basis points) and private sector banks (175 to 200 basis points). Foreign banks, however, at the same time, also reduced the minimum rate, thus, widening the range of interest rates offered at short-end and long-end of maturities. During 2007-08 (April-October), PSBs decreased their deposit rates, particularly at the upper end of the range for various maturities, by 25-60 basis points. Deposit rates of PSBs increased by 25-75 basis points at the lower end of maturities of one year and above (Chart III.11). Interest rates offered by PSBs on deposits with over one year maturity moved from 7.25-9.75 per cent in April 2007 to 8.00-9.50 per cent in October 2007. Private sector banks deposit rate for up to one year maturity declined from a range of 3.00-10.00 per cent to 2.50-9.25 per cent over the same period. Foreign banks deposit rates for up to one year maturity also declined from a range of 3.00-9.50 per cent to 2.00-9.00 per cent during the same period.
3.55 During 2006-07, the range of BPLRs of PSBs, private sector banks and foreign banks hardened in the range of 100-250 basis points. A substantial part of banks’ lending was at sub-BPLR rates, reflecting the competitive conditions. The share of sub-BPLR lending in total lending of commercial banks, excluding export credit and small loans, increased from 69 per cent at end-
Table III.17: Movements in Deposit and Lending Interest Rates |
(Per cent) |
Interest Rates |
March |
March |
March |
April |
June |
September |
October |
|
|
2005 |
2006 |
2007 |
2007 |
2007 |
2007 |
2007 |
1 |
|
2 |
3 |
4 |
5 |
6 |
7 |
8 |
Public Sector Banks |
|
|
|
|
|
|
|
a) |
Up to 1 year |
2.75-6.00 |
2.25-6.50 |
2.75-8.75 |
2.75-9.00 |
2.75-8.75 |
2.75-8.50 |
2.75-8.50 |
b) |
1 year and up to 3 years |
4.75-6.50 |
5.75-6.75 |
7.25-9.50 |
7.25-9.60 |
7.25-9.75 |
8.00-9.00 |
8.00-9.00 |
c) |
Over 3 years |
5.25-7.00 |
6.00-7.25 |
7.50-9.50 |
7.75-9.75 |
7.75-9.75 |
8.00-9.50 |
8.00-9.50 |
Private Sector Banks |
|
|
|
|
|
|
|
a) |
Up to 1 year |
3.00-6.25 |
3.50-7.25 |
3.00-9.00 |
3.00-10.00 |
3.00-9.50 |
2.50-9.25 |
2.50-9.25 |
b) |
1 year and up to 3 years |
5.25-7.25 |
5.50-7.75 |
6.75-9.75 |
6.75-10.00 |
6.75-10.25 |
6.25-10.00 |
6.25-9.60 |
c) |
Over 3 years |
5.75-7.00 |
6.00-7.75 |
7.75-9.60 |
7.50-10.00 |
7.50-10.00 |
7.25-10.00 |
7.25-10.00 |
Foreign Banks |
|
|
|
|
|
|
|
a) |
Up to 1 year |
3.00-6.25 |
3.00-5.75 |
3.00-9.50 |
3.00-9.50 |
0.25-9.00 |
2.00-9.00 |
2.00-9.00 |
b) |
1 year and up to 3 years |
3.50-6.50 |
4.00-6.50 |
3.50-9.50 |
3.50-9.00 |
3.50-9.50 |
2.00-9.50 |
2.00-9.50 |
c) |
Over 3 years |
3.50-7.00 |
5.50-6.50 |
4.05-9.50 |
4.05-9.00 |
4.05-9.50 |
2.00-9.50 |
2.00-9.50 |
BPLR |
|
|
|
|
|
|
|
Public Sector Banks |
10.25-11.25 |
10.25-11.25 |
12.25-12.75 |
12.50-13.50 |
12.50-13.50 |
12.50-13.50 |
12.50-13.50 |
Private Sector Banks |
11.00-13.50 |
11.00-14.00 |
12.00-16.50 |
12.50-17.25 |
13.00-17.25 |
13.00-16.50 |
13.00-16.50 |
Foreign Banks |
10.00-14.50 |
10.00-14.50 |
10.00-15.50 |
10.00-15.50 |
10.00-15.50 |
10.00-15.50 |
10.00-15.50 |
Actual Lending Rates* |
|
|
|
|
|
|
|
Public Sector Banks |
2.75-16.00 |
4.00-16.50 |
4.00-17.00 |
– |
4.00-17.75 |
– |
– |
Private Sector Banks |
3.15-22.00 |
3.15-20.50 |
3.15-25.50 |
– |
4.00-26.00 |
– |
– |
Foreign Banks |
3.55-23.50 |
4.75-26.00 |
5.00-26.50 |
– |
2.98-28.00 |
– |
– |
– : Not Available.
* : Interest rate on non-export demand and term loans above Rs.2 lakh
excluding lending rates at the extreme five per cent on both sides. |
March 2006 to about 79 per cent at end-March 2007. The band of BPLRs of private sector banks and foreign banks was much wider than that of public sector banks. BPLRs of more than half of
private sector banks were in the range of 12-14 per cent at end-March 2007, while those of other private sector banks were in the range of 14.50-16.50 per cent. As regards foreign banks, BPLRs of sixteen of them were in the range of 10.00-13.00 per cent. BPLRs of six other foreign banks were in the range of 13.25-13.50 per cent and of another six in the range of 14.00-15.50 per cent.
3.56 In the period April-October 2007, the benchmark prime lending rates (BPLRs) of private sector banks moved from a range of 12.50-17.25 per cent to 13.00-16.50 per cent in the same period. The range of BPLRs of PSBs and foreign banks, however, remained unchanged at 12.50-13.50 per cent and 10.00-15.50 per cent, respectively, during this period.
3.57 The yield on Government securities with 5-year and 10-year residual maturity hardened during 2006-07 by 66 basis and 45 basis points, respectively (Table III.18). The increase in yields was more pronounced for short-term maturities than for long-term maturities, reflecting relatively stable medium-term inflation expectations. The secondary market yields of Government securities
Table III.18: Structure of Interest Rates |
(Per cent) |
Instrument |
As at End of |
|
March 2005 |
March 2006 |
March 2007 |
September 2007 |
1 |
2 |
3 |
4 |
5 |
I. |
Debt Market |
|
|
|
|
|
1. |
Government Securities Market |
|
|
|
|
|
|
5-Year* |
6.37 |
7.24 |
7.97 |
7.78 |
|
|
10-Year* |
6.69 |
7.53 |
7.97 |
7.93 |
II. |
Money Markets |
|
|
|
|
|
2. |
Call Borrowing (Average) |
4.72 |
6.58 |
14.07 |
6.41 |
|
3. |
Commercial Paper |
|
|
|
|
|
|
WADR 61-90 days |
5.89 |
8.72 |
11.65 |
8.25 |
|
|
WADR 91-180 days |
5.87 |
8.54 |
11.81 |
8.21 |
|
|
Range |
5.45-6.51 |
6.69-9.25 |
10.25-13.00 |
7.70-12.00 |
|
4. |
Certificates of deposit |
|
|
|
|
|
|
Range |
4.21-6.34 |
6.50-8.94 |
10.23-11.90 |
6.87-10.00 |
|
|
WADR Overall |
– |
8.62 |
10.75 |
8.57 |
|
|
3 Months |
– |
8.72 |
11.35 |
8.13 |
|
|
12 Months |
– |
8.65 |
10.59 |
8.94 |
|
5. |
Treasury Bills |
|
|
|
|
|
|
91 days |
5.32 |
6.11 |
7.98 |
7.10 |
|
|
364 days |
5.61 |
6.42 |
7.98 |
7.50 |
* : As at end-month.
WADR - Weighted Average Discount Rate. |
(10-year) hardened during 2006-07. Yields hardened from 7.52 per cent at end-March 2006 to 8.30 per cent on July 11, 2006, an increase of 78 basis points over end-March 2006 due to sustained credit demand, monetary policy tightening in the US and in other economies, high and volatile crude oil prices, apprehension over domestic fuel price hike and hike in reverse repo rates by 25 basis points effective June 9, 2006. Yields eased thereafter in consonance with the easing of yields of US treasuries, the Fed’s decision to keep the Fed funds rate target unchanged, easing of crude oil prices, increased demand for gilts from banks to meet their SLR requirements and the announcement of the borrowing calendar of the Central Government for the second half of 2006-07, which was in accordance with market expectations. Yields reached a low of 7.38 per cent as on November 28, 2006. There was again some hardening of yields from the second half of December 2006 in tandem with the tightness in domestic liquidity conditions on the back of advance tax outflows, promulgation of the SLR Ordinance, higher inflation and hike in the CRR. The 10-year yield (at 7.97 per cent on March 31, 2007) ended 45 basis points higher than its level as on March 31, 2006. During 2007-08 (up to October 2007), yields remained range-bound between 7.97 and 8.19 per cent till end-May 2007 and peaked at 8.30 per cent in mid-June 2007 due to announcements of unscheduled auctions and hardening of interest rates globally. Yields softened thereafter, and moved between 7.85 and 8.01 per cent till end-October 2007.
3.58 Financial markets adjusted to the changes in interest rate and monetary conditions in an orderly fashion during 2006-07. Money market conditions, after remaining generally comfortable during the first half of 2006-07, turned relatively tight in the second half of 2006-07. The liquidity tightness was severe in the last quarter of 2006-07 impacted by the tax flows, build up of government balances with the Reserve Bank and the hike in CRR. The monthly average of weighted average call rate, which reached 8.18 per cent in January 2007, softened to 7.16 per cent in February 2007 but hardened to 14.07 per cent in March 2007. The money market rates eased considerably during the first quarter of 2007-08. However, after withdrawal of the daily reverse repo ceiling with effect from August 6, 2007, call rates have mostly remained within the informal corridor set by reverse repo and repo rate. The call rate was at 6.10 per cent on October 31, 2007.
3.59 The outstanding amount of certificates of deposit (CDs) issued by scheduled commercial banks (SCBs) more than doubled during 2006-07 from Rs.43,568 crore at end-March 2006 to Rs.93,272 crore at end-March 2007. The overall weighted average discount rate of CDs was 10.75 per cent at end-March 2007 compared with 8.62 per cent a year ago. Besides higher growth in credit offtake, competitive resource mobilisation, differential perception on credit risk and the bank-specific factors drove the growth of CD market during 2006-07. As at end-September 2007, the outstanding CD amount was at Rs.1,18,481 crore with the overall weighted average discount rate (WADR) being 8.57 per cent.
3.60 The outstanding amount of commercial paper (CP) issued by corporates increased from Rs.12,718 crore at end-March 2006 to Rs.17,688 crore at end-March 2007. The outstanding amount increased further to Rs.33,227 crore by end-September 2007. During the fortnight ended March 31, 2007, the overall weighted average discount rate (WADR) of commercial paper was at 11.33 per cent compared with 8.59 per cent at end-March 2006. The WADR of CP declined to 8.84 per cent at end-September 2007 following decline in other money market rates.
Cost of Deposits and Return on Advances
3.61 During 2006-07, the cost of borrowings and the return on advances increased mainly due to the general hardening of interest rates.
Reflecting the rise in deposit rates during the year, the cost of deposits increased marginally across all bank-groups. The cost of deposits essentially reflects the average rate of contracting deposits of different types and different maturities over a period of time. The cost of borrowings also moved up for all bank groups, except new private sector banks, in whose case it remained unchanged. Reflecting the increase in cost of deposits and borrowings, the overall cost of funds increased during the year. The increase in cost of borrowings was observed across all bank groups. Return on advances of SCBs increased during 2006-07 mainly due to increase in the lending rates. Although the return on investments declined at the aggregate level, wide variations were observed in return on advances at the bank group level. While return on investments in respect of public sector banks declined significantly, that in respect of new private sector banks incresed significantly. Return on investment of other bank groups remained broadly unchanged. The overall return on funds and overall cost of funds during the year increased more or less by the same margin as a result of which, the spread (return of funds over cost of funds) of banks remained unchanged at the previous year’s level (Table III.19).
Income
3.62 Income of SCBs increased at a robust rate of 25.1 per cent during 2006-07 as compared with
Table III.19: Cost of Funds and Return
on Funds – Bank Group-wise |
(Per cent) |
Indicator |
Public Sector |
Old Private |
New Private |
Foreign |
Scheduled |
|
Banks |
Sector Banks |
Sector Banks |
Banks |
Commercial Banks |
|
|
2005-06 |
2006-07 |
2005-06 |
2006-07 |
2005-06 |
2006-07 |
2005-06 2006-07 |
2005-06 |
2006-07 |
1 |
|
2 |
3 |
4 |
5 |
6 |
7 |
8 |
9 |
10 |
11 |
1. |
Cost of Deposits |
4.3 |
4.5 |
4.5 |
4.9 |
3.6 |
4.7 |
2.8 |
3.2 |
4.1 |
4.5 |
2. |
Cost of Borrowings |
2.5 |
3.4 |
3.1 |
3.4 |
3.1 |
3.1 |
4.5 |
4.7 |
3.0 |
3.6 |
3. |
Cost of Funds |
4.2 |
4.4 |
4.5 |
4.8 |
3.5 |
4.5 |
3.2 |
3.5 |
4.0 |
4.4 |
4. |
Return on Advances |
7.1 |
7.7 |
7.9 |
8.6 |
7.3 |
8.3 |
7.6 |
8.7 |
7.2 |
7.9 |
5. |
Return on Investments |
8.2 |
7.5 |
7.2 |
7.2 |
5.5 |
6.6 |
7.5 |
7.6 |
7.7 |
7.3 |
6. |
Return on Funds |
7.5 |
7.6 |
7.7 |
8.1 |
6.6 |
7.7 |
7.6 |
8.3 |
7.4 |
7.7 |
7. |
Spread (6-3) |
3.3 |
3.2 |
3.2 |
3.3 |
3.1 |
3.2 |
4.3 |
4.8 |
3.3 |
3.3 |
Note :
1. Cost of Deposits = Interest Paid on Deposits/Deposits.
2. Cost of Borrowings = Interest Paid on Borrowings/Borrowings.
3. Cost of Funds = (Interest Paid on Deposits + Interest Paid on Borrowings)
/(Deposits + Borrowings)
4. Return on Advances = Interest Earned on Advances/Advances
5. Return on Investments = Interest Earned on Investments/Investments
6. Return on Funds = (Interest Earned on Advanced + Interest Earned on Investments)
/(Investments + Advances) |
Table III.20: Important Financial Indicators
of Scheduled Commercial Banks |
(Amount in Rs. crore) |
Item |
2004-05 |
2005-06 |
2006-07 |
|
Amount |
Per cent to |
Amount |
Per cent to |
Amount |
Per cent to |
|
|
Assets |
|
Assets |
|
Assets |
1 |
2 |
3 |
4 |
5 |
6 |
7 |
1. |
Income |
1,90,236 |
8.1 |
2,20,756 |
7.9 |
2,76,201 |
8.0 |
|
a) |
Interest Income |
1,55,801 |
6.6 |
1,85,388 |
6.7 |
2,37,271 |
6.9 |
|
b) |
Other Income |
34,435 |
1.5 |
35,368 |
1.3 |
38,929 |
1.1 |
2. |
Expenditure |
1,69,278 |
7.2 |
1,96,174 |
7.0 |
2,44,998 |
7.1 |
|
a) |
Interest Expended |
89,079 |
3.8 |
1,07,161 |
3.8 |
1,43,965 |
4.2 |
|
b) |
Operating Expenses |
50,133 |
2.1 |
59,201 |
2.1 |
66,319 |
1.9 |
|
|
Of which
: Wage Bill |
29,479 |
1.3 |
33,461 |
1.2 |
36,160 |
1.0 |
|
c) |
Provision and Contingencies |
30,065 |
1.3 |
29,812 |
1.1 |
34,714 |
1.0 |
3. |
Operating Profit |
51,023 |
2.2 |
54,394 |
2.0 |
65,917 |
1.9 |
4. |
Net Profit |
20,958 |
0.9 |
24,582 |
0.9 |
31,203 |
0.9 |
5. |
Net Interest Income/Margin
(1a-2a) |
66,722 |
2.8 |
78,227 |
2.8 |
93,306 |
2.7 |
Note : The number of scheduled commercial banks in 2004-05,
2005-06 and 2006-07 were 88, 85, and 82, respectively. |
16.0 per cent during 2005-06. The income to assets ratio, which had suffered a decline during 2005-06, increased marginally to 8.0 in 2006-07 from 7.9 in 2005-06 (Appendix Tables III.15 to III.18). Interest income, the predominant component of income of SCBs, rose sharply by 28.0 per cent as compared with 19.0 per cent in the previous year mainly due to strong volumes of credit and rise in interest rates (Table III.20). ‘Other income’ of SCBs also increased by 10.0 per cent compared with the much smaller increase of 2.7 per cent during 2005-06. In relative terms, while interest income as percentage of assets increased marginally during the year, other income to assets ratio declined.
3.63 The share of interest income in total income increased for the third year in succession to 85.9 per cent in 2006-07 from 81.9 per cent in 2004-05 – the year when SCBs entered the phase of high credit growth (Chart III.12). Concomitantly, the share of non-interest income in banks’ total income declined to 14.1 per cent in 2006-07 from 16.0 per cent in 2005-06 and 18.1 per cent in 2004-05. The share of non-interest income, which had risen significantly between 2000-01 and 2003-04, declined in the subsequent years.
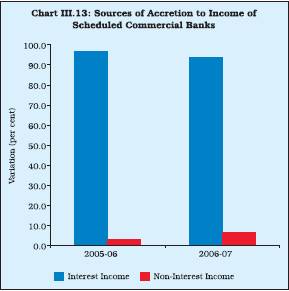
3.64 In terms of percentage contribution of two major components of income, interest income has been a major contributor to the accretion in income of SCBs. While a major shift was observed in the pattern of interest and non-interest components of income between 2004-05 and 2005-06, it remained broadly unchanged during 2006-07 (Appendix Tables III.19 to III.23). During 2005-06 and 2006-07, non-interest income made positive contributions, though small in magnitude, in contrast to 2004-05, when non-interest income of SCBs turned negative (Chart III.13).
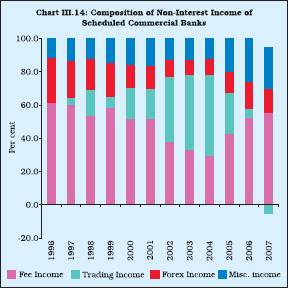
3.65 The contribution of various sources of non-interest income (or other income) of SCBs underwent some change during 2006-07 in line with the trend observed during the previous two years. The trend in non-interest income has

been influenced mainly by the behaviour of trading income, which, in turn, was guided by the yield on Government securities. The share of trading income turned negative during the year, while the shares of fee income, income from foreign exchange operations and miscellaneous income increased for the third year in succession (Chart III.14). Bank-wise data reveal that trading income of only eight out of 28 PSBs witnessed an increase during 2006-07 (Appendix Table III.15).
3.66 Among bank-groups, income of new private sector banks grew at the highest rate (55.0 per cent) during 2006-07, followed by foreign banks (41.3 per cent), public sector banks (18.3 per cent) and old private sector banks (12.8 per cent). The interest income to total assets ratio of private sector banks, foreign banks and new private sector banks improved during the year, while it declined in the case of PSBs, in particular, SBI group.
Expenditure
3.67 During 2006-07, the expenditure of SCBs witnessed a significant increase of 24.9 per cent as compared with 15.9 per cent increase in 2005-06. The expenditure to assets ratio also increased to 7.1 per cent from 7.0 per cent in 2005-06. Among the major components of the expenditure of SCBs, while interest expended during 2006-07 increased at a higher rate of 34.3 per cent as compared with 20.3 per cent in 2005-06, operating expenses increased at a lower rate of 12.0 per cent as compared with 18.1 per cent in 2005-06. The lower increase in non-interest or operating expenses may be explained in terms of lower increase in the wage bill during 2006-07 as compared with the previous year (Appendix Table III.25).
3.68 Even though both the non-interest income and non-interest expenditure declined as percentage of total assets, the gap between operating expenses and non-interest income widened further during 2006-07 due to higher increase in operating cost as compared with the increase in non-interest income. As a result, the banks’ burden (excess of non-interest expenditure over non-interest income) declined marginally to 0.8 per cent of assets in 2006-07 (from 0.9 per cent in 2005-06). The efficiency ratio (operating expenses as percentage of net interest income plus non-interest income) improved to 50.2 per cent during 2006-07 from 52.1 per cent in 2005-06, after having deteriorated in 2005-06 from 49.6 per cent during 2004-05 (Table III.21).
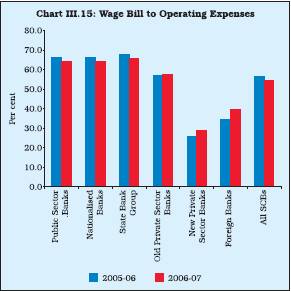
3.69 The wage bill for the banking sector, on the whole, registered a lower increase of 8.1 per cent during 2006-07 as compared with 13.5 per cent in the last year. The wage bill declined both as percentage of total assets (to 1.0 per cent from 1.2 per cent) and as percentage of operating expenses (to 54.5 per cent from 56.5 per cent). During the year, the wage bill as a percentage of operating expenses was lowest in the case of new
Table III.21: Changes in Income-Expenditure |
Profile of Scheduled Commercial Banks |
(Amount in Rs. crore) |
|
|
2005-06 |
2006-07 |
|
|
Amount |
Per cent |
Amount |
Per cent |
1 |
|
2 |
3 |
4 |
5 |
1. |
Income (a+b) |
30,520 |
16.0 |
55,445 |
25.1 |
|
a) Interest Income |
29,587 |
19.0 |
51,883 |
28.0 |
|
b) Other Income |
933 |
2.7 |
3,562 |
10.1 |
2. |
Expenses (a+b+c) |
26,896 |
15.9 |
48,824 |
24.9 |
|
a) Interest Expenses |
18,082 |
20.3 |
36,804 |
34.3 |
|
b) Other Expenses |
9,067 |
18.1 |
7,118 |
12.0 |
|
c) Provisioning |
-253 |
-0.8 |
4,902 |
16.4 |
3. |
Operating Profit |
3,370 |
6.6 |
11,523 |
21.2 |
|
|
|
|
|
|
4. |
Net Profit |
3,624 |
17.3 |
6,621 |
26.9 |
Source : Balance Sheets of respective banks. |
private sector banks (28.9 per cent), followed by foreign banks (39.8 per cent); the ratio was the highest for PSBs (64.3 per cent) (Chart III.15). However, the spread in the wage bill to operating expenses across bank groups narrowed down with the increase in the ratio for new private sector banks and foreign banks and decline in that for PSBs. The decline in the wage bill to operating expenses ratio for PSBs during 2006-07 might be due to higher increase in other operating expenses such as technological upgradation in view of the implementation of Basel II.
Net Interest Income
3.70 Net interest income, defined as the difference between interest income and interest expenses, is an important indicator of efficiency of the intermediation process by banks. The lower net interest income in relation to assets is an indicator of higher efficiency. The net interest income (spread) of SCBs as percentage of total assets declined marginally to 2.7 in 2006-07 from 2.8 in 2005-06. The net interest margin of foreign banks and private banks increased, while that of PSBs declined during the year from their respective levels in 2005-06 (Appendix Table III.16).
Operating Profits
3.71 Operating profits of SCBs increased by 21.2 per cent in 2006-07 compared with the increase of 6.6 per cent in 2005-06, reflecting largely the impact of higher increase in interest income and a lower increase in operating expenses. Operating profits of all bank groups, except State Bank group, increased during 2006-07. The operating profits to total assets ratio declined marginally to 1.9 per cent in 2006-07 from 2.0 per cent during 2005-06. However, at the individual bank level, it varied widely for foreign banks (8.3 per cent to -0.3 per cent) and private sector banks (3.3 per cent to -2.2 per cent), while in the case of PSBs it moved in a relatively narrow range (2.4 per cent to 0.9 per cent) (Appendix Table III.19).
Provisions and Contingencies
3.72 The provisions and contingencies of SCBs showed a sharp increase of 16.4 per cent in 2006-07 as against a marginal decline during 2005-06. However, provisions for loan losses and also for depreciation in value of investments declined significantly by 7.5 per cent and 23.3 per cent, respectively, during 2006-07 (see also paragraphs 3.81 and 3.86). Bank-group wise, provisions and contingencies as percentage of total assets increased for private sector banks, while it declined for PSBs and remained unchanged for foreign banks.
Net Profit
3.73 Net profits increased by 27.0 per cent during 2006-07 as compared with 17.3 per cent during 2005-06 (Table III.22). The high growth in net profits was recorded despite a sharp increase in provisions and contingencies of SCBs. Bank-
Table III.22: Operating Profit and Net Profit – Bank Group-wise |
(Amount in Rs. crore) |
Bank Group |
Operating Profit |
Net Profit |
|
2005-06 |
Percentage |
2006-07 |
Percentage |
2005-06 |
Percentage |
2006-07 |
Percentage |
|
|
Variation |
|
Variation |
|
Variation |
|
Variation |
1 |
2 |
3 |
4 |
5 |
6 |
7 |
8 |
9 |
Scheduled Commercial Banks |
54,394 |
6.6 |
65,917 |
21.2 |
24,582 |
17.3 |
31,203 |
26.9 |
Public Sector Banks |
37,967 |
-2.0 |
42,268 |
11.3 |
16,539 |
7.1 |
20,152 |
21.8 |
Nationalised Banks |
22,140 |
-4.2 |
27,070 |
22.3 |
10,021 |
5.9 |
12,950 |
29.2 |
State Bank Group |
15,026 |
-1.7 |
14,292 |
-4.9 |
5,956 |
4.9 |
6,572 |
10.3 |
Other Public Sector Bank |
801 |
121.8 |
907 |
13.2 |
561 |
82.5 |
630 |
12.4 |
Old Private Sector Banks |
2,257 |
0.7 |
3,027 |
34.1 |
866 |
98.6 |
1,122 |
29.6 |
New Private Sector Banks |
7,511 |
38.0 |
11,021 |
46.7 |
4,109 |
32.6 |
5,343 |
30.0 |
Foreign Banks |
6,658 |
45.5 |
9,600 |
44.2 |
3,069 |
54.8 |
4,585 |
49.4 |
Source : Balance sheets of respective banks. |
group wise, net profits of all bank groups increased in absolute terms, though as a percentage of assets, net profits for the SBI group and new private sector banks declined as compared with the previous year (Appendix Table III.16).
Return on Assets
3.74 Return on assets (RoA) is an indicator of efficiency with which banks deploy their assets. Net profits to assets ratio of SCBs remained almost unchanged at the previous year’s level.
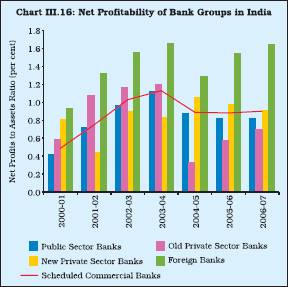
Return on assets of old private sector banks and foreign banks increased significantly during 2006-07, while that of PSBs increased marginally (Chart III.16). However, return on assets of new private sector banks declined marginally.
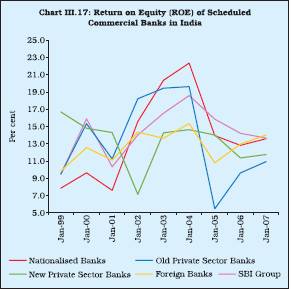
Return on Equity
3.75 Return on equity (RoE), an indicator of use of capital by efficiency of banking institutions, improved to 13.2 per cent in 2006-07 from 12.7 per cent in 2005-06 (Chart III.17).
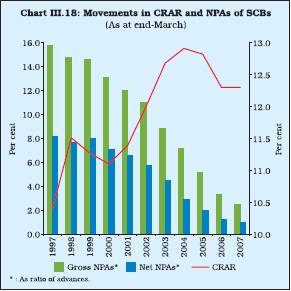
5. Soundness Indicators
3.76 The capital to risk-weighted ratio of SCBs, a measure of the capacity of the banking system to absorb losses was at 12.3 per cent at end-March 2007 – the same as at end-March 2006. The asset quality of SCBs reflected further improvement during the year as the non-performing asset ratios, on a gross and net basis, continued to decline during the year. Thus, in terms of the two crucial soundness indicators, viz., capital and asset quality, the Indian banking sector remained comfortably placed at end-March 2007 (Chart III.18).
Asset Quality
3.77 The strong credit growth for the third year in succession continued to be underpinned by significant improvement in asset quality. Continuing the recent trend, gross NPAs declined in absolute terms during 2006-07, albeit marginally as NPAs recovered and written-off exceeded the fresh addition of NPAs during the
year (Table III.23). The trend was, however, divergent across bank groups. While the absolute
Table III.23: Movements in Non-performing
Assets – Bank Group-wise |
(Amount in Rs. crore) |
Item |
Scheduled |
Public |
Nationalised |
State |
Old Private |
New Private |
Foreign |
|
Commercial |
Sector |
Banks |
Bank |
Sector |
Sector |
Banks |
|
Banks |
Banks |
(19) |
Group |
Banks |
Banks |
(29) |
|
(82) |
(28) |
|
(8) |
(17) |
(8) |
|
1 |
2 |
3 |
4 |
5 |
6 |
7 |
8 |
Gross NPAs |
|
|
|
|
|
|
|
As at end-March 2006 |
50,519 |
41,358 |
27,701 |
12,541 |
3,182 |
4,051 |
1,927 |
Addition during the year |
26,211 |
19,614 |
12,419 |
6,264 |
1,349 |
3,830 |
1,417 |
Recovered during the year |
26,159 |
22,004 |
15,061 |
6,128 |
1,562 |
1,595 |
997 |
Written off during the year |
84 |
– |
– |
– |
– |
– |
84 |
As at end-March 2007 |
50,486 |
38,968 |
25,059 |
12,676 |
2,968 |
6,286 |
2,262 |
Net NPAs |
|
|
|
|
|
|
|
As at end-March 2006 |
18,265 |
14,564 |
7,929 |
6,072 |
1,101 |
1,795 |
804 |
As at end-March 2007 |
20,100 |
15,144 |
8,063 |
6,359 |
891 |
3,136 |
927 |
Memo |
|
|
|
|
|
|
|
Gross Advances |
20,12,510 |
14,64,493 |
9,75,733 |
4,88,760 |
94,872 |
3,25,273 |
1,27,872 |
Net Advances |
19,81,216 |
14,40,123 |
9,57,697 |
4,82,426 |
92,890 |
3,21,865 |
1,26,339 |
Ratio |
|
|
|
|
|
|
|
Gross NPAs/Gross Advances |
2.5 |
2.7 |
2.7 |
2.6 |
3.1 |
1.9 |
1.8 |
Net NPAs/Net Advances |
1.0 |
1.1 |
0.9 |
1.3 |
1.0 |
1.0 |
0.7 |
– : Nil/Negligible.
Note : Figures in brackets are the number of banks.
Source : Balance sheets of respective banks. |
Table III.24: NPAs recovered by
SCBs through various Channels |
(Amount in Rs. crore) |
Item |
2005-06 |
2006-07 |
|
No. of cases |
Amount |
Amount |
No. of cases |
Amount |
Amount |
|
referred* |
involved |
Recovered |
referred* |
involved |
Recovered |
1 |
2 |
3 |
4 |
5 |
6 |
7 |
i) |
One-time settlement/ compromise schemes* |
10,262 |
772 |
608 |
– |
– |
– |
ii) |
Lok Adalats |
2,68,090 |
2,144 |
265 |
1,60,368 |
758 |
106 |
iii) |
DRTs |
3,534 |
6,273 |
4,735 |
4,028 |
9,156 |
3,463 |
|
|
|
|
|
|
|
|
iv) |
SARFAESI Act |
41,180 # |
8,517 |
3,363 |
60,178 # |
9,058 |
3,749 |
# : Number of notices issued under Section 13(2) of the SARFAESI Act.
* : The scheme for OTS for SME accounts by public
sector banks was closed as on June 30, 2006. |
gross NPAs of PSBs (particularly, nationalised banks) and old private sector banks declined during the year, those of new private sector banks, foreign banks and State Bank group showed an increase. The overall gross NPAs of SCBs, which had declined sharply by Rs.8,276 crore during 2005-06, declined by Rs.611 crore in 2006-07. Gross NPAs as percentage of gross advances declined to 2.5 per cent from 3.3 per cent at end-March 2006.
3.78 Among the several channels of recovery available to banks for dealing with bad loans, the debt recovery tribunals (DRTs) and the SARFAESI Act have been the most effective in terms of amount recovered (Table III.24). The number of cases referred to the Lok Adalats remained the largest. The amount recovered under Lok Adalats and DRTs during 2006-07, however, was lower than the previous year.
3.79 In the case of direct agricultural advances, the recovery rate improved to 80.1 per cent for the year-ended June 2006 from 78.6 per cent in the last year (Table III.25).
Table III.25: Recovery of Direct Agricultural |
Advances of PSBs |
|
|
|
(Amount in Rs. crore) |
June-end |
Demand |
Recovery |
Overdues |
Percentage of
Recovery to
Demand |
1 |
2 |
3 |
4 |
5 |
2004 |
33,544 |
25,002 |
8,542 |
74.5 |
2005 |
45,454 |
35,733 |
9,721 |
78.6 |
2006 |
46,567 |
37,298 |
9,269 |
80.1 |
3.80 The Reserve Bank has so far issued certificate of registration (CoR) to six securitisation companies/reconstruction companies (SCs/ RCs), of which three have commenced their operations. At end-June 2007, the book value of total amount of assets acquired by SCs/RCs registered with the Reserve Bank stood at Rs.28,544 crore. The security receipts subscribed to by banks amounted to Rs.6,894 crore. The security receipts redeemed amounted to Rs.660 crore (Table III.26).
Movements in Provisions for Non-performing Assets
3.81 Provisioning for non-performing assets tends to follow a cyclical pattern. Although gross NPAs in absolute terms declined, net NPAs increased, reflecting the higher write back of excess provisioning than the fresh provisioning made during the year. This trend was observed across all bank groups, barring new private sector
Table III.26: Details of Financial Assets |
Securitised by SCs/RCs |
(As on June 30, 2007) |
Item |
Amount in Rs. crore |
1. |
Book Value of Assets Acquired |
28,543.6 |
2. |
Security Receipts issued |
7,436.0 |
3. |
Security Receipts subscribed by |
|
|
(a) Banks |
6,894.2 |
|
(b) SCs/RCs |
408.3 |
|
(c) FIIs |
– |
|
(d) Others |
133.6 |
4. |
Amount of Security Receipts completely redeemed |
659.6 |
– : Nil/Negligible. |
banks and foreign banks. Cumulative provisions at end-March 2007 were, thus, lower than their respective levels a year ago in respect of all bank groups, except new private sector banks and foreign banks. Cumulative provisions as percentage of gross NPAs declined marginally to 56.1 per cent at end-March 2007 from 58.9 per cent at end-March 2006. Bank-group wise, the ratio was the highest for old private sector banks (66.0 per cent), followed by PSBs, foreign banks and new private sector banks (Table III.27 and Appendix Table III.24).
3.82 Despite increase in net NPAs in absolute terms, net NPAs as percentage of net advances declined marginally to 1.0 per cent from 1.2 per cent at end-March 2006. Similar trend in the gross and net NPA ratios was observed for all bank-groups, except new private sector banks, which recorded an increase in the NPA ratios both in gross and net terms [Table III.28 and Appendix III.25 and 26].
3.83 The net NPAs to net advances ratio was close to 1.0 per cent at end-March 2007 for all bank-groups, except foreign banks (0.7 per cent). Between end-March 2006 and end-March 2007, the net NPA ratio of public sector and old private sector banks declined, while it increased in respect of new private sector banks leading to convergence of net NPA ratio at the bank-group level. The deviation in net NPA ratio at the individual bank level narrowed down significantly during the year. The net NPAs to net advances ratio at end-March 2007 of 75 banks (as against 65 last year) out of 82 (as against 85 last year) was less than 2 per cent. The net NPAs ratio of only two banks was higher than 5 per cent, of which the net NPA ratio of one foreign bank was higher than 10 per cent (Table III.29). During 2006-07, the net NPA ratio of twenty three banks in the public sector and fifteen banks in the private sector improved (Appendix Tables III.27 and 28).
3.84 The data on loan asset categories suggest further improvement in the asset quality of SCBs during 2006-07. While the share of standard assets in total advances increased to 97.5 per cent from 96.7 per cent at end-March 2006, the share of ‘sub-standard’ loans remained stable at a low level of 1.0 per cent. The share of ‘doubtful’ and ‘loss’ categories, however, declined. In these two categories (‘loss’ and ‘doubtful’), NPAs declined in absolute terms as well. More or less similar trend was observed across all bank groups, except new private sector banks and foreign banks in whose case NPAs in all the three categories (substandard, doubtful and loss) generally increased (Table III.30). Thus, the asset quality of new private sector banks, though comfortable, showed some signs of weakening.
Table III.27: Movements in Provisions for
Non-performing Assets – Bank Group-wise |
(Amount in Rs. crore) |
Item |
Scheduled Commercial |
Public Sector |
Nationalised Banks |
State Bank |
Old Private Sector |
New Private Sector |
Foreign Banks |
|
Banks |
Banks |
(19) |
Group |
Banks |
Banks |
(29) |
|
(82) |
(28) |
|
(8) |
(17) |
(8) |
|
1 |
2 |
3 |
4 |
5 |
6 |
7 |
8 |
Provision for NPAs |
|
|
|
|
|
|
|
As at end-March 2006 |
30,226 |
25,024 |
18,078 |
6,393 |
1,992 |
2,214 |
994 |
Add : Provision made during the year |
10,401 |
7,289 |
4,956 |
1,804 |
520 |
2,110 |
481 |
Less : Write-off, write back of excess during the year |
12,284 |
10,174 |
7,693 |
1,909 |
553 |
1,236 |
320 |
As at end-March 2007 |
28,343 |
22,139 |
15,341 |
6,288 |
1,959 |
3,087 |
1,156 |
Memo: |
|
|
|
|
|
|
|
Gross NPAs |
50,486 |
38,968 |
26,291 |
12,677 |
2,968 |
6,286 |
2,262 |
Ratio |
|
|
|
|
|
|
|
Cumulative Provision to Gross NPAs (per cent) |
56.1 |
56.8 |
58.4 |
49.6 |
66.0 |
49.1 |
51.1 |
Note : Figures in brackets indicates the number of banks in that group for 2005-06.
Source: Balance sheets of respective banks. |
Table III.28: Gross and Net NPAs of Scheduled
Commercial Banks – Bank Group-wise |
(As at end-March) |
(Amount in Rs. crore) |
Bank Group/Year |
Gross Advances |
Gross NPAs |
Net Advances |
Net NPAs |
|
|
Amount |
Per cent to |
Per cent to |
|
Amount |
Per cent to Per cent to |
|
|
|
Gross Advances |
total Assets |
|
|
Net Advances |
total Assets |
1 |
2 |
3 |
4 |
5 |
6 |
7 |
8 |
9 |
Scheduled Commercial Banks |
|
|
|
|
|
|
|
|
2004 |
9,02,026 |
64,812 |
7.2 |
3.3 |
8,62,643 |
24,396 |
2.8 |
1.2 |
2005 |
11,52,682 |
59,373 |
5.2 |
2.5 |
11,15,663 |
21,754 |
2.0 |
0.9 |
2006 |
15,51,378 |
51,097 |
3.3 |
1.8 |
15,16,811 |
18,543 |
1.2 |
0.7 |
2007 |
20,12,510 |
50,486 |
2.5 |
1.5 |
19,81,216 |
20,101 |
1.0 |
0.6 |
Public Sector Banks |
|
|
|
|
|
|
|
|
2004 |
6,61,975 |
51,537 |
7.8 |
3.5 |
6,31,383 |
19,335 |
3.1 |
1.3 |
2005 |
8,77,825 |
48,399 |
5.5 |
2.7 |
8,48,912 |
16,904 |
2.1 |
1.0 |
2006 |
11,34,724 |
41,358 |
3.6 |
2.1 |
11,06,288 |
14,566 |
1.3 |
0.7 |
2007 |
14,64,493 |
38,968 |
2.7 |
1.6 |
14,40,123 |
15,145 |
1.1 |
0.6 |
Old Private Sector Banks |
|
|
|
|
|
|
|
|
2004 |
57,908 |
4,398 |
7.6 |
3.6 |
55,648 |
2,142 |
3.8 |
1.8 |
2005 |
70,412 |
4,200 |
6.0 |
3.1 |
67,742 |
1,859 |
2.7 |
1.4 |
2006 |
85,154 |
3,759 |
4.4 |
2.5 |
82,957 |
1,375 |
1.7 |
0.9 |
2007 |
94,872 |
2,969 |
3.1 |
1.8 |
92,890 |
891 |
1.0 |
0.6 |
New Private Sector Banks |
|
|
|
|
|
|
|
|
2004 |
1,19,511 |
5,983 |
5.0 |
2.4 |
1,15,106 |
1,986 |
1.7 |
0.8 |
2005 |
1,27,420 |
4,582 |
3.6 |
1.6 |
1,23,655 |
2,353 |
1.9 |
0.8 |
2006 |
2,32,536 |
4,052 |
1.7 |
1.0 |
2,30,005 |
1,796 |
0.8 |
0.4 |
2007 |
3,25,273 |
6,287 |
1.9 |
1.1 |
3,21,865 |
3,137 |
1.0 |
0.5 |
Foreign Banks |
|
|
|
|
|
|
|
|
2004 |
62,632 |
2,894 |
4.6 |
2.1 |
60,506 |
933 |
1.5 |
0.7 |
2005 |
77,026 |
2,192 |
2.8 |
1.4 |
75,354 |
639 |
0.8 |
0.4 |
2006 |
98,965 |
1,928 |
1.9 |
1.0 |
97,562 |
808 |
0.8 |
0.4 |
2007 |
1,27,872 |
2,263 |
1.8 |
0.8 |
1,26,339 |
927 |
0.7 |
0.3 |
Source : Balance sheets of respective banks. |
Sector-wise NPAs
3.85 The consolidated statement of public and private sector banks with respect to sector-wise NPA indicates that the NPAs in the priority sector increased during 2006-07. This was mainly due to increase in NPAs in the agriculture sector, while NPAs in the SSI sector declined. The NPAs in the public sector also increased during the year. However, NPAs in the non-priority sector declined during 2006-07. At the aggregate level, the share of priority sector NPAs was the highest at 54.1 per cent, of which priority sector NPAs other than agriculture and SSIs constituted almost a quarter (25.1 per cent) of the total NPAs. The share of non-priority sector NPAs was 44.9 per cent during 2006-07 (Table III.31) [Appendix Table III.29 (A) and 29 (B); and Appendix Table 30 (A) and 30 (B)].
Movements in Provisions for Depreciation on Investments
3.86 The provisions for depreciation on investments at end-March 2007 were 23.3 per cent lower from the level a year ago. Provisions made during the year were far lower than the write-offs and write-back of excess provisions, which
Table III.29: Distribution of Scheduled Commercial
Banks by Ratio of Net NPAs to Net Advances |
(Number of banks) |
Bank Group |
As at end-March |
|
2003 |
2004 |
2005 |
2006 |
2007 |
1 |
2 |
3 |
4 |
5 |
6 |
Public Sector Banks |
27 |
27 |
28 |
28 |
28 |
Up to 2 per cent |
4 |
11 |
19 |
23 |
27 |
Above 2 and up to 5 per cent |
14 |
13 |
7 |
5 |
1 |
Above 5 and up to 10 per cent |
7 |
3 |
2 |
– |
– |
Above 10 per cent |
2 |
– |
– |
– |
– |
Old Private Sector Banks |
20 |
20 |
20 |
20 |
17 |
Up to 2 per cent |
2 |
2 |
4 |
11 |
15 |
Above 2 and up to 5 per cent |
4 |
9 |
12 |
7 |
1 |
Above 5 and up to 10 per cent |
12 |
7 |
4 |
2 |
1 |
Above 10 per cent |
2 |
2 |
– |
– |
– |
New Private Sector Banks |
9 |
10 |
9 |
8 |
8 |
Up to 2 per cent |
2 |
4 |
5 |
6 |
7 |
Above 2 and up to 5 per cent |
2 |
5 |
3 |
2 |
1 |
Above 5 and up to 10 per cent |
4 |
– |
1 |
– |
– |
Above 10 per cent |
1 |
1 |
– |
– |
– |
Foreign Banks |
36 |
33 |
31 |
29 |
29 |
Up to 2 per cent |
19 |
22 |
23 |
25 |
27 |
Above 2 and up to 5 per cent |
3 |
2 |
2 |
– |
1 |
Above 5 and up to 10 per cent |
6 |
3 |
2 |
– |
– |
Above 10 per cent |
8 |
6 |
4 |
4 |
1 |
– : Nil/Negligible. |
resulted in sharp reduction in the provisions at end-March 2007. This reduction in provisions was despite increase in investments witnessed in the year (Table III.32).
Capital Adequacy
3.87 The overall CRAR of all SCBs remained at the previous year’s level of 12.3 per cent, suggesting that the increase in capital kept pace with the sharp increase in risk-weighted assets. The increase in risk-weighted assets was mainly due to the rapid growth of credit. To an extent, the increase in risk-weighted assets was also on account of increase in the risk weights by the Reserve Bank on certain categories of advances as a prudential measure to protect the balance sheets of banks during the phase of rapid credit expansion. The CRAR at 12.3 per cent was placed significantly above the stipulated minimum of 9.0 per cent (Table III.33).
3.88 Tier I capital ratio declined somewhat to 8.3 per cent at end-March 2007 from 9.3 per cent a year ago. This was mainly due to relatively slower growth of reserves and surplus, while paid-up capital increased significantly. However, the Tier II capital increased significantly in contrast to decline in the last year. As a result, the Tier II CRAR increased to 4.0 per cent from 3.1 per cent last year (Chart III.19). Despite the decline during the year, Tier I CRAR at 8.3 per cent was more than the present requirement of 4.5 per cent and also above the 6.0 per cent norm prescribed in the final guidelines for implementation of Basel II released by the Reserve Bank on April 27, 2007.
3.89 Among bank groups, the CRAR of PSBs and old private sector banks improved, while that of new private sector banks and foreign banks declined. The CRAR of new private sector banks, which had improved in the previous year, declined below the industry average at end-March 2007;
Table III.30: Classification of Loan Assets – Bank Group-wise |
(As at end-March) |
(Amount in Rs. crore) |
Bank Group/Year |
Standard
Assets |
Sub-standard Assets |
Doubtful Assets |
Loss
Assets |
Total
NPAs |
Total Advances |
|
Amount |
per cent |
Amount |
per cent |
Amount |
per cent |
Amount |
per cent |
Amount |
per cent |
Amount |
1 |
2 |
3 |
4 |
5 |
6 |
7 |
8 |
9 |
10 |
11 |
12 |
Scheduled
Commercial Banks |
|
|
|
|
|
|
|
|
|
|
2004 |
8,37,130 |
92.9 |
21,026 |
2.3 |
36,247 |
4.0 |
7,625 |
0.9 |
64,898 |
7.2 |
9,02,027 |
2005 |
10,93,523 |
94.9 |
14,016 |
1.2 |
37,763 |
3.3 |
7,382 |
0.6 |
59,161 |
5.1 |
11,52,684 |
2006 |
14,99,431 |
96.7 |
14,826 |
1.0 |
30,105 |
2.0 |
7,016 |
0.4 |
51,947 |
3.3 |
15,51,378 |
2007 |
19,61,877 |
97.5 |
20,010 |
1.0 |
24,408 |
1.2 |
6,215 |
0.3 |
50,633 |
2.5 |
20,12,510 |
Public Sector Banks |
|
|
|
|
|
|
|
|
|
|
|
2004 |
6,10,435 |
92.2 |
16,909 |
2.5 |
28,756 |
4.4 |
5,876 |
0.9 |
51,541 |
7.8 |
6,61,975 |
2005 |
8,30,029 |
94.6 |
11,068 |
1.3 |
30,779 |
3.5 |
5,929 |
0.7 |
47,796 |
5.4 |
8,77,825 |
2006 |
10,92,607 |
96.2 |
11,453 |
1.0 |
25,028 |
2.2 |
5,636 |
0.5 |
42,117 |
3.7 |
11,34,724 |
2007 |
14,25,519 |
97.3 |
14,275 |
1.0 |
19,873 |
1.4 |
4,826 |
0.3 |
38,974 |
2.7 |
14,64,493 |
Old Private Sector Banks |
|
|
|
|
|
|
|
|
|
|
|
2004 |
53,516 |
92.4 |
1,161 |
2.0 |
2,727 |
4.7 |
504 |
0.9 |
4,392 |
7.6 |
57,908 |
2005 |
66,212 |
94.0 |
784 |
1.1 |
2,868 |
4.0 |
549 |
0.8 |
4,201 |
6.0 |
70,413 |
2006 |
81,414 |
95.6 |
710 |
0.8 |
2,551 |
3.0 |
479 |
0.6 |
3,740 |
4.4 |
85,154 |
2007 |
91,903 |
96.9 |
760 |
0.8 |
1,783 |
1.9 |
425 |
0.4 |
2,969 |
3.1 |
94,872 |
New Private Sector Banks |
|
|
|
|
|
|
|
|
|
|
|
2004 |
1,13,560 |
95.0 |
1,966 |
1.6 |
3,665 |
3.0 |
321 |
0.3 |
5,952 |
5.0 |
1,19,512 |
2005 |
1,22,577 |
96.2 |
1,449 |
1.1 |
3,061 |
2.4 |
334 |
0.3 |
4,844 |
3.8 |
1,27,421 |
2006 |
2,28,504 |
98.3 |
1,717 |
0.7 |
1,855 |
0.8 |
460 |
0.2 |
4,032 |
1.8 |
2,32,536 |
2007 |
3,19,002 |
98.1 |
3,608 |
1.1 |
2,147 |
0.7 |
516 |
0.2 |
6,271 |
1.9 |
3,25,273 |
Foreign Banks |
|
|
|
|
|
|
|
|
|
|
|
2004 |
59,619 |
95.1 |
990 |
1.6 |
1,099 |
1.8 |
924 |
1.5 |
3,013 |
4.8 |
62,632 |
2005 |
74,705 |
97.0 |
715 |
1.0 |
1,035 |
1.3 |
570 |
0.7 |
2,320 |
3.0 |
77,025 |
2006 |
96,907 |
98.0 |
946 |
1.0 |
670 |
0.7 |
441 |
0.5 |
2,057 |
2.0 |
98,965 |
2007 |
1,25,453 |
98.1 |
1,367 |
1.1 |
605 |
0.5 |
447 |
0.3 |
2,419 |
1.9 |
1,27,872 |
Note : Constituent items may not add up to the total due to rounding off.
Source : DBS Returns (BSA) submitted by respective banks. |
the CRAR of old private sector banks remained below the industry average, while that of PSBs (both nationalised banks and the SBI group) and foreign banks was at/above the industry average.
Table III.31: Sector-wise NPAs – Bank Group-wise* |
(Amount in Rs. crore) |
Sector |
Public Sector
Banks |
Old Private Sector Banks |
New Private Sector Banks |
All SCBs |
|
2005-06 |
2006-07 |
2005-06 |
2006-07 |
2005-06 |
2006-07 |
2005-06 |
2006-07 |
1 |
2 |
3 |
4 |
5 |
6 |
7 |
8 |
9 |
A. |
Priority Sector |
22,374 |
22,954 |
1,632 |
1,416 |
652 |
1,468 |
24,658 |
25,838 |
|
i) |
Agriculture |
6,203 |
6,506 |
265 |
249 |
250 |
612 |
6,718 |
7,367 |
|
ii) |
Small Scale Industries |
6,917 |
5,843 |
656 |
490 |
152 |
155 |
7,725 |
6,488 |
|
iii) |
Others |
9,253 |
10,604 |
711 |
677 |
251 |
702 |
10,215 |
11,983 |
B. |
Public Sector |
340 |
490 |
1 |
– |
3 |
3 |
345 |
493 |
C. |
Non-Priority Sector |
18,664 |
15,158 |
2,078 |
1,553 |
3,463 |
4,800 |
24,205 |
21,510 |
Total (A+B+C) |
41,378 |
38,602 |
3,711 |
2,969 |
4,118 |
6,271 |
49,208 |
47,841 |
* : Excluding foreign banks.
– : Nil/Negligible.
Source : Based on off-site returns submitted by banks. |
Table III.32: Movements in Provisions for
Depreciation on Investment – Bank Group-wise |
(Amount in Rs. crore) |
Item |
Scheduled |
Public |
Nationalised |
State |
Old Private |
New Private |
Foreign |
|
Commercial |
Sector |
Banks |
Bank |
Sector |
Sector |
Banks |
|
Banks |
Banks |
(19) |
Group |
Banks |
Banks |
(29) |
|
(82) |
(28) |
|
(8) |
(17) |
(8) |
|
1 |
2 |
3 |
4 |
5 |
6 |
7 |
8 |
Provision for Depreciation on Investment |
|
|
|
|
|
|
|
As at end-March 2006 |
16,278 |
13,761 |
4,924 |
8,584 |
361 |
697 |
1,459 |
Add : Provision made during the year |
4,858 |
4,157 |
2,895 |
1,223 |
213 |
206 |
281 |
Less :Write-off, write-back of excess during the year |
8,660 |
8,154 |
1,334 |
6,750 |
136 |
85 |
286 |
As at end-March 2007 |
12,476 |
9,764 |
6,485 |
3,057 |
439 |
819 |
1,454 |
Note : Figures in brackets indicate the number of banks for 2005-06.
Source : Balance sheets of respective banks. |
The CRAR of foreign banks, which usually remained much above the other bank groups, declined from 13.0 per cent at end-March 2006 to 12.4 per cent at end-March 2007 to converge with the industry average (Table III.34). The CRAR of new private sector banks and foreign banks declined on account of high growth of risk-weighted assets as they have relatively larger
Table III.33: Scheduled Commercial Banks –
Component-wise CRAR |
(As at end-March) |
(Amount in Rs. crore) |
Item / Year |
2005 |
2006 |
2007 |
1 |
2 |
3 |
4 |
A. |
Capital Funds (i+ii) |
1,65,928 |
2,21,363 |
2,96,191 |
|
i) |
Tier I Capital |
1,08,949 |
1,66,538 |
2,00,386 |
|
|
of which: |
|
|
|
|
|
Paid up Capital |
25,724 |
25,142 |
29,462 |
|
|
Reserves |
91,320 |
1,41,592 |
1,64,077 |
|
|
Unallocated/Remittable |
|
|
|
|
|
Surplus |
6,937 |
11,075 |
20,387 |
|
|
Deductions for Tier-I |
|
|
|
|
|
Capital |
15,031 |
11,271 |
13,662 |
|
ii) |
Tier-II Capital |
56,979 |
54,825 |
95,794 |
|
|
of which: |
|
|
|
|
|
Discounted |
|
|
|
|
|
Subordinated Debt |
26,291 |
43,214 |
63,834 |
B. |
Risk-weighted Assets |
12,96,223 |
17,97,207 |
24,12,236 |
|
of which: |
|
|
|
|
Risk-weighted Loans and |
|
|
|
|
Advances |
9,19,544 |
12,38,163 |
17,17,810 |
C. |
CRAR (A as per cent of B) |
12.8 |
12.3 |
12.3 |
|
of which: |
|
|
|
|
Tier I |
8.4 |
9.3 |
8.3 |
|
Tier II |
4.4 |
3.1 |
4.0 |
Source : Based on off-site returns submitted by banks. |
exposure to the sensitive sectors to which higher risk weights are applied.
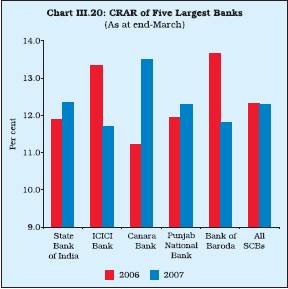
3.90 The CRAR of five largest banks showed a divergent trend from the previous year. During 2005-06, the CRAR of all banks, except ICICI Bank declined. However, during 2006-07, the CRAR of all banks, except ICICI Bank, registered an increase. Of the five largest SCBs, four are in the public sector, while ICICI Bank is in the private sector (Chart III.20).
3.91 At the individual bank level, only Sangli Bank Ltd. could not meet the prescribed CRAR requirement at end-March 2007; it was subsequently amalgamated with ICICI Bank. The
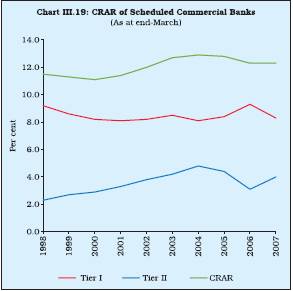
Table III.34: Capital Adequacy Ratio – Bank Group-wise |
(As at end-March 2006) |
(Per cent) |
Bank Group |
2000 |
2001 |
2002 |
2003 |
2004 |
2005 |
2006 |
2007 |
1 |
2 |
3 |
4 |
5 |
6 |
7 |
8 |
9 |
Scheduled Commercial Banks |
11.1 |
11.4 |
12.0 |
12.7 |
12.9 |
12.8 |
12.3 |
12.3 |
Public Sector Banks |
10.7 |
11.2 |
11.8 |
12.6 |
13.2 |
12.9 |
12.2 |
12.4 |
Nationalised Banks |
10.1 |
10.2 |
10.9 |
12.2 |
13.1 |
13.2 |
12.3 |
12.4 |
SBI Group |
11.6 |
12.7 |
13.3 |
13.4 |
13.4 |
12.4 |
11.9 |
12.3 |
Old Private Sector Banks |
12.4 |
11.9 |
12.5 |
12.8 |
13.7 |
12.5 |
11.7 |
12.1 |
New Private Sector Banks |
13.4 |
11.5 |
12.3 |
11.3 |
10.2 |
12.1 |
12.6 |
12.0 |
Foreign Banks |
11.9 |
12.6 |
12.9 |
15.2 |
15.0 |
14.0 |
13.0 |
12.4 |
Source : Based on off-site returns submitted by banks. |
CRAR of as many as 79 banks was above 10 per cent (Table III.35 and Appendix Table III.31). Two banks had CRAR in the range of 9 to 10 per cent. Given the present bank-level CRAR, commercial banks are well poised to meet the Basel II requirements, which would become fully operational by end-March 2009.
6. Banks’ Operations in the Capital Market
Resources raised by Banks from the Primary Capital Market
3.92 Resources raised by scheduled commercial banks, both in the public and private sectors, from the domestic primary market declined sharply during 2006-07. Total resource mobilisation by banks through public issues (excluding offer for sale) in the domestic equity market declined by 90.4 per cent to Rs.1,066 crore during 2006-07. Despite good performance
Table III.35: Distribution of Scheduled
Commercial Banks by CRAR |
(Number of banks) |
Bank Group |
2005-06 |
2006-07 |
|
Below |
Between |
Between |
Above |
Below |
Between |
Between |
Above |
|
4 per
cent |
4-9 per cent |
9-10 per
cent |
10 per
cent |
4 per
cent |
4-9 per
cent |
9-10 per cent |
10 per
cent |
1 |
2 |
3 |
4 |
5 |
6 |
7 |
8 |
9 |
Nationalised Banks* |
– |
– |
– |
20 |
– |
– |
– |
20 |
State Bank Group |
– |
– |
– |
8 |
– |
– |
– |
8 |
Old Private Sector Banks |
3 |
– |
1 |
16 |
1 |
– |
2 |
14 |
New Private Sector Banks |
– |
– |
1 |
7 |
– |
– |
– |
8 |
Foreign Banks |
– |
– |
2 |
27 |
– |
– |
– |
29 |
Total |
3 |
– |
4 |
78 |
1 |
– |
2 |
79 |
– : Nil/Negligible.
* : Includes data for other public sector banks.
Source : Based on off-site returns submitted by banks. |
Table III.36: Public Issues by the Banking Sector |
(Amount in Rs. crore) |
Year |
Public Sector Banks |
Private Sector Banks |
Total |
Grand Total |
|
Equity |
Debt |
Equity |
Debt |
Equity |
Debt |
|
1 |
2 |
3 |
4 |
5 |
6 |
7 |
8 |
2003-04 |
1,104 |
– |
– |
1,352 |
1,104 |
1,352 |
2,456 |
2004-05 |
3,336 |
– |
4,108 |
1,478 |
7,444 |
1,478 |
8,922 |
2005-06 |
5,413 |
– |
5,654 |
– |
11,067 |
– |
11,067 |
2006-07 |
782 |
– |
284 |
– |
1,066 |
– |
1,066 |
–: Nil/Negligible. |
of banking scrips in the secondary market, robust corporate financial results of banks and increased need to raise capital in the face of the ensuing implementation of Basel II norms, only three banks raised capital from the equity market during 2006-07 for an aggregate amount of Rs.1,066 crore. One issue of Rs.782 crore (including premium) was floated by a public sector bank and two equity issues aggregating Rs.284 crore were floated by private sector banks (Table III.36).
3.93 An issue by a public sector bank (Indian Bank) was at a premium of Rs.81 per share for an aggregate amount of Rs.782 crore. Two issues by private sector banks, viz., Development Bank Ltd. and Laxmi Vilas Bank Ltd. were at premium of Rs.16 and Rs.40 per share, respectively, for an aggregate amount of Rs.186 crore and Rs.98 crore, respectively (Table III.37).
3.94 Resources raised by banks through debt issues in the private placement market increased marginally by 2.8 per cent to Rs.30,994 crore during 2006-07 (Table III.38).
Table III.37: Resources Raised by Public Sector |
Banks through Public Issues-2006-07 |
Name of the Bank |
Face |
Issue |
Size of issue |
|
Value
(Rs.) |
Price(Rs.) |
(Rs. crore) |
|
|
|
Amount |
Premium |
Total |
1 |
2 |
3 |
4 |
5 |
6 |
Public Sector Bank |
|
|
|
|
|
Indian Bank |
10 |
91 |
86 |
696 |
782 |
Total |
|
|
|
|
|
(Public Sector Banks) |
|
|
|
|
782 |
Private Sector Banks |
|
|
|
|
|
Development Bank Ltd. |
10 |
26 |
72 |
114 |
186 |
Laxmi Vilas Bank Ltd. |
10 |
50 |
19 |
79 |
98 |
Total |
|
|
|
|
|
(Private Sector Banks) |
|
|
|
|
284 |
Performance of Banking Stocks in the Secondary Market
3.95 The stock markets in India witnessed buoyant conditions in the last few years on the back of strong FIIs inflows, driven mainly by robust macroeconomic fundamentals, encouraging business outlook and improvement in corporate profitability. The Indian stock markets posted further gains during the financial year 2006-07 amidst intermittent corrections. The benchmark index, the BSE Sensex at 13072.10 at end-March 2007 recorded gains of 15.9 per cent over its end-March 2006 level (11279.96) on top of an increase of 73.7 per cent in 2005-06.
3.96 In line with the general uptrend, banking sector stocks also remained firm during 2006-07 [Chart III.21(a) and Chart III.21(b)]. Apart from favourable macroeconomic fundamentals, bank stocks were driven by some sector-specific developments. The progress of the banking sector reforms along with improvement in banks’ balance sheets due to robust financial results led to increased interest in bank stocks. Banking sector scrips gained due to several other factors also such as strong growth in non-food bank credit, enactment of the RBI (Amendment) Bill 2006
Table III.38: Resources Raised by Banks |
through Private Placements |
(Amount in Rs. crore) |
Category |
2005-06 |
2006-07 |
|
No. of |
Amount |
No. of |
Amount |
|
Issues |
Raised |
Issues |
Raised |
1 |
2 |
3 |
4 |
5 |
Private Sector Banks |
24 |
7,834 |
45 |
9,730 |
Public Sector Banks |
73 |
22,317 |
45 |
21,264 |
Total |
97 |
30,151 |
90 |
30,994 |
Source : Merchant Bankers and Financial Institutions. |
|
 IST,
IST,


