RbiSearchHeader

Press escape key to go back

Past Searches

Theme
Theme
Text Size
Text Size
S3

RbiAnnouncementWeb

RBI Announcements
RBI Announcements

Asset Publisher

110382353

Order Books, Inventories and Capacity Utilisation Survey on the Manufacturing sector for Q2:2023-24

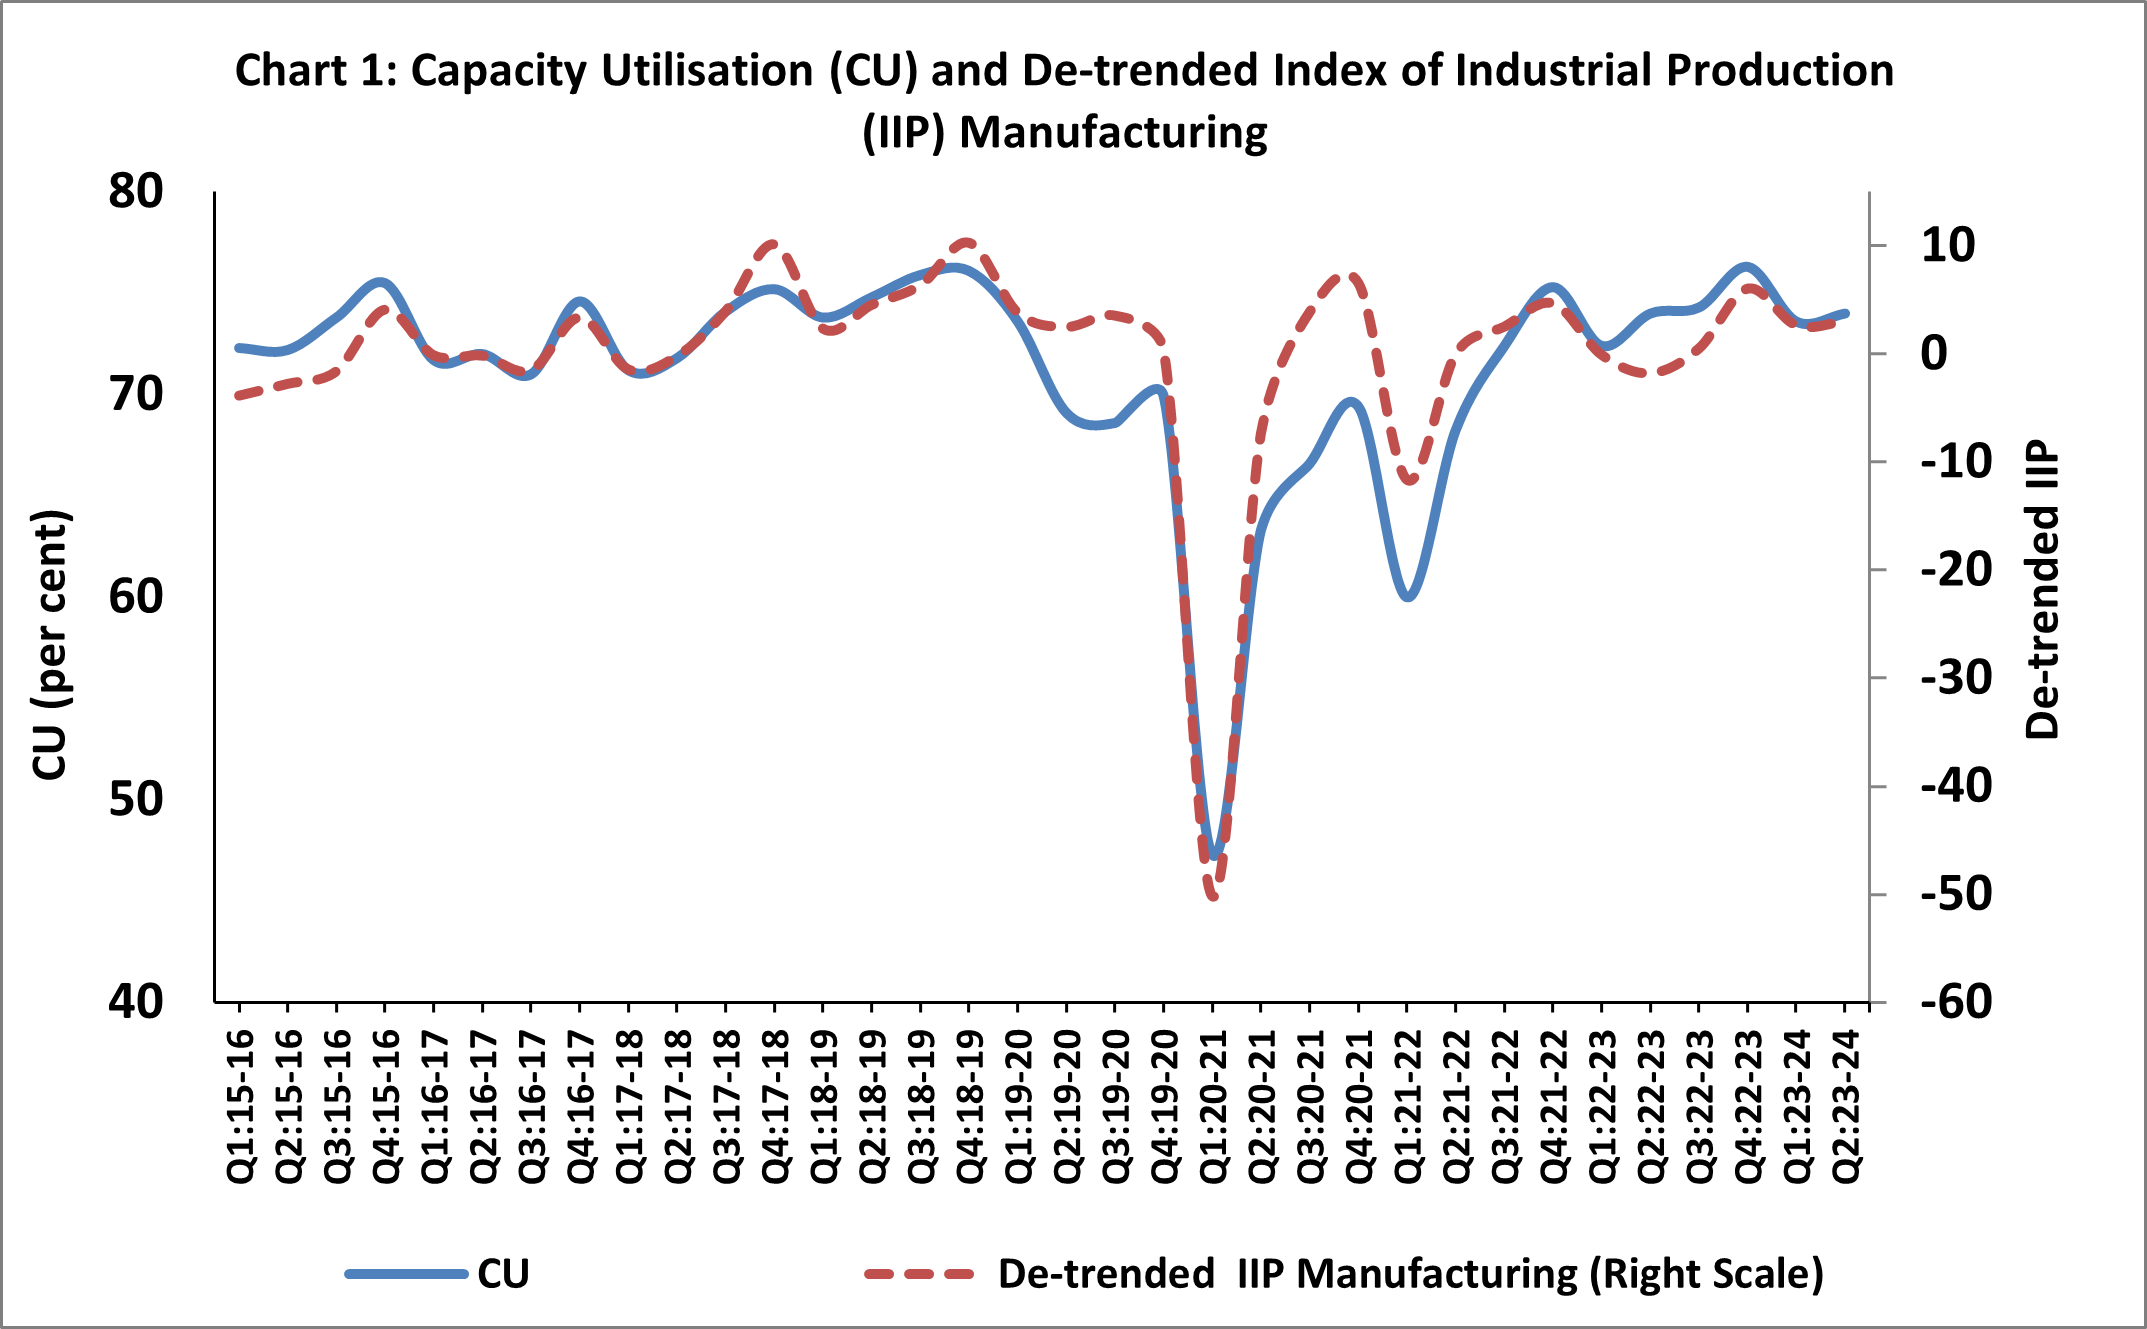
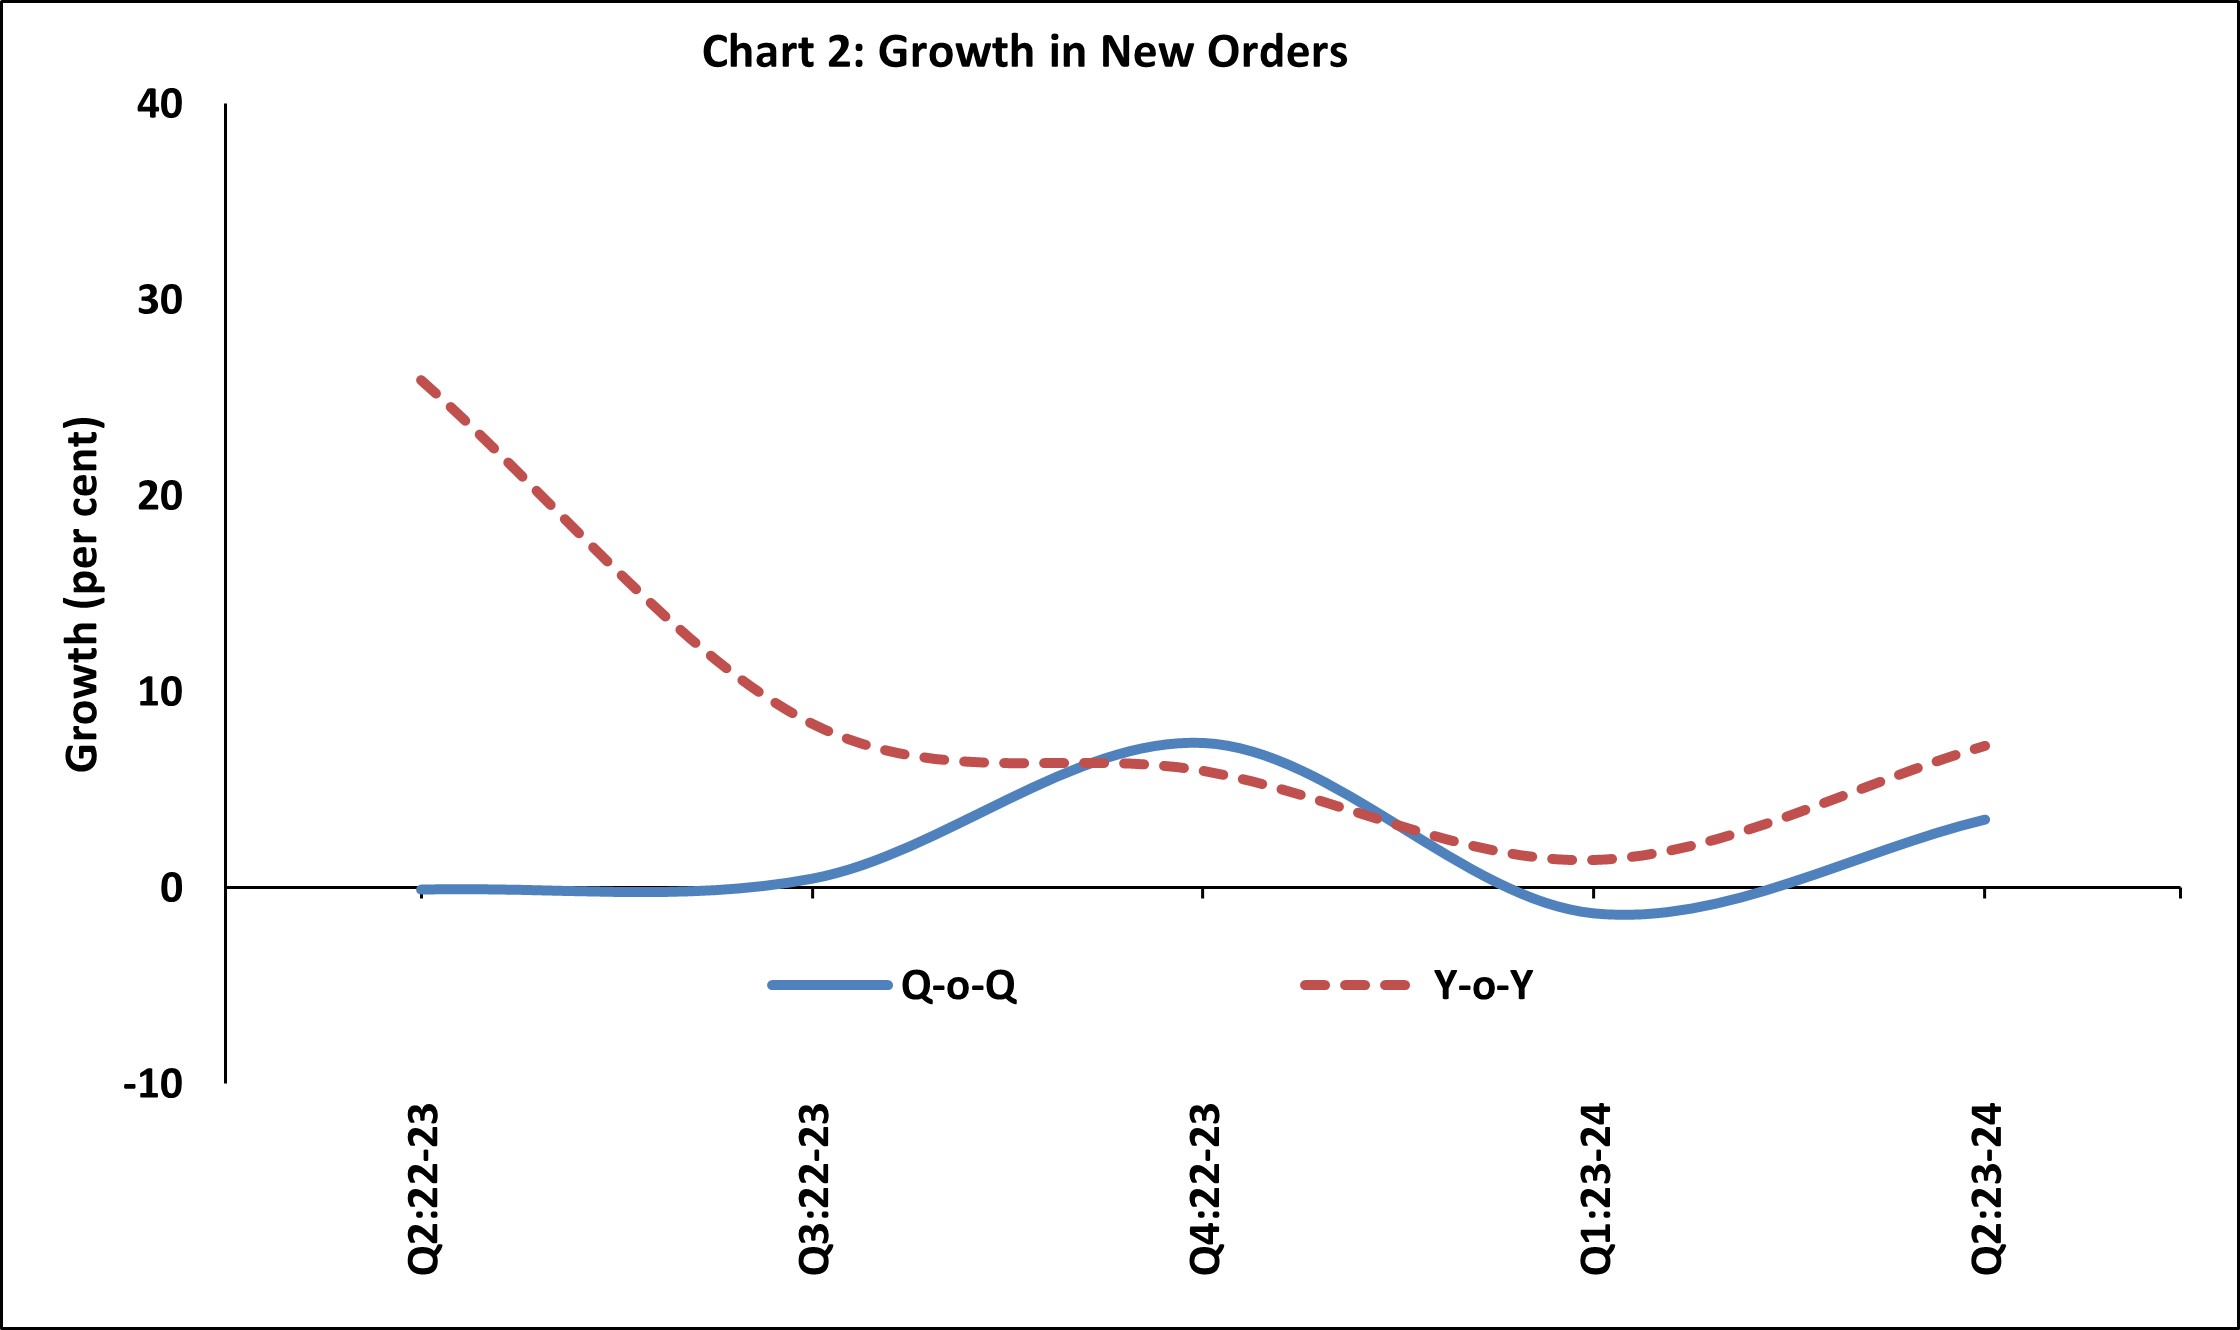
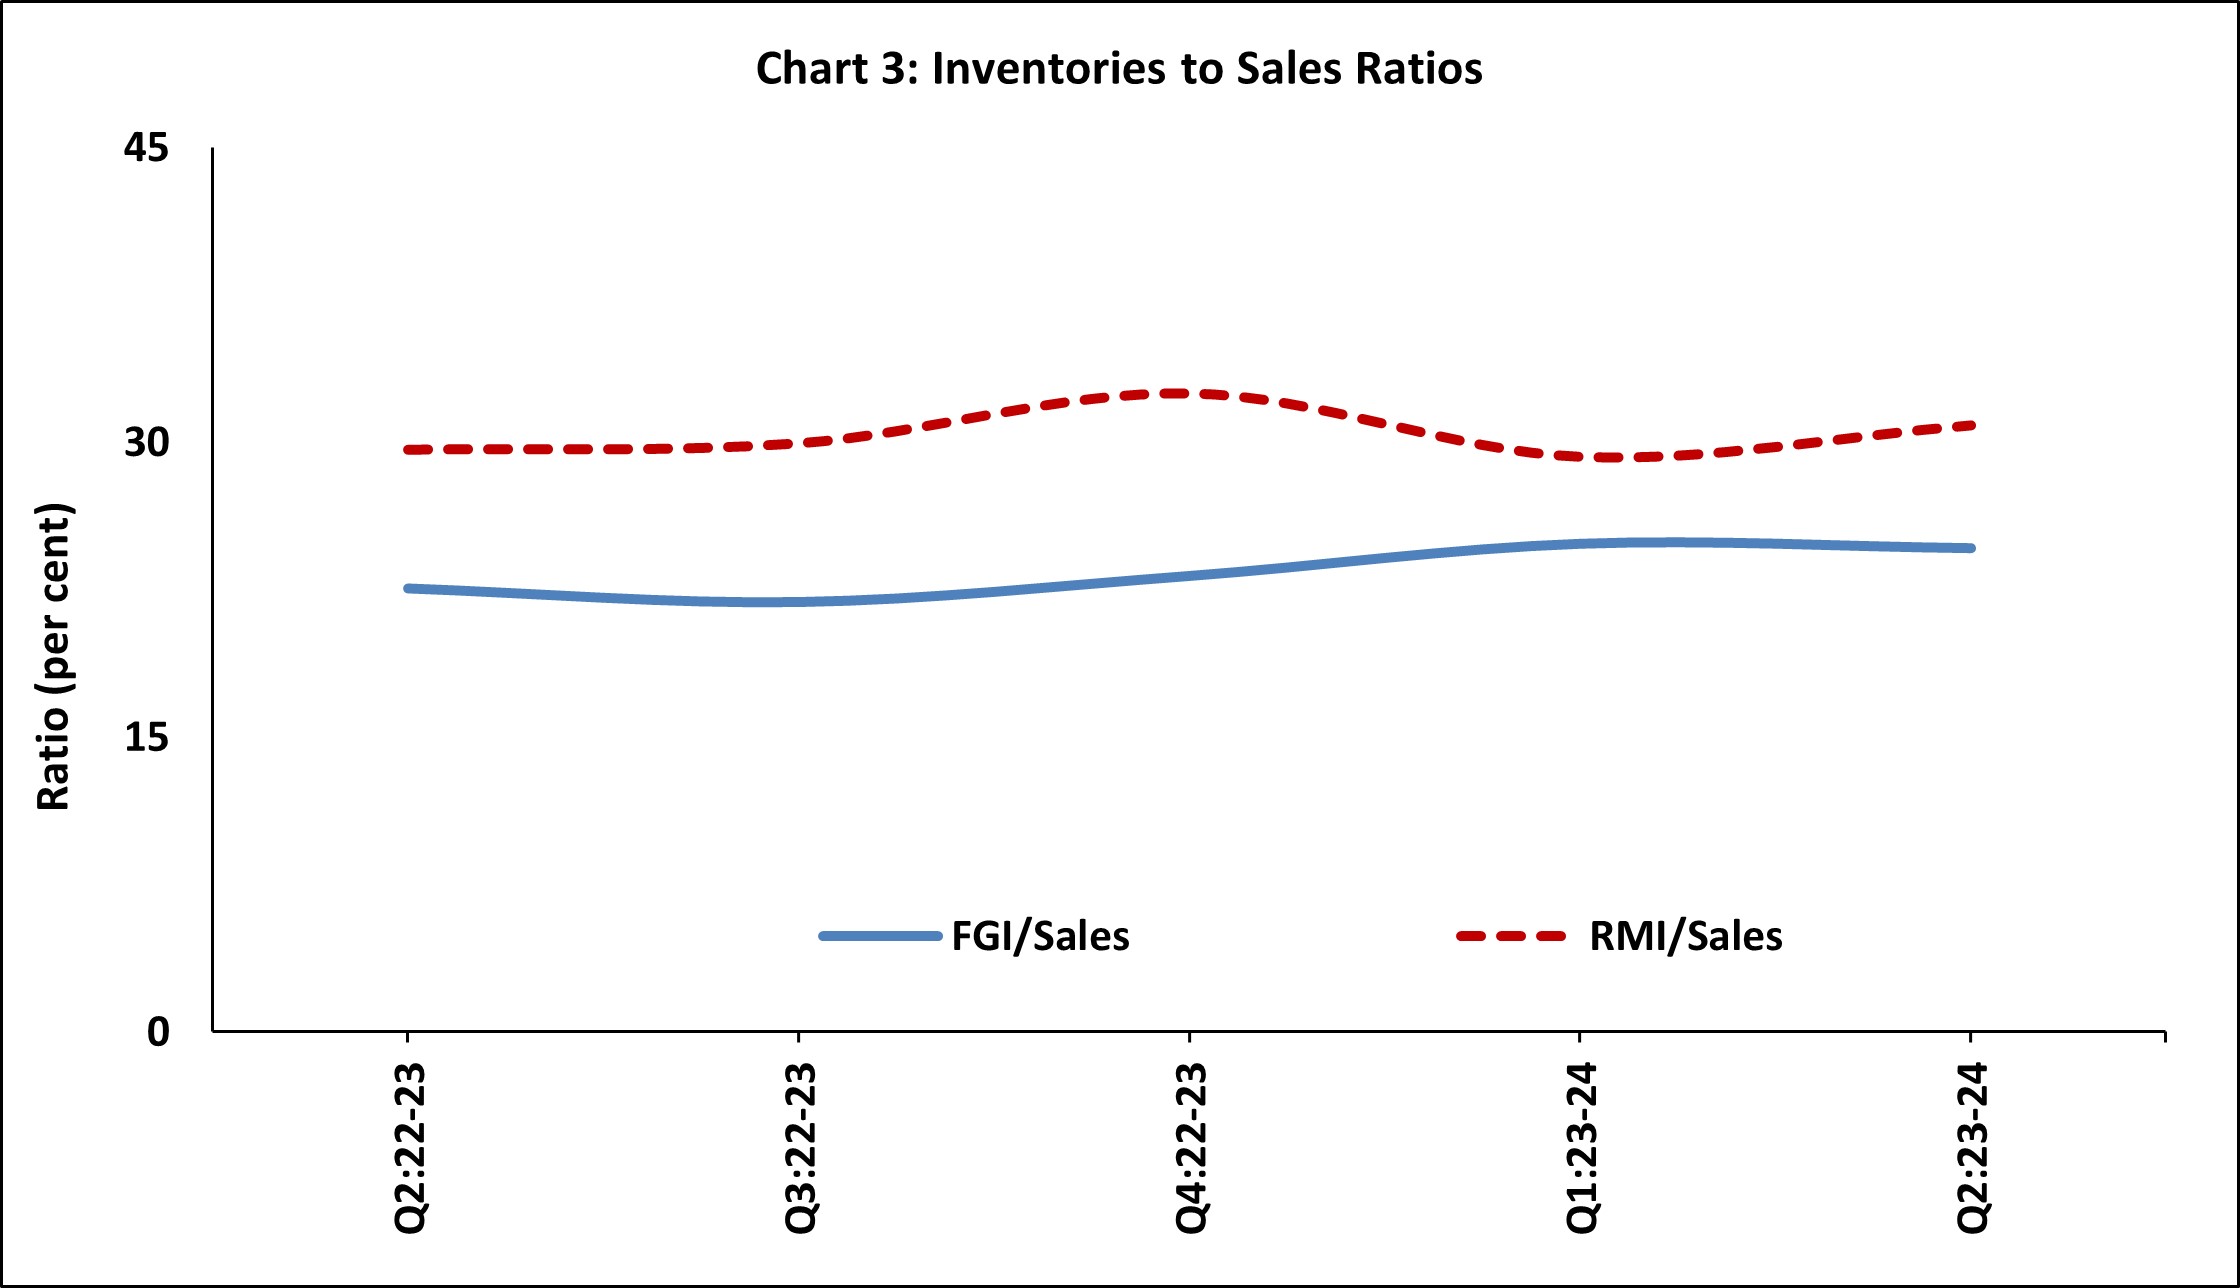
Today, the Reserve Bank released the results of its 63rd round of the quarterly Order Books, Inventories and Capacity Utilisation Survey (OBICUS) conducted during Q3:2023-24 covering 803 manufacturing companies. The survey[1] provides a snapshot of demand conditions in India’s manufacturing sector during July-September 2023.

Highlights:

  • At the aggregate level, the capacity utilisation (CU) in the manufacturing sector increased to 74.0 per cent in Q2:2023-24 from 73.6 per cent in the previous quarter (Chart 1 and Table 1). The seasonally adjusted CU, however, declined to 74.5 per cent in Q2:2023-24 from its level of 75.4 per cent in the previous quarter.
Chart 1
  • Manufacturers reported higher new orders in Q2:2023-24 as compared to the previous quarter as well as the corresponding quarter a year ago (Chart 2 and Table 2A).
Chart 2

  • The raw material inventory (RMI) to sales ratio increased marginally in Q2:2023-24 from its level in the previous quarter while the finished goods inventory (FGI) to sales ratio remained stable (Chart 3 and Table 3A).

Chart 3

Note-Please see the excel file for time series data.

ANNEX 1: Data Tables

Table 1: IIP*-Manufacturing and Capacity Utilisation

Quarter

Number of responding companies

Capacity Utilisation

IIP-Manufacturing

 (Quarterly Average)

De-trended Quarterly IIP-Manufacturing

Q2:2022-23

745

74.0

133.6

-1.8

Q3:2022-23

727

74.3

137.0

0.5

Q4:2022-23

705

76.3

143.5

6.0

  Q1:2023-24

665

73.6

141.2

2.6

Q2:2023-24

752

74.0

142.6

3.0

*: Index of Industrial Production (Base: 2011-12)

Table 2A: Order Books Growth

Quarter

Number of companies

Q-o-Q Growth # (per cent) **

Y-o-Y Growth # (per cent)

 Backlog Orders

New Order Book

Pending Orders

Backlog Orders

New Order Book

Pending Orders

Q2:2022-23

265

4.6

-0.1

10.8

11.4

25.9

20.1

Q3:2022-23

277

1.8

0.5

3.9

14.7

8.4

18.4

Q4:2022-23

261

3.9

7.4

2.9

15.8

6.0

15.3

Q1:2023-24

244

-5.2

-1.3

-4.5

22.7

1.5

9.3

Q2:2023-24

245

3.1

3.5

5.6

24.1

7.3

15.7

#: Growth rates are calculated using three rounds common set of companies, namely, companies responded in the current quarter, one quarter ago and the same quarter a year ago.

 **: Not seasonally adjusted.

Table 2B: Average Size of Order Books

Quarter

Number of companies

Average Amount (` Crores)

Backlog Orders

 New Order Book

Pending Orders

Q2:2022-23

265

208.8

307.9

232.4

Q3:2022-23

277

205.0

212.2

213.1

Q4:2022-23

261

215.6

225.4

221.9

Q1:2023-24

244

212.0

236.2

201.2

Q2:2023-24

245

227.7

248.6

240.4

Table 3A: Inventory to Sales Ratios

Quarter

Number of Companies

Ratio (per cent) ##

Total Inventory / Sales

Finished Goods Inventory / Sales

Raw Material Inventory / Sales

Q2:2022-23

721

61.8

22.6

29.6

Q3:2022-23

675

60.6

21.9

30.0

Q4:2022-23

658

64.1

23.2

32.5

Q1:2023-24

622

63.0

24.8

29.3

Q2:2023-24

688

65.9

24.6

30.9

##: Weighted average of industry level ratios using GVA as weights

Table 3B: Average Sales and Inventories

Quarter

Number of Companies

Average Amount (` Crores)

Sales

Total Inventory

Finished Goods Inventory

Work in progress Inventory

Raw Material Inventory

Q2:2022-23

721

1285.8

508.2

217.6

73.2

217.4

Q3:2022-23

675

1106.7

519.9

195.5

67.1

257.4

Q4:2022-23

658

1172.2

546.6

225.4

62.7

258.5

Q1:2023-24

622

1163.1

534.3

226.9

62.8

244.5

Q2:2023-24

688

1091.7

608.1

226.7

120.4

261.0

Note: 1. The computations of order book growths and inventory to sales ratios are based on methodology given in the RBI press release dated October 8, 2021 (link: https://rbi.org.in/web/rbi/-/publications/obicus-survey-on-the-manufacturing-sector-for-q1-2021-22-20650) and not on the basis of averages given in the above tables.

2. The estimates of inventory of raw materials (including stores and spares, loose tools and stock-in-trade) are arrived at by netting out finished goods inventory and work-in-progress inventory from total inventory. The survey has also started collecting direct data on raw material inventory, which will be included in the regular survey results once the reporting coverage of the new item is satisfactory.


[1] The survey responses are voluntary and the results reflect the views of the respondents, which are not necessarily shared by the Reserve Bank. Results of the previous survey round were released on the Bank’s website on October 06, 2023.

RbiTtsCommonUtility

प्ले हो रहा है
ಕೇಳಿ

Related Assets

RBI-Install-RBI-Content-Global

RbiSocialMediaUtility

ಭಾರತೀಯ ರಿಸರ್ವ್ ಬ್ಯಾಂಕ್ ಮೊಬೈಲ್ ಅಪ್ಲಿಕೇಶನ್ ಅನ್ನು ಇನ್ಸ್ಟಾಲ್ ಮಾಡಿ ಮತ್ತು ಇತ್ತೀಚಿನ ಸುದ್ದಿಗಳಿಗೆ ತ್ವರಿತ ಅಕ್ಸೆಸ್ ಪಡೆಯಿರಿ!

Scan Your QR code to Install our app

RbiWasItHelpfulUtility

ಈ ಪುಟವು ಸಹಾಯಕವಾಗಿತ್ತೇ?