RbiSearchHeader

Press escape key to go back

Past Searches

Theme
Theme
Text Size
Text Size
S3

RbiAnnouncementWeb

RBI Announcements
RBI Announcements

Asset Publisher

83800003

Quarterly Order Books, Inventories and Capacity Utilisation Survey (OBICUS) Q2: 2012 (19th Round)

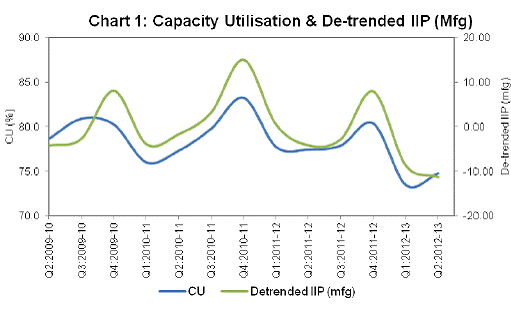
The Order Books, Inventories and Capacity Utilisation Survey (OBICUS), 19th round in the series, was conducted for Q2:2012-13. In all, 1,135 manufacturing companies responded, of which 46 were Government companies, 802 were public limited companies and 287 were private limited companies. The analysis is based on the data on order books, inventory levels for raw materials and finished goods, and capacity utilisation, received from these companies for the past 13 quarters i.e. Q2:2009-10 to Q2:2012-13.

Highlights:

  • New orders growth (y-o-y) was positive, but decelerated as compared with the previous quarter. Over the previous quarter, new orders showed contraction. (Table 1).

  • Capacity utilisation (CU) increased marginally as compared with the previous quarter, but remained lower than the level a year ago. (Table 2).

  • There is broad co-movement between capacity utilization and de-trended IIP manufacturing (Chart 1).

  • While the finished goods inventory as ratio to sales increased in Q2:2012-13 over the previous quarter, raw materials inventory to sales remained at the same level (Table 3).

01

Table 1: Order Books (Q2: 2009-10 to Q2: 2012-13)

Quarter
ended

Amount in ` billion

Q-o-Q growth (%)

Y-o-Y growth (%)

Avg
Backlog
order
(466)

Avg
New Order
book
(466)

Avg
Pending
order
(466)

Avg
Backlog
order

Avg
New
Order
book

Avg
Pending
order

Avg
Backlog
order

Avg
New
Order
book

Avg
Pending
order

Q2:2009-10

1.49

1.04

1.53

-

-

-

-

-

-

Q3:2009-10

1.53

1.08

1.56

2.8

4.1

2.1

-

-

-

Q4:2009-10

1.57

1.12

1.57

2.6

3.9

0.3

-

-

-

Q1:2010-11

1.53

1.06

1.54

-2.5

-5.6

-1.7

-

-

-

Q2:2010-11

1.54

1.15

1.59

0.5

8.4

3.2

3.4

10.7

4.0

Q3:2010-11

1.59

1.27

1.67

3.4

10.6

4.8

4.0

17.7

6.7

Q4:2010-11

1.67

1.36

1.69

5.0

7.6

1.4

6.5

21.8

7.9

Q1:2011-12

1.67

1.20

1.66

0.0

-11.7

-1.9

9.2

14.0

7.7

Q2:2011-12

1.66

1.29

1.63

-0.8

7.4

-1.7

7.8

12.9

2.5

Q3:2011-12

1.63

1.39

1.70

-1.9

7.2

3.9

2.2

9.4

1.6

Q4:2011-12

1.70

1.46

1.67

4.2

4.9

-1.5

1.5

6.7

-1.2

Q1:2012-13

1.67

1.40

1.71

-1.8

-3.6

2.1

-0.4

16.5

2.8

Q2:2012-13

1.71

1.30

1.65

2.4

-7.1

-3.1

2.8

0.7

1.3

*Figures in brackets are number of companies reporting order books.


Table 2: Capacity Utilisation & Index of Industrial Production
(Manufacturing) (Base: 2004-05=100)

Quarter

IIPMFG (Qtly avg:
Base 2004-05)

De-trended Qtly IIPMFG

CU (%)

Q2:2009-10

158.1

-4.2

78.6

Q3:2009-10

162.0

-2.7

80.9

Q4:2009-10

175.1

8.1

80.2

Q1:2010-11

165.4

-3.9

76.0

Q2:2010-11

169.8

-1.7

77.3

Q3:2010-11

176.8

3.2

79.8

Q4:2010-11

190.7

15.0

83.2

Q1:2011-12

178.2

0.5

77.7

Q2:2011-12

175.5

-4.1

77.4

Q3:2011-12

178.8

-2.8

77.9

Q4:2011-12

191.4

7.9

80.3

Q1:2012-13

176.7

-8.7

73.4

Q2:2012-13

176.0

-11.2

74.7


Table 3: Average Sales and Inventories and their ratios
(Q2: 2009-10 to Q2: 2012-13)

Quarter
ended

Amount in ` Billion

Ratio in per cent

Avg
Sales
(891)

Avg
Total
Inv
(891)

Avg
FG Inv
(891)

Avg
WiP
Inv
(891)

Avg
RM
Inv

Total
Inv/
Sales

FG
Inv/
Sales

RM
Inv/
Sales

Q2:2009-10

2.88

1.48

0.54

0.22

0.72

51.4

18.8

24.9

Q3:2009-10

3.08

1.52

0.51

0.24

0.77

49.4

16.7

25.1

Q4:2009-10

3.30

1.62

0.53

0.23

0.86

49.0

15.9

26.2

Q1:2010-11

3.23

1.68

0.58

0.25

0.85

52.0

17.9

26.2

Q2:2010-11

3.38

1.75

0.60

0.27

0.88

51.7

17.8

26.0

Q3:2010-11

3.63

1.86

0.52

0.27

1.08

51.3

14.2

29.7

Q4:2010-11

4.07

2.02

0.68

0.31

1.02

49.6

16.8

25.0

Q1:2011-12

4.07

2.10

0.74

0.30

1.06

51.6

18.2

26.0

Q2:2011-12

4.10

2.12

0.77

0.33

1.02

51.7

18.8

24.8

Q3:2011-12

4.36

2.23

0.83

0.34

1.07

51.2

18.9

24.6

Q4:2011-12

4.80

2.41

0.80

0.36

1.25

50.2

16.7

26.1

Q1:2012-13

4.59

2.45

0.80

0.39

1.27

53.5

17.5

27.6

Q2:2012-13

4.77

2.64

0.94

0.39

1.31

55.4

19.7

27.6

*Figures in brackets are number of companies reporting inventories.


1Prepared in the Division of Enterprise Surveys, Department of Statistics and Information Management. Data relating to the previous survey round were published in November 2012 issue of the RBI Bulletin. The survey results are based on the replies of the respondents and are not necessarily shared by the Reserve Bank of India.

RbiTtsCommonUtility

प्ले हो रहा है
ಕೇಳಿ

Related Assets

RBI-Install-RBI-Content-Global

RbiSocialMediaUtility

ಭಾರತೀಯ ರಿಸರ್ವ್ ಬ್ಯಾಂಕ್ ಮೊಬೈಲ್ ಅಪ್ಲಿಕೇಶನ್ ಅನ್ನು ಇನ್ಸ್ಟಾಲ್ ಮಾಡಿ ಮತ್ತು ಇತ್ತೀಚಿನ ಸುದ್ದಿಗಳಿಗೆ ತ್ವರಿತ ಅಕ್ಸೆಸ್ ಪಡೆಯಿರಿ!

Scan Your QR code to Install our app

RbiWasItHelpfulUtility

ಈ ಪುಟವು ಸಹಾಯಕವಾಗಿತ್ತೇ?