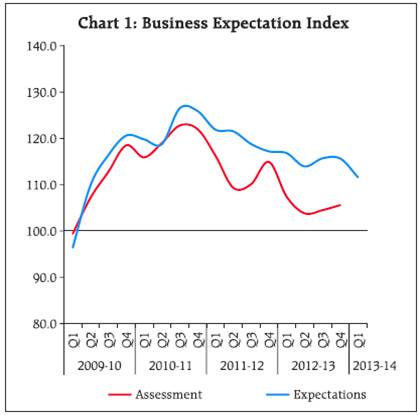
The Reserve Bank of India monitors trends in various macroeconomic indicators in the process of conducting monetary policy in India. However, most of these indicators are available with a time lag. In order to bridge the gap, the Reserve Bank conducts a few forward looking surveys1 covering corporate and household sectors. The corporate sector being one of the key sectors in an economy, sentiments that drive current and near term business decisions is a key information for policy formulation. The Reserve Bank of India has been conducting the Industrial Outlook Survey (IOS) for the Indian manufacturing sector on a quarterly basis since 1998. The survey captures the assessment of business sentiments for the current quarter and expectations for the ensuing quarter, based on qualitative responses on a set of parameters pertaining to the demand conditions, financial conditions, employment condition and price situation. The survey schedule is canvassed among a fixed panel of 2,000 manufacturing companies, mostly with paid-up capital above `5 million, representing a good mix of size and industry groups. The panel is periodically updated with addition of new companies or deletion of closed/merged companies as required. This article analyses the survey responses for four quarters from April-June 2012 to January-March 2013. The response rate lied between 65-78 percent during this period. I.1 Business sentiments weakened progressively The business Expectation Index (BEI) which is computed as a weighted average of net responses on nine select performance parameter2 gives a single snapshot of the industrial outlook in each quarter. For each of the survey round, two indices are computed - one based on assessment of current quarter and another based on expectations of next quarter. During the year under study, BEI (based on assessment) moderated in the first two quarters when it reached a level seen at the onset of financial crisis in Q3:2008-09 and moved up marginally in the next two quarters. BEI (based on outlook) also indicated similar trend but recorded a sharp drop in Q1:2013-14. It is observed that the index based on expectation has generally been higher than the index based on assessment and the gap has widened since 2011-12 (Chart 1). The BEI has still remained in the growth terrain (i.e., above 100, which is the threshold separating contraction from expansion). I.2 Demand conditions weakened The survey collects perceptions of Indian manufacturers on demand conditions through various parameters, namely, production, order books, capacity utilisation, inventory, exports and imports. In respect of most of the above parameters, outlook during FY: 2012-13 remained weak and it deteriorated further for Q1: 2013-14. Analysis of data from the previous survey rounds indicates that one-quarter ahead outlook is generally able to track the actual movement in the case of most of the parameters (Box I).
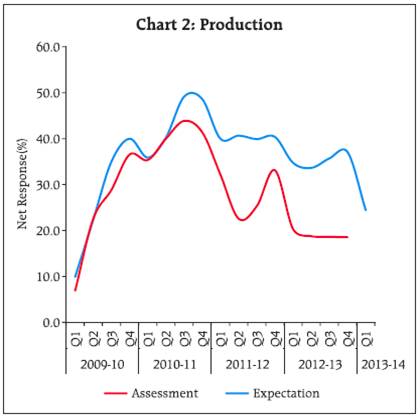
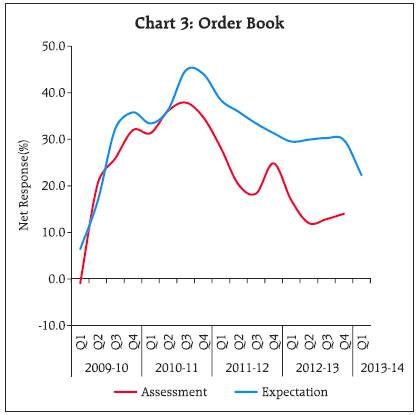
I.2.1 The net response3 on production dropped sharply in assessment quarter of Q1:2012-13 and it remained flat in the remaining quarters. One quarter ahead outlook also showed lower optimism in Q1 and Q2 of 2012-13. Though expectations improved modestly during the next two quarters, the same declined sharply for Q1:2013-14 (Chart 2). The pattern was similar for order books also (Chart 3). However, positive net response is indicative of continued growth.
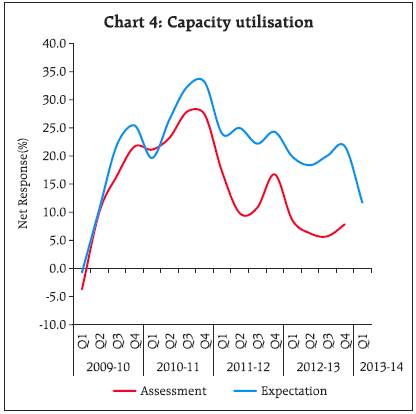
I.2.2 Majority of the respondents (around 55-60 per cent) expected capacity utilisation to remain the same in FY:2012-13 and the net response remained flat during this period. However, outlook for Q1:2013-14 revealed lower optimism (Chart 4).
Box I: Validation of Expectation response with succeeding Assessment response The survey collects assessment for current quarter and expectations for next quarter on various business parameters. In order to examine, how close is the assessment for a given quarter to corresponding expectation captured a quarter back, correlation between the assessment during the current survey round and expectations for that parameter given during the last survey round is computed for some major parameters (Chart A). The survey responses during Q1:2000-01 to Q4:2012-13 (52 quarters) is taken for this validation. It is found that these parameters are positively correlated though the extent of correlation varies. Assessment and expectations for major parameters under demand conditions, financial conditions and price situation are highly correlated implying that three months ahead expectations nearly coincide with assessment given during current quarter. This indicates that the expectations captured for each quarter by the survey, is a very good lead indicator for its subsequent behaviour.

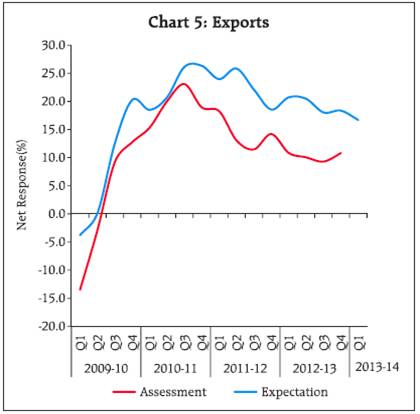
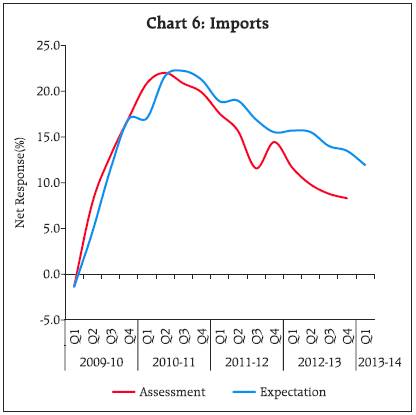
I.2.3 Outlook on exports growth remained less optimistic throughout the year (Chart 5). Lack of domestic demand also impacted the growth in imports and net response fell during the year (Chart 6). Outlook though remained positive for Q1:2013-14, indicated further decline. Lack of domestic and external demand had been reported to be a major constraint by majority of the reporting companies.
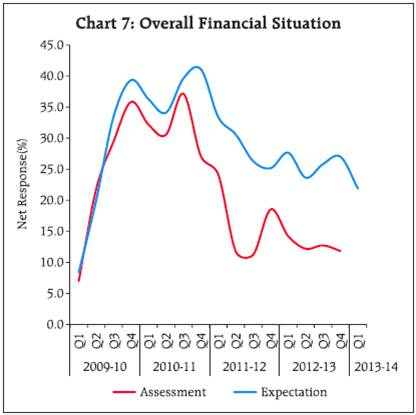
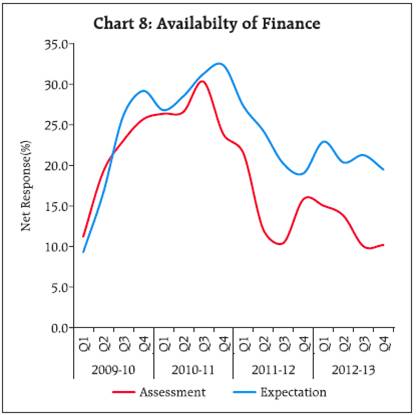
I.2.4 According to the survey results, most of the responding firms (about 80 per cent) reported ‘no change’ in the inventory levels of both raw materials and finished goods on a quarterly basis. Of the remaining, slightly higher percentage of respondents reported carrying above average level of inventory during the year. I.3 Financial Situation yet to revive The survey assesses sentiments about the financial situations based on several parameters. While the respondents are required to evaluate the overall financial situation, responses are specifically obtained on availability of finance, cost of external finance and profit margin. I.3.1 Optimism level for overall financial situation had been lower since 2011-12, and the outlook deteriorated further for Q1: 2013-14 (Chart 7). During Q1:2012-13 to Q3:2012-13, majority of companies (89 per cent) reported their availability of finance either unchanged or improve. Expectations too reveal almost similar trend, with majority of the respondents expecting the availability of finance to remain stagnant (Chart 8).
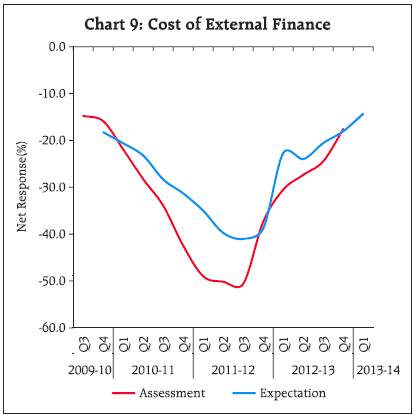
I.3.2 In Q4:2012-13, the question on availability of finance was divided into three questions viz., availability of finance from internal accruals, availability of finance from banks and other financial institutions and availability of finance from overseas (if applicable). It was seen that majority of the companies responded no change for all the three questions. Only less than 10 per cent of respondents expected the situation to worsen in Q1:2013-14 (Table-11(a)). I.3.3 The sentiments on cost of finance have remained negative for a long time and the lowest level was reached in Q3:2011-12. The net response improved gradually thereafter and percentage of respondents who experienced higher cost of finance has been declining throughout the year (Chart 9).
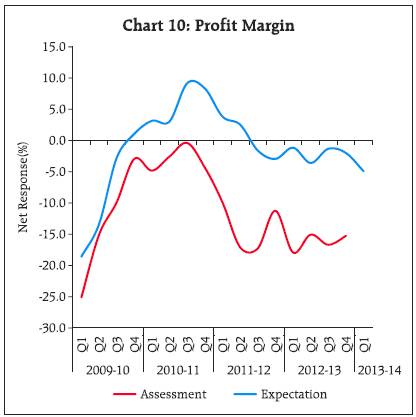
I.3.4 On profit margin, a higher percentage of respondents reported either decrease or no change during the year. As regards outlook, though the sentiments of corporates were evenly balanced, the net response dropped substantially for Q1:2013-14 (Chart 10).
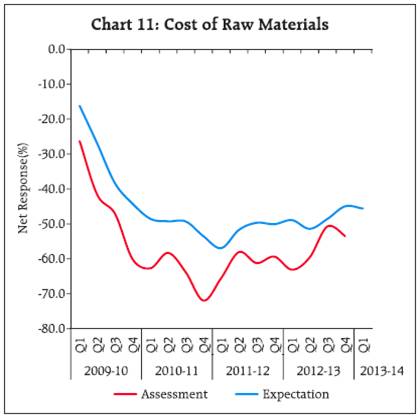
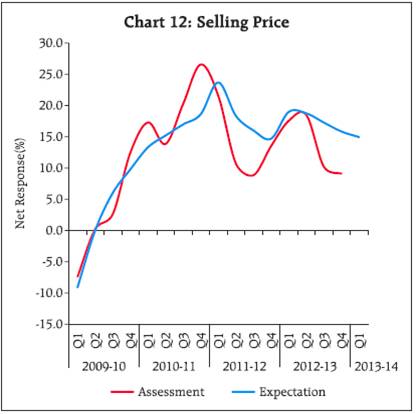
I.4 Employment and Price Situation The survey seeks from the companies their perceptions on employment. Generally, 70-75 per cent of companies responded ‘no change’ in the employment level and only less than 10 per cent of the manufacturing companies witnessed a contraction in their employment levels during the year under study. As regards the price situation, the survey elicits current assessment/one-quarter ahead outlook on cost of raw material and selling prices from the respondent companies. The sentiment on cost of raw materials, though remained negative during the year, showed some improvement as compared with the previous year. However, a much lower percentage of respondents reported/expected rise in selling price, which could be an indication of continued lack of pricing power which is in consistent with falling profit margins (Chart 11 and 12).
1.5 Conclusion The weakening growth in demand conditions and the BEI huddling around the levels seen at crisis period of Q2:2008-09, indicates that the growth of manufacturing sector has been plummeting throughout the year. Lack of domestic and external demand along with shortage of power persisting as the major constraints in production, weighed to this modest pace of growth.
Table 1: Assessment & Expectations for Production |
(Percentage responses) @ |
Survey Quarter |
Total response |
Assessment for Current Quarter |
Expectation for Next Quarter |
Increase |
Decrease |
No change |
Net response |
Increase |
Decrease |
No change |
Net response |
Q4: 2011-12 |
1234 |
45.6 |
12.5 |
41.9 |
33.1 |
49.8 |
9.5 |
40.7 |
40.4 |
Q1: 2012-13 |
1404 |
38.8 |
18.5 |
42.7 |
20.3 |
45.4 |
10.6 |
44.0 |
34.7 |
Q2: 2012-13 |
1561 |
37.9 |
19.2 |
42.9 |
18.8 |
45.4 |
11.7 |
42.9 |
33.6 |
Q3: 2012-13 |
1388 |
37.5 |
18.8 |
43.7 |
18.6 |
46.1 |
10.4 |
43.4 |
35.7 |
Q4: 2012-13 |
1301 |
36.8 |
18.2 |
45.0 |
18.6 |
46.3 |
9.2 |
44.4 |
37.1 |
Q1:2013-14 |
|
|
|
|
|
38.3 |
13.8 |
47.9 |
24.4 |
‘Increase’ in production is optimistic. |
Table 2: Assessment & Expectations for Order books |
(Percentage responses) |
Survey Quarter |
Total response |
Assessment for Current Quarter |
Expectation for Next Quarter |
Increase |
Decrease |
No change |
Net response |
Increase |
Decrease |
No change |
Net response |
Q4: 2011-12 |
1234 |
38.9 |
14.1 |
47.0 |
24.8 |
42.3 |
11.0 |
46.7 |
31.3 |
Q1: 2012-13 |
1404 |
34.2 |
17.3 |
48.5 |
16.9 |
39.3 |
9.8 |
50.9 |
29.5 |
Q2: 2012-13 |
1561 |
31.9 |
19.8 |
48.3 |
12.0 |
41.0 |
11.1 |
47.9 |
29.9 |
Q3: 2012-13 |
1388 |
32.0 |
19.2 |
48.8 |
12.9 |
41.2 |
10.9 |
48.0 |
30.3 |
Q4: 2012-13 |
1301 |
32.7 |
18.6 |
48.7 |
14.0 |
40.0 |
10.2 |
49.8 |
29.8 |
Q1:2013-14 |
|
|
|
|
|
35.5 |
13.2 |
51.2 |
22.3 |
‘Increase’ in order books is optimistic. |
Table 3: Assessment & Expectations for Pending Orders |
(Percentage responses) |
Survey Quarter |
Total response |
Assessment for Current Quarter |
Expectation for Next Quarter |
Below Normal |
Above Normal |
Normal |
Net response |
Below Normal |
Above Normal |
Normal |
Net response |
Q4: 2011-12 |
1234 |
15.9 |
5.4 |
78.7 |
10.5 |
13.7 |
6.5 |
79.8 |
7.3 |
Q1: 2012-13 |
1404 |
17.0 |
5.7 |
77.3 |
11.3 |
13.3 |
4.6 |
82.1 |
8.8 |
Q2: 2012-13 |
1561 |
18.7 |
5.6 |
75.7 |
13.1 |
14.6 |
6.2 |
79.2 |
8.4 |
Q3: 2012-13 |
1388 |
18.8 |
4.4 |
76.8 |
14.3 |
14.4 |
7.0 |
78.6 |
7.4 |
Q4: 2012-13 |
1301 |
19.3 |
4.7 |
75.9 |
14.6 |
14.6 |
4.5 |
80.9 |
10.1 |
Q1:2013-14 |
|
|
|
|
|
16.9 |
5.3 |
77.7 |
11.6 |
Pending orders ‘Below Normal’ is optimistic. |
Table 4: Assessment & Expectations for Capacity Utilisation |
(Percentage responses) |
Parameter |
Options |
Assessment for Quarter |
Expectations for Quarter |
Q1:2012-13 |
Q2:2012-13 |
Q3:2012-13 |
Q4:2012-13 |
Q2:2012-13 |
Q3:2012-13 |
Q4:2012-13 |
Q1:2013-14 |
Capacity Utilisation (CU)-(main product) |
Increase |
25.8 |
24.0 |
23.3 |
23.7 |
30.4 |
30.4 |
31.1 |
24.9 |
No Change |
57.1 |
58.3 |
59.0 |
60.5 |
57.6 |
59.3 |
59.6 |
62.0 |
Decrease |
17.1 |
17.7 |
17.6 |
15.9 |
12.0 |
10.3 |
9.3 |
13.1 |
Net Response |
8.6 |
6.3 |
5.7 |
7.8 |
18.4 |
20.0 |
21.7 |
11.7 |
Level of CU (compared to the average in last 4 quarters) |
Above normal |
10.1 |
9.7 |
9.1 |
10.0 |
11.4 |
10.3 |
10.7 |
10.5 |
Normal |
71.9 |
71.3 |
70.9 |
71.3 |
75.6 |
77.4 |
76.6 |
74.5 |
Below Normal |
17.9 |
18.9 |
20.0 |
18.7 |
13.0 |
12.3 |
12.7 |
15.0 |
Net Response |
-7.8 |
-9.2 |
-10.8 |
-8.7 |
-1.5 |
-2.0 |
-2.1 |
-4.4 |
Assessment of Prod. Capacity (with regard to expected demand in next 6 months) |
More than adequate |
12.4 |
13.1 |
14.2 |
13.4 |
13.0 |
13.0 |
13.0 |
13.7 |
Adequate |
79.6 |
79.0 |
77.5 |
77.4 |
80.0 |
80.5 |
79.6 |
78.4 |
Less than adequate |
8.0 |
7.9 |
8.3 |
9.2 |
7.1 |
6.4 |
7.4 |
7.9 |
Net Response |
4.4 |
5.2 |
5.9 |
4.2 |
5.9 |
6.6 |
5.6 |
5.7 |
‘Increase’ in capacity utilisation is optimistic. |
Table 5: Assessment & Expectations for Exports |
(Percentage responses) |
Survey Quarter |
Total response |
Assessment for Current Quarter |
Expectation for Next Quarter |
Increase |
Decrease |
No change |
Net response |
Increase |
Decrease |
No change |
Net response |
Q4: 2011-12 |
1234 |
27.8 |
13.6 |
58.6 |
14.2 |
29.0 |
10.4 |
60.6 |
18.6 |
Q1: 2012-13 |
1404 |
25.7 |
14.9 |
59.4 |
10.8 |
30.1 |
9.4 |
60.5 |
20.7 |
Q2: 2012-13 |
1561 |
25.3 |
15.2 |
59.5 |
10.0 |
31.0 |
10.5 |
58.5 |
20.5 |
Q3: 2012-13 |
1388 |
24.3 |
15.0 |
60.6 |
9.3 |
29.0 |
10.9 |
60.1 |
18.0 |
Q4: 2012-13 |
1301 |
25.9 |
15.0 |
59.1 |
10.8 |
28.5 |
10.1 |
61.4 |
18.4 |
Q1:2013-14 |
|
|
|
|
|
27.1 |
10.4 |
62.5 |
16.7 |
‘Increase’ in exports is optimistic |
Table 6: Assessment & Expectations for Import |
(Percentage responses) |
Survey Quarter |
Total response |
Assessment for Current Quarter |
Expectation for Next Quarter |
Increase |
Decrease |
No change |
Net response |
Increase |
Decrease |
No change |
Net response |
Q4: 2011-12 |
1234 |
22.5 |
8.0 |
69.5 |
14.4 |
23.0 |
7.5 |
69.4 |
15.5 |
Q1: 2012-13 |
1404 |
21.8 |
10.1 |
68.1 |
11.6 |
22.4 |
6.7 |
70.8 |
15.7 |
Q2: 2012-13 |
1561 |
20.7 |
10.9 |
68.5 |
9.8 |
22.9 |
7.4 |
69.7 |
15.5 |
Q3: 2012-13 |
1388 |
19.0 |
10.2 |
70.7 |
8.8 |
22.1 |
8.1 |
69.8 |
14.0 |
Q4: 2012-13 |
1301 |
19.8 |
11.5 |
68.8 |
8.3 |
20.9 |
7.4 |
71.7 |
13.5 |
Q1:2013-14 |
|
|
|
|
|
20.4 |
8.5 |
71.1 |
11.9 |
‘Increase’ in imports is optimistic |
Table 7: Assessment & Expectations for level of Inventory (Raw material and Finished goods) |
(Percentage responses) |
Parameter |
Options |
Assessment for Quarter |
Expectations for Quarter |
Q1:2012-13 |
Q2:2012-13 |
Q3:2012-13 |
Q4:2012-13 |
Q2:2012-13 |
Q3:2012-13 |
Q4:2012-13 |
Q1:2013-14 |
Inventory of raw material |
Below average |
8.0 |
6.9 |
7.6 |
7.9 |
6.6 |
5.1 |
5.5 |
6.3 |
Average |
81.0 |
80.9 |
79.8 |
79.8 |
83.7 |
85.2 |
83.9 |
84.2 |
Above average |
11.0 |
12.3 |
12.6 |
12.2 |
9.7 |
9.7 |
10.6 |
9.5 |
Net Response |
-2.9 |
-5.4 |
-5.0 |
-4.3 |
-3.1 |
-4.7 |
-5.1 |
-3.3 |
Inventory of Finished goods |
Below average |
6.8 |
7.0 |
7.0 |
7.4 |
7.2 |
6.1 |
7.0 |
6.3 |
Average |
81.6 |
78.5 |
78.0 |
76.5 |
83.6 |
83.9 |
83.1 |
83.1 |
Above average |
11.7 |
14.5 |
15.0 |
16.1 |
9.2 |
10.0 |
9.9 |
10.6 |
Net Response |
-4.9 |
-7.4 |
-8.0 |
-8.7 |
-2.1 |
-4.0 |
-3.0 |
-4.3 |
Inventory of raw material and finished goods ‘Below average’ is optimistic |
Table 8: Assessment & Expectations for Employment Outlook |
(Percentage responses) |
Survey Quarter |
Total response |
Assessment for Current Quarter |
Expectation for Next Quarter |
Increase |
Decrease |
No change |
Net response |
Increase |
Decrease |
No change |
Net response |
Q4: 2011-12 |
1234 |
19.8 |
6.9 |
73.3 |
12.9 |
19.3 |
5.7 |
75.0 |
13.6 |
Q1: 2012-13 |
1404 |
19.8 |
9.7 |
70.5 |
10.0 |
19.9 |
5.2 |
74.9 |
14.6 |
Q2: 2012-13 |
1561 |
17.9 |
9.6 |
72.5 |
8.3 |
20.5 |
8.3 |
71.2 |
12.3 |
Q3: 2012-13 |
1388 |
16.4 |
9.7 |
73.9 |
6.7 |
19.2 |
5.9 |
74.9 |
13.3 |
Q4: 2012-13 |
1301 |
15.3 |
9.8 |
74.9 |
5.5 |
17.2 |
6.9 |
75.8 |
10.3 |
Q1:2013-14 |
|
|
|
|
|
16.0 |
8.0 |
76.1 |
8.0 |
‘Increase’ in employment is optimistic |
Table 9: Assessment & Expectations for Overall Financial Situation |
(Percentage responses) |
Survey Quarter |
Total response |
Assessment for Current Quarter |
Expectation for Next Quarter |
Better |
Worsen |
No change |
Net response |
Better |
Worsen |
No change |
Net response |
Q4: 2011-12 |
1234 |
30.4 |
11.9 |
57.8 |
18.5 |
35.3 |
10.2 |
54.5 |
25.2 |
Q1: 2012-13 |
1404 |
27.8 |
13.5 |
58.7 |
14.2 |
35.7 |
8.1 |
56.2 |
27.7 |
Q2: 2012-13 |
1561 |
27.1 |
14.9 |
58.0 |
12.2 |
33.2 |
9.5 |
57.3 |
23.6 |
Q3: 2012-13 |
1388 |
26.4 |
13.7 |
59.9 |
12.7 |
34.8 |
9.0 |
56.2 |
25.8 |
Q4: 2012-13 |
1301 |
26.9 |
15.1 |
58.0 |
11.8 |
34.9 |
7.9 |
57.2 |
27.0 |
Q1:2013-14 |
|
|
|
|
|
31.5 |
9.6 |
58.9 |
21.9 |
‘Better’ overall financial situation is optimistic |
Table 10: Assessment & Expectations for Working Capital Finance Requirement |
(Percentage responses) |
Survey Quarter |
Total response |
Assessment for Current Quarter |
Expectation for Next Quarter |
Increase |
Decrease |
No change |
Net response |
Increase |
Decrease |
No change |
Net response |
Q4: 2011-12 |
1234 |
40.0 |
5.1 |
54.8 |
34.9 |
38.0 |
4.2 |
57.8 |
33.8 |
Q1: 2012-13 |
1404 |
36.6 |
6.1 |
57.3 |
30.4 |
36.2 |
4.3 |
59.6 |
31.9 |
Q2: 2012-13 |
1561 |
37.5 |
6.8 |
55.8 |
30.7 |
34.9 |
4.8 |
60.3 |
30.1 |
Q3: 2012-13 |
1388 |
35.0 |
5.7 |
59.4 |
29.3 |
37.3 |
4.4 |
58.3 |
32.9 |
Q4: 2012-13 |
1301 |
35.2 |
6.3 |
58.5 |
29.0 |
35.8 |
3.8 |
60.5 |
32.0 |
Q1:2013-14 |
|
|
|
|
|
33.0 |
6.5 |
60.4 |
26.5 |
‘Increase’ in working capital finance is optimistic |
Table 11: Assessment & Expectations for Availability of Finance |
(Percentage responses) |
Survey Quarter |
Total response |
Assessment for Current Quarter |
Expectation for Next Quarter |
Improve |
Worsen |
No change |
Net response |
Improve |
Worsen |
No change |
Net response |
Q4: 2011-12 |
1234 |
26.1 |
10.3 |
63.5 |
15.8 |
28.2 |
9.1 |
62.7 |
19.0 |
Q1: 2012-13 |
1404 |
26.2 |
11.1 |
62.7 |
15.0 |
29.9 |
7.0 |
63.1 |
22.9 |
Q2: 2012-13 |
1561 |
25.0 |
11.2 |
63.8 |
13.8 |
28.0 |
7.7 |
64.3 |
20.4 |
Q3: 2012-13 |
1388 |
21.2 |
11.2 |
67.6 |
10.0 |
29.1 |
7.8 |
63.1 |
21.3 |
Q4: 2012-13 |
|
|
|
|
|
26.7 |
7.2 |
66.0 |
19.5 |
‘Improvement’ in availability of finance is optimistic |
Table 11(a): Assessment & Expectations for Availability of Finance |
(Percentage responses) |
Parameter |
Options |
Assessment for Quarter |
Expectations for Quarter |
Q4:2012-13 |
Q1:2013-14 |
Availability of Finance (from internal accruals)* |
Improve |
23.3 |
25.6 |
| |
No Change |
65.6 |
67.4 |
| |
Worsen |
11.1 |
7.0 |
| |
Net Response |
12.1 |
18.7 |
Availability of Finance (from banks & other sources)* |
Improve |
18.3 |
18.7 |
| |
No Change |
76.8 |
77.9 |
| |
Worsen |
4.9 |
3.4 |
| |
Net Response |
13.4 |
15.3 |
Availability of Finance (from overseas, if applicable)* |
Improve |
9.6 |
11.0 |
| |
No Change |
84.2 |
84.4 |
| |
Worsen |
6.2 |
4.6 |
| |
Net Response |
3.4 |
6.3 |
‘Improvement’ in availability of finance is optimistic. |
*These questions are newly added by splitting the question on Availability of Finance (both internal and external sources) in the 61st Round (Jan-March 2013) |
Table 12: Assessment & Expectations for Cost of External Finance |
(Percentage responses) |
Survey Quarter |
Total response |
Assessment for Current Quarter |
Expectation for Next Quarter |
Decrease |
Increase |
No change |
Net response |
Decrease |
Increase |
No change |
Net response |
Q4: 2011-12 |
1234 |
3.8 |
41.1 |
55.1 |
-37.4 |
4.1 |
42.8 |
53.1 |
-38.8 |
Q1: 2012-13 |
1404 |
7.3 |
37.8 |
54.9 |
-30.5 |
9.9 |
32.6 |
57.6 |
-22.7 |
Q2: 2012-13 |
1561 |
5.8 |
33.1 |
61.1 |
-27.4 |
8.6 |
32.6 |
58.9 |
-24.0 |
Q3: 2012-13 |
1388 |
5.8 |
30.3 |
63.9 |
-24.4 |
7.6 |
28.1 |
64.3 |
-20.6 |
Q4: 2012-13 |
1301 |
9.5 |
27.0 |
63.5 |
-17.6 |
7.5 |
25.5 |
67.0 |
-18.1 |
Q1:2013-14 |
|
|
|
|
|
9.7 |
24.0 |
66.3 |
-14.3 |
‘Decrease’ in cost of external finance is optimistic |
Table 13: Assessment & Expectations for Cost of Raw Material |
(Percentage responses) |
Survey Quarter |
Total response |
Assessment for Current Quarter |
Expectation for Next Quarter |
Decrease |
Increase |
No change |
Net response |
Decrease |
Increase |
No change |
Net response |
Q4: 2011-12 |
1234 |
3.4 |
62.7 |
33.9 |
-59.4 |
4.0 |
54.1 |
41.9 |
-50.1 |
Q1: 2012-13 |
1404 |
3.1 |
66.2 |
30.7 |
-63.1 |
2.2 |
51.2 |
46.5 |
-49.0 |
Q2: 2012-13 |
1561 |
3.0 |
62.6 |
34.4 |
-59.6 |
3.5 |
54.9 |
41.6 |
-51.4 |
Q3: 2012-13 |
1388 |
5.4 |
56.2 |
38.4 |
-50.7 |
3.5 |
52.1 |
44.3 |
-48.6 |
Q4: 2012-13 |
1301 |
4.3 |
57.8 |
37.9 |
-53.5 |
3.3 |
48.3 |
48.3 |
-45.0 |
Q1:2013-14 |
|
|
|
|
|
3.6 |
49.2 |
47.1 |
-45.6 |
‘Decrease’ in cost of raw material is optimistic |
Table 14: Assessment & Expectations for Selling Price |
(Percentage responses) |
Survey Quarter |
Total response |
Assessment for Current Quarter |
Expectation for Next Quarter |
Increase |
Decrease |
No change |
Net response |
Increase |
Decrease |
No change |
Net response |
Q4: 2011-12 |
1234 |
25.1 |
11.6 |
63.3 |
13.5 |
25.0 |
10.3 |
64.7 |
14.7 |
Q1: 2012-13 |
1404 |
28.0 |
10.5 |
61.4 |
17.5 |
26.3 |
7.3 |
66.4 |
19.0 |
Q2: 2012-13 |
1561 |
29.3 |
10.9 |
59.8 |
18.5 |
27.8 |
9.0 |
63.2 |
18.8 |
Q3: 2012-13 |
1388 |
22.5 |
12.3 |
65.1 |
10.2 |
25.6 |
8.3 |
66.1 |
17.3 |
Q4: 2012-13 |
1301 |
22.3 |
13.2 |
64.5 |
9.1 |
22.8 |
7.0 |
70.2 |
15.8 |
Q1:2013-14 |
|
|
|
|
|
23.1 |
8.1 |
68.8 |
14.9 |
‘Increase’ in selling price is optimistic |
Table 15: Assessment & Expectations for Profit Margin |
(Percentage responses) |
Survey Quarter |
Total response |
Assessment for Current Quarter |
Expectation for Next Quarter |
Increase |
Decrease |
No change |
Net response |
Increase |
Decrease |
No change |
Net response |
Q4: 2011-12 |
1234 |
17.5 |
28.7 |
53.8 |
-11.3 |
20.1 |
23.1 |
56.8 |
-2.9 |
Q1: 2012-13 |
1404 |
15.4 |
33.3 |
51.3 |
-17.9 |
20.4 |
21.6 |
58.0 |
-1.2 |
Q2: 2012-13 |
1561 |
16.2 |
31.2 |
52.6 |
-15.1 |
20.1 |
23.6 |
56.3 |
-3.6 |
Q3: 2012-13 |
1388 |
14.5 |
31.2 |
54.2 |
-16.7 |
20.5 |
21.8 |
57.7 |
-1.3 |
Q4: 2012-13 |
1301 |
16.2 |
31.5 |
52.3 |
-15.3 |
18.8 |
20.8 |
60.4 |
-2.0 |
Q1:2013-14 |
|
|
|
|
|
17.7 |
22.7 |
59.6 |
-4.9 |
‘Increase’ in profit margin is optimistic |
Table 16: Assessment & Expectations for Overall Business Situation |
| |
|
(Percentage responses) |
Survey Quarter |
Total response |
Assessment for Current Quarter |
Expectation for Next Quarter |
Better |
Worsen |
No change |
Net response |
Better |
Worsen |
No change |
Net response |
Q4: 2011-12 |
1234 |
37.8 |
11.3 |
50.9 |
26.5 |
43.6 |
10.0 |
46.5 |
33.6 |
Q1: 2012-13 |
1404 |
32.9 |
14.6 |
52.5 |
18.3 |
43.0 |
8.1 |
49.0 |
34.9 |
Q2: 2012-13 |
1561 |
32.8 |
16.7 |
50.5 |
16.1 |
40.2 |
9.7 |
50.1 |
30.6 |
Q3: 2012-13 |
1388 |
32.3 |
15.0 |
52.7 |
17.2 |
41.4 |
9.2 |
49.4 |
32.2 |
Q4: 2012-13 |
1301 |
32.8 |
14.4 |
52.8 |
18.4 |
44.8 |
7.2 |
48.0 |
37.5 |
Q1:2013-14 |
|
|
|
|
|
39.3 |
9.7 |
51.1 |
29.6 |
‘Better’ Overall Business Situation is optimistic |
Table 17: Business Expectation Index (BEI) |
Quarter |
BEI-Assessment Quarter |
BEI-Expectation Quarter |
Q4: 2011-12 |
114.9 |
117.2 |
Q1: 2012-13 |
107.4 |
116.8 |
Q2: 2012-13 |
103.8 |
114.0 |
Q3: 2012-13 |
104.5 |
115.7 |
Q4: 2012-13 |
105.6 |
115.6 |
Q1:2013-14 |
|
111.6 |
Note: @Due to rounding off percentage may not add up to 100. This is applicable for all the tables from 1 to 16. |
|