| Headline inflation firmed up in major economies during the third quarter of 2007-08 reflecting the combined impact of higher food and fuel prices as well as strong demand conditions, especially in emerging markets. The monetary policy response during the quarter, however, was mixed in view of heightened concerns about the implications of credit crunch arising out of the US sub-prime crisis on financial stability. Since end-September 2007, several central banks (such as the US Federal Reserve System, Bank of England, Bank of Canada, Bank Indonesia, Central Bank of Philippines and Central Bank of the Republic of Turkey) cut their policy rates aimed at promoting financial stability and supporting growth notwithstanding persistence of inflationary pressures. The US Federal Reserve System also reduced the discount rate to improve market liquidity. Apart from independent actions, there has also been a coordinated move by five major advanced country central banks in terms of injection of short-term liquidity aimed at easing strains on the money markets. On the other hand, some central banks [such as the Reserve Bank of Australia, Norges Bank (Norway), Sveriges Riksbank (Sweden), South African Reserve Bank and the People's Bank of China] have further raised policy rates to contain inflation and inflationary expectations. The central banks of China and Russia also raised cash reserve requirements to address concerns regarding excess liquidity.
In India, inflation based on the wholesale price index (WPI) has remained below 4 per cent since mid-August 2007 (3.8 per cent as on January 5, 2008), partly reflecting moderation in the prices of primary food articles and some manufactured products items as well as base effects. Pre-emptive monetary measures since mid-2004 accompanied by fiscal and supply-side measures have also helped in containing inflation. Consumer price inflation also eased during the third quarter of 2007-08 but continued to remain above the WPI inflation, mainly reflecting the impact of food prices and their higher weights in the CPI vis-à-vis WPI. Various measures of consumer price inflation were placed in the range of 5.1-5.9 per cent during November/December 2007 as compared with 5.7-7.9 per cent in September 2007 and 6.7-9.5 per cent in March 2007. It may, however, be noted that since pass-through of higher international oil prices to domestic prices remains incomplete, inflation has remained suppressed. Elevated international food prices also pose potential inflationary pressures in the period ahead.
Global Inflation
Headline inflation in major advanced economies firmed up beginning September 2007, mainly reflecting the hardening of food and fuel prices. Amongst major economies, headline inflation in December 2007 was 4.1 per cent in the US, 2.1 per cent in the UK and 3.1 per cent in the euro area as compared with 
2.8 per cent, 1.8 per cent and 2.1 per cent, respectively, in September 2007 (Chart 16). Inflation increased to 3.3 per cent in November, 2007 in the OECD countries from 2.2 per cent in September 2007 and 2.0 per cent a year ago. Core inflation also remained firm in major economies, reflecting high commodity prices and strong demand conditions, especially in emerging markets. In the US, CPI inflation (excluding food and energy) was 2.4 per cent in December 2007 as compared with 2.1 per cent in September 2007. In the OECD countries, CPI inflation (excluding food and energy) was 2.0 per cent in November 2007, as compared with 1.9 per cent in September 2007.
The fallout of the US sub-prime crisis and correction in the housing markets, however, has raised concerns about credit squeeze in many advanced economies, including the UK and the euro area. Notwithstanding the underlying inflationary pressures, many central banks in advanced economies resorted to monetary easing in order to forestall the adverse impact of the tightening credit conditions on the broader economy. In the US, headline inflation firmed up to 4.1 per cent in December 2007 from 2.5 per cent a year earlier mainly due to higher food and energy prices. Notwithstanding the modest improvement in the readings on core inflation, the Federal Open Market Committee (FOMC) in its meeting held on December 11, 2007 judged that inflation risks remained and indicated that it would continue to monitor inflation developments carefully. According to the FOMC, however, incoming information suggested that economic growth was slowing, reflecting the intensification of the housing correction and some softening in business and consumer spending and increasing strains in financial markets in the recent past. Recognising that the recent developments, including the deterioration in financial market conditions, increased the uncertainty surrounding the outlook for economic growth and inflation, the FOMC cut its target for the federal funds rate further by 50 basis points during the October-December 2007 quarter - 25 basis points each on October 31, 2007 and December 11, 2007 - to 4.25 per cent to promote moderate growth over time. The discount rate was also cut further by 50 basis points during the quarter to 4.75 per cent to improve market liquidity. Apart from lowering the discount rate, the US Fed also injected liquidity by auctioning term funds to depository institutions against a wide variety of collaterals at the discount window and through a broader range of counterparties and established foreign exchange swap lines with the European Central Bank (ECB) and the Swiss National Bank. In view of a weakening of the economic outlook and increasing downside risks to growth, the FOMC cut the target for the federal funds rate further by 75 basis points to 3.5 per cent on January 22, 2008. The discount rate was also reduced by 75 basis points to 4.0 per cent. The FOMC, however, noted that it would continue to assess the effects of financial and other developments and would act in a timely manner as needed to address those risks.
In the UK, there are signs of growth beginning to slow and forward-looking surveys of households and business suggest moderation in spending. According to the Monetary Policy Committee (MPC), conditions in financial markets have deteriorated and a tightening in the supply of credit to households and businesses is posing downside risks to the outlook for both output and inflation further ahead. Although higher energy and food prices are expected to keep inflation above the target in the short-term, the MPC is of the view that slowing demand growth should ease the pressures on supply capacity bringing inflation back to target in the medium term. The Bank of England, therefore, cut its policy rate by 25 basis points on December 6, 2007 to 5.5 per cent and left it unchanged thereafter (Table 27).
In the euro area, inflation, based on the Harmonised Index of Consumer Prices (HICP), rose sharply in December 2007 to 3.1 per cent from 1.9 per cent a year ago largely due to upward pressures from energy and food prices. According to the Governing Council of the ECB, there were upside risks to price stability over the medium term from further rises in oil and agricultural prices, increases in administered prices and indirect taxes beyond those foreseen by then as well as the possibility of stronger than currently expected wage growth and increases in pricing power in market segments with low competition. The Council also noted that although the economic fundamentals of the euro area remained sound and money and credit growth very vigorous, the reappraisal of risk in financial markets was evolving and was accompanied by continued uncertainty about the potential impact on the real economy. The ECB observed that firmly anchoring medium and long term inflation expectations in line with price stability was all the more important at times of financial market volatility and increased uncertainty and left the key policy rates unchanged during the quarter. In its meeting held on January 10, 2008,
Table 27: Global Inflation Indicators |
(Per cent) |
Country/ |
Key Policy Rate |
Policy Rate (As |
Changes in |
CPI |
Real GDP |
Region |
|
on January 23, |
Policy Rate |
Inflation |
Growth |
|
|
2008) |
(basis points) |
(y-o-y) |
(y-o-y) |
|
|
|
2005-06 |
2006-07 |
Since |
Dec. |
Dec. |
2006 |
2007 |
|
|
|
(April- |
(April- |
end- |
2006 |
2007 |
(Q3) |
(Q3) |
|
|
|
March) |
March) |
March
2007 |
|
|
|
|
1 |
2 |
3 |
4 |
5 |
6 |
7 |
8 |
9 |
10 |
Developed Economies |
Australia |
Cash Rate |
6.75 (Nov.7, 2007) |
0 |
75 |
50 |
3.9 |
1.9 # |
2.2 |
4.3 |
Canada |
Overnight Rate |
4.00 (Jan. 22, 2008) |
125 |
50 |
(-) 25 |
1.4 |
2.5 * |
2.5 |
2.9 |
Euro area |
Interest Rate on |
|
|
|
|
|
|
|
|
|
Main Refinancing |
|
|
|
|
|
|
|
|
|
Operations |
4.00 (June 6, 2007) |
50 |
125 |
25 |
1.9 |
3.1 |
2.8 |
2.7 |
Japan |
Uncollateralised |
|
|
|
|
|
|
|
|
|
Overnight Call Rate |
0.50 (Feb. 21, 2007) |
0 ** |
50 |
0 |
0.3 |
0.6 * |
1.6 |
1.9 |
UK |
Official Bank Rate |
5.50 (Dec. 6, 2007) |
(-)25 |
75 |
25 |
3.0 |
2.1 |
2.9 |
3.2 |
US |
Federal Funds Rate |
3.50 (Jan. 22, 2008) |
200 |
50 |
(-)175 |
2.5 |
4.1 |
2.4 |
2.8 |
Developing Economies |
|
|
|
|
|
|
|
|
|
|
Brazil |
Selic Rate |
11.25 (Sep. 5, 2007) |
(-)275 |
(-)375 |
(-)150 |
3.1 |
4.5 |
3.2 |
5.7 |
India |
Reverse Repo Rate |
6.00 (July 25, 2006) |
75 |
50 |
0 |
6.3 |
5.5 * |
10.2 |
8.9 |
|
Repo Rate |
7.75 (Mar. 31, 2007) |
50 |
125 |
0 |
|
|
|
|
|
|
|
(0) |
(100) |
(150) |
|
|
|
|
China |
Benchmark |
|
|
|
|
|
|
|
|
|
1-year Lending Rate |
7.47 (Dec. 21, 2007) |
|
81 |
108 |
1.9 |
6.9 * |
10.7 |
11.5 |
|
|
|
|
(250) |
(450) |
|
|
|
|
Indonesia |
BI Rate |
8.00 (Dec. 6, 2007) |
425 @ |
(-)375 |
(-)100 |
6.6 |
6.6 |
5.5 |
6.5 |
Israel |
Key Rate |
4.25 (Dec. 24, 2007) |
125 |
(-)75 |
25 |
-0.1 |
3.4 |
4.6 |
4.8 |
Korea |
Overnight Call Rate |
5.00 (Aug. 9, 2007) |
75 |
50 |
50 |
2.1 |
3.6 |
4.6 |
5.2 |
|
|
|
|
(80) |
|
|
|
|
|
Philippines |
Reverse Repo Rate |
5.25 (Dec. 20, 2007)+ |
75 |
0 |
(-)225 |
4.3 |
3.9 |
4.8 |
6.6 |
Russia |
Refinancing Rate |
10.00 (June 19, 2007) |
(-)100 |
(-)150 |
(-)50 |
9.0 |
11.9 |
6.5 |
7.6 |
|
|
|
|
(150) |
(100) |
|
|
|
|
South Africa |
Repo Rate |
11.00 (Dec. 11, 2007) |
(-)50 |
200 |
200 |
5.4 |
8.4 * |
4.5 |
5.1 |
Thailand |
14-day Repurchase |
|
|
|
|
|
|
|
|
|
Rate |
5.00 (June 7, 2006) |
225 |
50 |
|
|
|
|
|
|
1-day Repurchase |
|
|
|
|
|
|
|
|
|
Rate |
3.25(July 18, 2007) |
|
(-)44 ^ |
(-)125 |
3.5 |
3.2 |
4.5 |
5.1 |
@ : Bank Indonesia adopted BI rate as the reference rate with the formal adoption of inflation targeting in July2005.
** : The Bank of Japan decided on March 9, 2006 to change the operating target of money market operations from the outstanding balance of current accounts at the Bank to the uncollateralised overnight call rate.
^ : Change over January 16, 2007. Effective January 17, 2007, the 1-day repurchase rate replaced the 14-day repurchase rate as the policy rate.
# : Q3 of 2007. * : November 2007.
+ : The tiering system on placement with the BSP was removed and interest rates were adjusted to 6.0 per cent for the reverse repo rate and 8.0 per cent for the repo rate effective July 13, 2007.
Note :
1. For India, data on inflation pertain to CPI for Industrial Workers.
2. Figures in parentheses in column (3) indicate the date when the policy rates were last revised.
3. Figures in parentheses in columns (5) and (6) indicate the variation in cash reserve ratios during the period.
Source : International Monetary Fund, websites of respective central banks and the Economist. |

while leaving the policy rate unchanged, the ECB noted that it remains prepared to act pre-emptively so that second-round effects and upside risks to price stability over the medium term do not materialise. The policy rates were last raised by 25 basis points on June 6, 2007 (Chart 17).
Although Japan's economy is expected to continue to expand moderately, the pace of growth is likely to slow mainly due to the drop in housing investment. The year-on-year rate of change in consumer prices is projected to follow a positive trend due to the rise in prices of petroleum products and food products in the short run and the positive output gap in the longer run. Against this backdrop, the Bank of Japan (BoJ) kept its policy rate unchanged at each of its meetings held since February 2007 when it had raised the uncollateralised overnight call rate (the operating target of monetary policy since March 2006) by 25 basis points to 0.50 per cent. Amongst other major advanced economies, the policy rate was cut by 50 basis points (including 25 basis points in January 2008) by the Bank of Canada while the Reserve Bank of Australia, the Sveriges Riksbank (Sweden) and Norges Bank (Norway) raised policy rates by 25 basis points each during the third quarter of 2007-08. Notwithstanding the appreciation of exchange rates, inflation pressures remained firm in major emerging market economies (EMEs) on the back of strong growth and ample liquidity. Consumer price inflation in China increased to 6.9 per cent in November 2007 from 6.2 per cent in September 2007 (and 1.9 per cent a year earlier) mainly due to higher food prices (Chart 18). Economic activity in China has remained buoyant in 2007 so far with real GDP growth accelerating to 11.5 per cent during the third quarter of 2007 from 10.7 per cent a year ago. In order to address the excess liquidity in the banking system and ease pressures on money and credit expansion, the People's Bank of China (PBC) increased the benchmark 1-year lending rate further by 18 basis points 
effective December 21, 2007 to 7.47 per cent, i.e., a total hike of 189 basis points since April 2006. Apart from continued issuances of its own bills to mop up liquidity, the PBC raised the cash reserve ratio (CRR) by another 200 basis points since end-September 2007 - 50 basis points effective October 25, 2007, 100 basis points effective December 25, 2007 and 50 basis points to be effective on January 25, 2008 - to 14.5 per cent. The CRR has, thus, been increased by 700 basis points since July 2006. According to the PBC, these adjustments are conducive to prevent the economy from overheating and structural price rises from evolving into apparent inflation.
In Russia, consumer price inflation remained high, increasing from 7.4 per cent in March 2007 to 9.4 per cent in September 2007 and further to 11.9 per cent in December 2007 amidst strong growth. Growth in money supply (M2) accelerated to 52 per cent, year-on-year, as on December 1, 2007 from 47 per cent a year ago. The Bank of Russia raised the required reserve ratio on credit institutions' liabilities to non-resident banks in roubles and foreign currency by another 100 basis points to 4.5 per cent effective January 15, 2008 (it was earlier reduced by 100 basis points effective October 11, 2007). The refinancing rate has remained unchanged since June 2007, when it was reduced by 50 basis points to 10.0 per cent.
The South African Reserve Bank has raised its policy rate by 100 basis points since end-September 2007 - 50 basis points each effective October 12, 2007 and December 7, 2007 - to 11.0 per cent. The policy rate has thus been raised by 400 basis points since the tightening began in June 2006 to ensure that the short-term impact of higher inflation does not allow inflation expectations to become entrenched at higher levels. After keeping the policy rate unchanged during the third quarter of 2007-08, the Bank of Israel raised its policy rate by 25 basis points to 4.25 per cent effective January 2008 in view of the rise in inflationary pressures on account of continued rapid growth and closing of output gaps as well as rise in import prices, especially of food and energy.
In Korea, inflation increased to 3.6 per cent in December 2007 from 2.3 per cent in September 2007 (and 2.1 per cent a year ago) mainly due to high oil prices. Although the upward trend of real estate prices has flattened out, financial institutions' lending continues to show a steady increase. Although financial markets are characterised by ample liquidity, financial prices have shown increased volatility following the international financial market unrest. According to the MPC, although the domestic economy is likely to maintain its upward trend, future economic developments are surrounded with a high degree of uncertainty largely due to the run-up in international oil prices and the prolonged international financial market unrest. The Bank of Korea, therefore, has left its policy rate unchanged at 5.0 per cent since August 9, 2007 (when it was last raised by 25 basis points). In Thailand, inflation accelerated in line with rising international oil and commodity prices to 3.2 per cent in December 2007 from 2.1 per cent in September 2007 (it was 3.5 per cent a year ago). Real GDP growth also started to recover reflecting improvement in both consumption and investment. According to the MPC, the overall growth momentum improved although risks to growth remained, particularly from the global economy. Notwithstanding increased risks to inflation, core inflation was expected to remain within the target range for the next eight quarters. The MPC, therefore, has left 1-day repurchase rate unchanged at 3.25 per cent since July 18, 2007 (when it was last cut by 25 basis points).
After reducing its policy rate by 850 basis points between September 2005 and September 2007, the central bank of Brazil left it unchanged during the third quarter of 2007-08 at 11.25 per cent. Inflation has increased in recent months (4.5 per cent in December 2007) and the pace of demand expansion remained robust signifying inflationary pressures on short-term inflation. Against this backdrop, the Monetary Policy Committee emphasised the time lags in the transmission of monetary policy and noted that the evaluation of alternative monetary policy stances should necessarily focus on the prospective inflation scenario and its risks, instead of current inflation indicators.
Amongst other emerging economies, economic expansion in Indonesia is likely to maintain its pace driven by rising consumption and exports. Inflation in 2007 was expected to come within the target range of 6 ± 1 per cent. According to Bank Indonesia, the impact on economic expansion and inflation brought about by external shocks and surging oil prices remain manageable. Despite looming inflationary pressures in 2008, overall progress is expected to be consistent with a long-term declining trend. Accordingly, the Bank Indonesia lowered its policy rate further by 25 basis points to 8.0 per cent on December 6, 2007 - a total of 475 basis points since May 2006. The lower rate is expected to deliver an economic stimulus and sustain momentum for stronger economic growth while maintaining macroeconomic stability. The central bank of Turkey also cut its policy rates, i.e., overnight borrowing and lending rates by 150 basis points and 225 basis points, respectively, since end-September 2007 to support economic activity. The MPC noted that aggregate demand conditions continued to support the disinflation process and notwithstanding the risks related to energy and food prices, inflation is expected to decelerate. An assessment of key macroeconomic indicators in select EMEs shows that consumer price inflation was in the range of 3.2-11.9 per cent during November/December 2007. Inflation in India was the fifth highest amongst the select EMEs. Real policy rates in most countries ranged between 0.0 and 2.6 per cent in December 2007 (Table 28). Major EMEs, except India
Table 28: Key Macroeconomic Indicators: Emerging Markets |
(Per cent) |
Country |
Consumer Price |
Current Account |
Real Efective |
Central Govt. |
Real Policy |
Real GDP |
|
Inflation |
Balance |
Exchange Rate |
Fiscal Balance |
Rate |
Growth |
|
|
(per cent to GDP) |
(REER) |
(per cent of GDP) |
|
|
|
Dec. |
Dec. |
|
Dec. |
Dec. |
|
Dec. |
Dec. |
|
|
2006 |
2007 |
2005 |
2006 |
2006 |
2007 |
2005 |
2006 |
2006 |
2007 |
2005 |
2006 |
1 |
2 |
3 |
4 |
5 |
6 |
7 |
8 |
9 |
10 |
11 |
12 |
13 |
Brazil |
3.1 |
4.5 |
1.6 |
1.2 |
2.1 |
15.3 |
-3.4 |
-3.2 |
10.2 |
6.8 |
2.9 |
3.7 |
China |
1.9 |
6.9 * |
7.2 |
9.4 |
-0.9 |
5.1 |
-1.3 |
-0.6 |
3.3 |
0.6 |
10.4 |
11.1 |
|
|
|
|
|
|
|
(17.9) |
(17.3) |
|
|
|
|
India |
6.3 |
5.5 * |
-1.2 |
-1.1 |
0.0 |
7.7 |
-4.1 |
-3.5 |
0.4 |
2.3 |
9.0 |
9.4 |
|
(5.9) |
(3.5) |
(-6.4) |
(-6.9) |
|
|
(63.4) |
(61.5) |
(1.4) |
(4.3) |
|
|
Indonesia |
6.6 |
6.6 |
0.1 |
2.7 |
7.6 |
-4.4 |
-0.5 |
-1.0 |
3.2 |
1.4 |
5.7 |
5.5 |
|
|
|
|
|
|
|
(46.5) |
(40.9) |
|
|
|
|
Israel |
-0.1 |
3.4 |
3.3 |
5.6 |
1.0 |
0.4 |
-2.9 |
-2.7 |
5.1 |
0.6 |
5.3 |
5.2 |
Korea |
2.1 |
3.6 |
1.9 |
0.7 |
5.9 |
-5.9 |
1.9 |
1.8 |
2.4 |
1.4 |
4.2 |
5.0 |
|
|
|
|
|
|
|
(29.5) |
(32.2) |
|
|
|
|
Philippines |
4.3 |
3.9 |
2.0 |
4.3 |
6.1 |
14.0 |
-2.7 |
-1.0 |
3.2 |
1.4 |
4.9 |
5.4 |
Russia |
9.0 |
11.9 |
11.1 |
9.7 |
8.6 |
6.1 |
7.5 |
7.4 |
2.0 |
-1.9 |
6.4 |
6.7 |
South Africa |
5.4 |
8.4 * |
-4.0 |
-6.5 |
-12.7 |
1.4 |
__ |
__ |
3.2 |
2.6 |
5.1 |
5.0 |
Thailand |
3.5 |
3.2 |
-4.5 |
1.6 |
11.1 |
0.8 |
0.2 |
0.1 |
1.5 |
0.0 |
4.5 |
5.0 |
|
|
|
|
|
|
|
(26.1) |
(27.3) |
|
|
|
|
*: November 2007.
Note :
1. For India, data pertain to fiscal years 2005-06 and 2006-07.
2. Consumer price inflation data are on a year-on-year basis. Data for India are for CPI Industrial Workers.
3. Real policy rate is the policy rate less year-on-year consumer price inflation. For India, repo rate is used.
4. Figures in parentheses in columns (2) and (3) refer to wholesale price inflation.
5. Figures in parentheses in columns (4) and (5) refer to trade balance/GDP ratio.
6. Data on fiscal balance for Korea and Israel pertain to general government balance.
7. Figures in parentheses in columns (8) and (9) refer to central government debt/GDP ratio. For China, data refer to public sector debt.
8. Figures in parentheses in columns (10) and (11) for India are based on wholesale price inflation.
9. Data on REER refer to year-on-year variation in broad indices (CPI-based) compiled by the Bank for International Settlements. A positive figure indicates appreciation, while a negative figure indicates depreciation. For India, data are based on movements in 6-currency indices.
Source : International Monetary Fund, Asian Development Bank, Bank for International Settlements, World Bank, the Economist and official websites of respective central banks. |
and South Africa, recorded surplus in current accounts in 2006. The real effective exchange rate (REER) for the select EMEs, barring the currencies in Indonesia and Korea, underwent real appreciation, on a year-on-year basis, in December 2007. Although the Centre's fiscal deficit in India declined during 2006-07 and was budgeted to decline further during 2007-08, it was likely to remain higher than that in most EMEs.
Global Commodity Prices
Global commodity prices firmed up during the third quarter of 2007-08 led by food and crude oil prices, although there was some moderation in prices of metals (Table 29 and Chart 19).
International crude oil prices, represented by the West Texas Intermediate (WTI), rose sharply during the third quarter of 2007-08, reflecting tight supply-demand balance, geo-political tensions, weakening of the US dollar against major currencies and increased interest from investors and financial market players (Table 30). WTI prices touched a historical peak of US $ 99.6 a barrel level on January 2, 2008 and eased somewhat subsequently but continued to remain high and volatile (US $ 89.9 a barrel on January 23, 2008).
Table 29: International Commodity Prices |
Commodity |
Unit |
2004 |
Index |
Variation (Per cent) |
|
|
|
2004 |
2005 |
2006 |
2007 |
2007 |
Dec. 2007
over |
Dec. 2007 over |
|
|
|
|
|
|
|
Mar. |
Jun. |
Sep. |
Dec. |
Mar. 2007 |
Dec. 2006 |
1 |
2 |
3 |
4 |
5 |
6 |
7 |
8 |
9 |
10 |
11 |
12 |
13 |
Energy |
|
|
|
|
|
|
|
|
|
|
|
|
Coal |
$/mt |
53.0 |
100 |
90 |
93 |
124 |
105 |
116 |
129 |
172 |
64.3 |
82.9 |
Crude oil (Average) |
$/bbl |
37.7 |
100 |
142 |
170 |
188 |
161 |
181 |
203 |
237 |
47.7 |
46.8 |
Non-Energy Commodities |
|
|
|
|
|
|
|
|
|
|
|
|
Palm oil |
$/mt |
471.3 |
100 |
90 |
102 |
165 |
132 |
171 |
177 |
200 |
51.6 |
61.7 |
Soybean oil |
$/mt |
616.0 |
100 |
88 |
97 |
143 |
117 |
135 |
156 |
188 |
60.9 |
65.8 |
Soybeans |
$/mt |
306.5 |
100 |
90 |
88 |
125 |
105 |
118 |
139 |
168 |
59.9 |
73.4 |
Rice |
$/mt |
237.7 |
100 |
120 |
128 |
137 |
134 |
136 |
137 |
151 |
12.8 |
17.9 |
Wheat |
$/mt |
156.9 |
100 |
97 |
122 |
163 |
127 |
142 |
208 |
235 |
85.1 |
80.4 |
Sugar |
c/kg |
15.8 |
100 |
138 |
206 |
141 |
146 |
130 |
136 |
149 |
2.2 |
-7.8 |
Cotton A Index |
c/kg |
136.6 |
100 |
89 |
93 |
102 |
94 |
98 |
110 |
111 |
18.2 |
16.0 |
Aluminium |
$/mt |
1716.0 |
100 |
111 |
150 |
154 |
161 |
156 |
139 |
139 |
-13.8 |
-15.4 |
Copper |
$/mt |
2866.0 |
100 |
128 |
235 |
248 |
225 |
261 |
267 |
230 |
2.1 |
-1.3 |
Gold |
$/toz |
409.2 |
100 |
109 |
148 |
170 |
160 |
160 |
174 |
196 |
22.6 |
27.5 |
Silver |
c/toz |
669.0 |
100 |
110 |
173 |
200 |
197 |
197 |
193 |
214 |
8.7 |
7.6 |
Steel cold-rolled coil/sheet |
$/mt |
607.1 |
100 |
121 |
114 |
107 |
107 |
107 |
107 |
107 |
0.0 |
0.0 |
Steel hot-rolled coil/sheet |
$/mt |
502.5 |
100 |
126 |
119 |
109 |
109 |
109 |
109 |
109 |
0.0 |
0.0 |
Tin |
c/kg |
851.3 |
100 |
87 |
103 |
171 |
163 |
166 |
176 |
191 |
17.1 |
45.7 |
Zinc |
c/kg |
104.8 |
100 |
132 |
313 |
309 |
312 |
344 |
275 |
225 |
-28.1 |
-46.6 |
$: US dollar. c: US cent. bl: barrel. mt: metric tonne. kg: Kilogram. toz: troy oz.
Source : Based on World Bank's actual commodity price data. The year 2004 has been taken as the base to better exhibit price trends over the relevant period. |

In view of the tight demand supply-balance, prices are expected to remain firm. According to the US Energy Information Administration (EIA), world oil demand will grow much faster than oil supply outside of the Organisation of the Petroleum Exporting Countries (OPEC), leading to the possibility of upward pressure on prices. However, in its meeting in Abu Dhabi on December 5, 2007, the OPEC decided
Table 30: International Crude Oil Prices |
(US dollars per barrel) |
Year/Month |
Dubai Crude |
UK Brent |
US WTI |
Average |
Indian |
| |
|
|
|
Crude Price |
Basket Price |
1 |
2 |
3 |
4 |
5 |
6 |
2001-02 |
21.8 |
23.2 |
24.1 |
23.0 |
22.4 |
2002-03 |
25.9 |
27.6 |
29.2 |
27.6 |
26.6 |
2003-04 |
26.9 |
29.0 |
31.4 |
29.1 |
27.8 |
2004-05 |
36.4 |
42.2 |
45.0 |
41.3 |
38.9 |
2005-06 |
53.4 |
58.0 |
59.9 |
57.1 |
55.4 |
2006-07 |
60.9 |
64.4 |
64.7 |
63.3 |
62.4 |
March 2004 |
30.5 |
33.8 |
36.7 |
33.7 |
31.9 |
March 2005 |
45.6 |
53.1 |
54.2 |
50.9 |
48.8 |
March 2006 |
57.7 |
62.3 |
62.9 |
60.9 |
59.6 |
March 2007 |
59.1 |
62.1 |
60.6 |
60.6 |
60.4 |
April 2007 |
63.8 |
67.4 |
63.9 |
65.1 |
65.4 |
May 2007 |
64.5 |
67.5 |
63.5 |
65.2 |
65.8 |
June 2007 |
65.8 |
71.3 |
67.5 |
68.2 |
68.2 |
July 2007 |
69.5 |
77.2 |
74.1 |
73.6 |
72.8 |
August 2007 |
67.2 |
70.8 |
72.4 |
70.1 |
68.8 |
September 2007 |
73.3 |
77.1 |
79.9 |
76.8 |
74.9 |
October 2007 |
77.1 |
83.0 |
85.9 |
82.2 |
79.6 |
November 2007 |
86.7 |
92.5 |
94.8 |
91.3 |
89.2 |
December 2007 |
85.8 |
91.5 |
91.4 |
89.5 |
88.2 |
Source : International Monetary Fund and the World Bank. |
Table 31: World Supply-Demand Balance of Oil |
(Million barrels per day) |
Item |
2003 |
2004 |
2005 |
2006 |
2007 |
2008 |
2008 (P) |
|
|
|
|
|
(P) |
(P) |
Q1 |
Q2 |
Q3 |
Q4 |
1 |
2 |
3 |
4 |
5 |
6 |
7 |
8 |
9 |
10 |
11 |
Demand |
1. OECD |
48.7 |
49.5 |
49.6 |
49.3 |
49.1 |
49.5 |
50.5 |
48.4 |
49.0 |
50.2 |
2. Non-OECD |
31.2 |
33.0 |
34.4 |
35.4 |
36.7 |
37.9 |
37.2 |
38.0 |
38.1 |
38.5 |
of which: China |
5.6 |
6.5 |
6.9 |
7.3 |
7.7 |
8.1 |
7.8 |
8.1 |
8.2 |
8.4 |
3. Total (1+2) |
79.9 |
82.5 |
84.0 |
84.7 |
85.9 |
87.5 |
87.7 |
86.4 |
87.0 |
88.7 |
Supply |
4. Non-OPEC |
48.9 |
50.1 |
50.3 |
49.3 |
49.4 |
50.2 |
49.5 |
49.9 |
50.4 |
51.1 |
5. OPEC |
30.7 |
32.9 |
34.2 |
35.3 |
35.5 |
37.5 |
37.0 |
37.1 |
37.9 |
37.8 |
6. Total (4+5) |
79.6 |
83.1 |
84.5 |
84.6 |
84.8 |
87.7 |
86.5 |
87.0 |
88.2 |
88.9 |
Stock Changes |
0.3 |
-0.6 |
-0.5 |
0.1 |
1.1 |
-0.2 |
1.2 |
-0.6 |
-1.2 |
-0.2 |
P : Projections.
Source : US Energy Information Administration, January 8, 2008. |
to maintain its existing production quotas observing that the global oil market continued to be well supplied. The EIA expects WTI (average) prices to firm up further to US $ 87.2 per barrel during 2008 from US $ 72.3 a barrel during 2007. Futures markets also suggest that WTI prices are expected to remain firm at around US $ 87-88 a barrel levels during the period February-July 2008. High and volatile international crude oil prices, thus, pose another major risk to the global inflation outlook (Table 31).
Metal prices eased further during the third quarter of 2007-08, reflecting lower demand and some improvement in supply. Between September 2007 and December 2007, prices of copper, zinc, lead and nickel fell by 14 per cent, 18 per cent, 20 per cent and 12 per cent, respectively, reflecting concerns about US slowdown and lower Chinese demand. On the other hand, tin prices increased by about 8 per cent over the same period. As a result, the IMF's metals price index declined by 7.0 per cent between September-December 2007 on top of about 12 per cent decline between June-September 2007. On a year-on-year basis, in December 2007, while prices of lead (50 per cent) and tin (46 per cent) continued to show sharp increases, prices of other metals such as nickel, zinc, copper and aluminium witnessed declines. Steel prices have remained flat during the year reflecting higher global production led by China and Brazil.
Food prices firmed up further during the third quarter of 2007-08 led by wheat and oilseeds/edible oils, reflecting surging demand (both consumption demand and demand for non-food uses such as bio-fuels production) and low stocks of major crops, partly on account of weather related disturbances on 
production in some major producing regions such as Australia (Chart 20). Reflecting these factors, international prices of wheat, soybeans, soybean oils and palm oils increased by 80 per cent, 73 per cent, 66 per cent and 62 per cent, respectively, year-on-year, in December 2007. Consequently, the IMF food price index increased by 26.4 per cent on a year-on-year basis and surpassed the level which was last seen in the late 1980. The supply side pressures on global food prices do not appear to be abating, especially in the case of wheat and oilseeds/edible oils. According to the US Department of Agriculture (USDA) in January 2008, global wheat stocks are expected to decline further by almost 11 per cent (on top of almost 16 per cent decline during 2006-07) during 2007-08 to about 111 million tonnes - their lowest levels since 1981-82. Global oilseeds stocks are also expected to decline by almost 25 per cent during 2007-08 to 53.2 million tonnes. This mainly reflects expected fall in global oilseeds production, mostly caused by a shift of plantings from soybean to maize in northern hemisphere countries and increase in global utilisation of oilseed products. Global vegetables oil stocks are also expected to decline further by about 7 per cent during 2007-08 (to 8.1 million tonnes) on top of almost 15 per cent decline witnessed last year, partly due to growing demand from the biofuel industry. Notwithstanding higher coarse grains production, mainly on account of record production of maize in the US following record high prices, the world's year-ending stocks are projected to decline by almost 8 per cent due to forecast about increase in feed use of coarse grains, especially corns. Rice prices also increased during the third quarter of 2007-08 (around 10 per cent), reflecting low stocks. According to the USDA, rice stocks are expected to decline by about 4 per cent in 2007-08. Global barley stocks are also projected to decline to their lowest levels in 42 years at 15.1 million tonnes during 2007-08. Thus, global food prices are likely to remain firm given the prospects for various crops and their lower levels of year-ending stocks.
International sugar prices remained largely range bound during the third quarter of 2007-08, reflecting higher production in traditional importing countries. Prices in December 2007 were 41 per cent lower than the recent peak touched in February 2006. According to the International Sugar Organisation, global sugar production is estimated to increase further by 4.3 million tonnes to 170.3 million tonnes during 2007-08 (October-September) season, exceeding global consumption by 11.1 million tonnes. On the other hand, global cotton prices increased marginally during September-December 2007 on top of an increase of about 12 per cent during June-September 2007, reflecting shortfalls in production. According to the latest assessment by the International Cotton Advisory Committee (ICAC), the Cotlook A index is expected to increase by about 13 per cent during 2007-08 due to an estimated decline in world cotton stocks by about 12 per cent to 11.2 million tonnes in 2007-08. World cotton production is, however, expected to increase by about 5 per cent in 2008-09, reflecting expected rise in yields.
In response to high food prices, especially of wheat, corns and oilseeds/ edible oils and their implications for headline inflation and inflationary expectations, Governments in both developed and developing countries have resorted to numerous market interventions in the form of price controls, reduction of import barriers and/or imposition of export restrictions to contain price increases and prevent consumption from falling.
Inflation Conditions in India
The Annual Policy Statement for 2007-08 (April 2007) of the Reserve Bank had observed that the stance of monetary policy in 2007-08 would be conditioned by the patterns in which the global and, more particularly, the domestic environment unfolds. It had also reaffirmed the resolve to respond swiftly with all possible measures to developments impinging on inflation expectations and the growth momentum. Noting that the overarching policy challenge was to manage the transition to a higher growth path while containing inflationary pressures, the policy preference for the period ahead was indicated as strongly in favour of price stability and well-anchored inflation expectations with the endeavour being to contain inflation close to 5.0 per cent in 2007-08 and to the range of 4.0-4.5 per cent over the medium-term. This objective, according to the Statement, would be conducive for maintaining self-accelerating growth over the medium-term. The First Quarter Review of Annual Statement on Monetary Policy for 2007-08 (July 2007) noted that there were indications that the combination of lagged and cumulative effects of monetary policy actions and fiscal and administrative measures for supply management had had a salutary effect on inflation expectations, and headline inflation had turned benign in sharp contrast to the last quarter of 2006-07. Going forward, the Review added that monetary management would need to be watchful of movements in commodity prices, particularly oil prices, the elevated levels of asset prices and the re-emergence of pricing power among producers as potential threats to inflation expectations. The outlook for inflation in 2007-08 was, however, left unchanged in the Review. Furthermore, the Reserve Bank reiterated its resolve to continue with its policy of active demand management of liquidity through the use of all the policy instruments at its disposal flexibly, as and when the situation warranted. On a review of the liquidity situation, the cash reserve ratio (CRR) was raised further by 50 basis points each with effect from the fortnight beginning August 4, 2007 and November 10, 2007 (Table 32).
Table 32: Movement in Key Policy Rates and Inflation in India |
(Per cent) |
Effective since |
Reverse Repo Rate |
Repo Rate |
Cash Reserve Ratio |
WPI Inflation |
1 |
2 |
3 |
4 |
5 |
March 31, 2004 |
4.50 |
6.00 |
4.50 |
4.6 |
September 18, 2004 |
4.50 |
6.00 |
4.75 (+0.25) |
7.9 |
October 2, 2004 |
4.50 |
6.00 |
5.00 (+0.25) |
7.1 |
October 27, 2004 |
4.75 (+0.25) |
6.00 |
5.00 |
7.4 |
April 29, 2005 |
5.00 (+0.25) |
6.00 |
5.00 |
6.0 |
October 26, 2005 |
5.25 (+0.25) |
6.25 (+0.25) |
5.00 |
4.5 |
January 24, 2006 |
5.50 (+0.25) |
6.50 (+0.25) |
5.00 |
4.2 |
June 9, 2006 |
5.75 (+0.25) |
6.75 (+0.25) |
5.00 |
4.9 |
July 25, 2006 |
6.00 (+0.25) |
7.00 (+0.25) |
5.00 |
4.7 |
October 31, 2006 |
6.00 |
7.25 (+0.25) |
5.00 |
5.3 |
December 23, 2006 |
6.00 |
7.25 |
5.25 (+0.25) |
5.8 |
January 6, 2007 |
6.00 |
7.25 |
5.50 (+0.25) |
6.4 |
January 31, 2007 |
6.00 |
7.50 (+0.25) |
5.50 |
6.7 |
February 17, 2007 |
6.00 |
7.50 |
5.75 (+0.25) |
6.0 |
March 3, 2007 |
6.00 |
7.50 |
6.00 (+0.25) |
6.5 |
March 31, 2007 |
6.00 |
7.75 (+0.25) |
6.00 |
5.9 |
April 14, 2007 |
6.00 |
7.75 |
6.25 (+0.25) |
6.3 |
April 28, 2007 |
6.00 |
7.75 |
6.50 (+0.25) |
6.0 |
August 4, 2007 |
6.00 |
7.75 |
7.00 (+0.50) |
4.4 |
November 10, 2007 |
6.00 |
7.75 |
7.50 (+0.50) |
3.2 |
Note :
1. With effect from October 29, 2004, the nomenclature of repo and reverse repo was changed in keeping with international usage. Now, reverse repo indicates absorption of liquidity and repo signifies injection of liquidity. Prior to October 29, 2004, repo indicated absorption of liquidity, while reverse repo meant injection of liquidity. The nomenclature in this document is based on the new usage of terms even for the period prior to October 29, 2004.
2. Figures in parentheses indicate change in policy rates. |
The Mid-term Review of the Annual Policy for 2007-08 (October 2007) noted that while the headline inflation outcomes in the recent past, juxtaposed with expectations survey results and information from financial markets, were indicative of reasonably well-anchored inflation expectations, some of the developments had shown that there were major risks to this assessment that were evolving. Threats to inflation in the future emanated not only from domestic liquidity conditions but also from the underlying global pressures. The possible impact of injection of liquidity by central banks to meet the recent turbulence in global financial markets on global inflation was not clear. In any case, globally, pressures on future inflation were embedded in the high and volatile levels of international crude prices as well as prices of food and metals. A key issue going forward in this regard, according to the Review, was the timing of the pass-through in the context of the expected path of headline inflation. Hence, over the next twelve to eighteen months, risks to inflation and inflation expectations would continue to demand priority in policy monitoring. Accordingly, on a review of the then prevailing liquidity situation, it was considered desirable to increase the CRR by 50 basis points to 7.5 per cent with effect from the fortnight beginning November 10, 2007. The Mid-term Review further noted that the policy resolve going forward should be to consolidate the success in lowering inflation on an enduring basis so that an environment of stability prevails to nurture and protect the transition to higher growth. Accordingly, it reiterated the policy endeavour of containing inflation close to 5.0 per cent in 2007-08. In recognition of India's evolving integration with the global economy and societal preferences in this regard, it further resolved to condition expectations in the range of 4.0-4.5 per cent so that an inflation rate of around 3.0 per cent becomes a medium-term objective consistent with India's broader integration into the global economy.
Wholesale Price Inflation
Headline inflation, based on movement in the wholesale price index (WPI), was 3.8 per cent on January 5, 2008 (3.4 per cent at end-September 2007) as compared with 5.9 per cent at end-March 2007 (and 6.4 per cent a year ago). The easing in inflation from a year ago was mainly led by primary food articles and some manufactured products items. The y-o-y inflation, excluding fuel, at 3.8 per cent, came closer to the headline inflation rate (Table 33 and Chart 21). Headline inflation has moved in a range of 3.0-6.4 per cent during 2007-08 so far. The annual average WPI inflation rate (average of 52 weeks) for the week ended January 5, 2008 eased to 4.7 per cent from 5.3 per cent at end-September 2007 and 4.9 per cent a year ago.
Primary articles' inflation, y-o-y, eased to 4.1 per cent on January, 5 2008 from 6.2 per cent at end-September 2007 and 9.4 per cent a year ago (10.7 per cent at end-March 2007). The deceleration was mainly due to easing of food articles' inflation to 2.7 per cent from 9.5 per cent a year ago, which
Table 33: Wholesale Price Inflation in India (year-on-year) |
(Per cent) |
Commodity |
|
2006-07 |
2006-07 |
2007-08 (P) |
|
|
(March 31) |
(January 6) |
(January 5) |
|
Weight |
Inflation WC |
Inflation |
WC |
Inflation |
WC |
1 |
2 |
3 |
4 |
5 |
6 |
7 |
8 |
All Commodities |
100.0 |
5.9 |
100.0 |
6.4 |
100.0 |
3.8 |
100.0 |
1. Primary Articles |
22.0 |
10.7 |
39.0 |
9.4 |
32.4 |
4.1 |
24.5 |
Food Articles |
15.4 |
8.0 |
20.8 |
9.5 |
23.0 |
2.7 |
11.1 |
i. |
Rice |
2.4 |
5.7 |
2.1 |
5.3 |
1.8 |
7.2 |
4.0 |
ii. |
Wheat |
1.4 |
7.3 |
1.8 |
17.4 |
3.9 |
-2.2 |
-0.9 |
iii. |
Pulses |
0.6 |
12.5 |
1.4 |
26.0 |
2.6 |
-9.2 |
-1.8 |
iv. |
Vegetables |
1.5 |
1.2 |
0.3 |
2.2 |
0.5 |
7.1 |
2.4 |
v. |
Fruits |
1.5 |
5.7 |
1.8 |
12.6 |
3.6 |
-10.6 |
-5.4 |
vi. |
Milk |
4.4 |
8.4 |
5.8 |
8.2 |
5.2 |
9.5 |
10.4 |
vii. |
Eggs, Fish and Meat |
2.2 |
9.4 |
3.8 |
2.0 |
0.8 |
2.3 |
1.5 |
Non-Food Articles |
6.1 |
17.2 |
15.6 |
9.6 |
8.4 |
8.4 |
12.7 |
i. |
Raw Cotton |
1.4 |
21.9 |
3.5 |
-3.9 |
-0.7 |
24.5 |
6.2 |
ii. |
Oilseeds |
2.7 |
31.6 |
11.0 |
22.9 |
7.6 |
10.0 |
6.5 |
iii. |
Sugarcane |
1.3 |
1.1 |
0.3 |
1.1 |
0.3 |
0.0 |
0.0 |
Minerals |
0.5 |
17.5 |
2.6 |
7.0 |
1.1 |
1.9 |
0.5 |
2. Fuel, Power, Light and Lubricants |
14.2 |
1.0 |
4.0 |
3.6 |
12.9 |
3.7 |
21.2 |
i. |
Mineral Oils |
7.0 |
0.5 |
1.1 |
3.4 |
7.1 |
5.4 |
18.1 |
ii. |
Electricity |
5.5 |
2.3 |
2.8 |
4.9 |
5.7 |
-0.7 |
-1.4 |
iii. |
Coal Mining |
1.8 |
0.0 |
0.0 |
0.0 |
0.0 |
8.8 |
4.5 |
3. Manufactured Products |
63.8 |
6.1 |
57.3 |
6.3 |
54.6 |
3.7 |
54.9 |
i. |
Food Products |
11.5 |
6.1 |
10.5 |
4.0 |
6.6 |
5.3 |
14.3 |
|
of which: Sugar |
3.6 |
-12.7 |
-6.6 |
-4.0 |
-1.9 |
-10.3 |
-7.4 |
|
Edible Oils |
2.8 |
14.1 |
4.7 |
12.7 |
4.0 |
8.9 |
5.1 |
ii. |
Cotton Textiles |
4.2 |
-1.0 |
-0.6 |
3.4 |
1.8 |
-7.2 |
-6.2 |
iii. |
Man Made Fibres |
4.4 |
3.9 |
1.3 |
2.4 |
0.8 |
3.3 |
1.7 |
iv. |
Chemicals and Chemical Products |
11.9 |
3.6 |
7.1 |
2.6 |
4.7 |
5.5 |
16.0 |
|
of which : Fertilisers |
3.7 |
1.8 |
1.0 |
1.8 |
0.9 |
1.5 |
1.3 |
v. |
Basic Metals, Alloys and Metal Products |
8.3 |
11.3 |
17.4 |
15.1 |
21.2 |
2.3 |
5.8 |
|
of which: Iron and Steel |
3.6 |
8.1 |
6.0 |
11.4 |
7.7 |
7.6 |
9.1 |
vi. |
Non-Metallic Mineral Products |
2.5 |
9.0 |
3.6 |
14.1 |
4.8 |
8.7 |
5.4 |
|
of which: Cement |
1.7 |
11.6 |
3.2 |
19.4 |
4.5 |
10.7 |
4.7 |
vii. |
Machinery and Machine Tools |
8.4 |
8.1 |
8.6 |
8.0 |
7.9 |
5.2 |
8.7 |
|
of which: Electrical Machinery |
5.0 |
12.9 |
6.7 |
11.9 |
5.7 |
8.1 |
6.8 |
viii. |
Transport Equipment and Parts |
4.3 |
2.0 |
1.2 |
1.2 |
0.7 |
2.1 |
1.9 |
Memo: |
Food Items (Composite) |
26.9 |
7.3 |
31.2 |
7.3 |
29.7 |
3.7 |
25.4 |
WPI Excluding Food |
73.1 |
5.5 |
68.8 |
6.0 |
70.3 |
3.8 |
74.6 |
WPI Excluding Fuel |
85.8 |
7.4 |
96.0 |
7.2 |
87.1 |
3.8 |
78.8 |
WC : Weighted Contribution.
P : Provisional. |
was led by the decline in the prices of wheat, pulses, fruits, and condiments and spices, partly offset by increase in the prices of rice and milk. Wheat prices declined by 2.2 per cent, year-on-year, as on January 5, 2008 as against 
an increase of 17.4 per cent a year ago, reflecting expectations about improved production following the normal monsoon and supply-side measures undertaken by the Government. Notwithstanding the y-o-y decline, domestic wheat prices remained at elevated levels. These along with firm international prices, lower acreage under the domestic rabi wheat crop (which is down by about 2 per cent, y-o-y, as per the latest data available up to January 18, 2008) and sluggish yield raise concerns, especially as domestic consumption is rising. Rice prices increased by 7.2 per cent, y-o-y, on top of 5.3 per cent a year ago, reflecting lower stocks (at around 10.7 million tonnes as on November 1, 2007 which was lower than 12.5 million tonnes a year ago). Elevated rice prices continued to be a matter of concern in view of the decline in stocks, low productivity and exposure of the crop to frequent weather-related disturbances in the main producing regions as well as other structural factors. Prices of oilseeds, y-o-y, increased by 10.0 per cent on top of an increase of 22.9 per cent a year ago, which could be attributed to higher demand, lower domestic production during 2006-07 season, lower acreage under the current rabi crop (which is down by almost 11 per cent, y-o-y, as per the latest data available up to January 18, 2008) as well as rising global prices. Raw cotton prices were 24.5 per cent higher, y-o-y, as on January 5, 2008 as against a decline of 3.9 per cent in the corresponding period of previous year, in line with international price movements; as noted earlier, the Cotlook A index is expected to increase by 13 per cent during 2007-08 (Chart 22).
Fuel group inflation, which was negative during June-November 2007, turned positive from the beginning of December 2007 (3.7 per cent on January 5, 2008) partly reflecting the base effects of fuel (petrol and diesel) price cuts 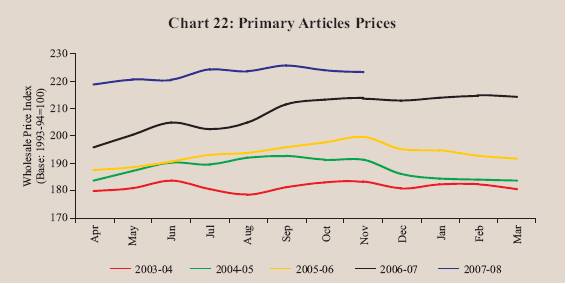
last year and increase in the prices of some petroleum products such as naphtha, furnace oil and aviation turbine fuel. In this context it may be noted that domestic prices of petrol and diesel have remained unchanged since February 2007, when domestic prices were last cut, even as international crude prices (Indian basket) increased by almost 56 per cent from US $ 56.6 a barrel in February 2007 to US $ 88.2 a barrel level by December 2007. Furthermore, domestic prices of kerosene and liquefied petroleum gas (LPG) have also not been raised by the Government since April 2002 and November 2004, respectively, on grounds of societal concerns. Thus, headline inflation has remained suppressed at the current juncture and inflation risks on account of oil prices remain incipient.
Manufactured products inflation, y-o-y, eased to 3.7 per cent on January 5, 2008 from 4.5 per cent at end-September 2007 and 6.1 per cent at end-March 2007; it was 6.3 per cent a year ago. The deceleration in manufactured products inflation, y-o-y, was mainly due to decline in the prices of non-ferrous metals by 9.3 per cent (against an increase of 43.3 per cent a year ago), textiles by 3.5 per cent (2.4 per cent) and sugar by 10.3 per cent (as compared with a decline of 4.0 per cent). Within the manufactured products group, price of edible oils (increase of 8.9 per cent), oil cakes (42.9 per cent), chemicals (5.5 per cent), cement (10.7 per cent), iron and steel (7.6 per cent) and electrical machinery (8.1 per cent) increased, on a year-on-year basis, on January 5, 2008 (see Table 33). These commodities together contributed 57 per cent to the overall WPI inflation on January 5, 2008. While domestic non-ferrous metals prices have declined in line with the international trends, domestic iron 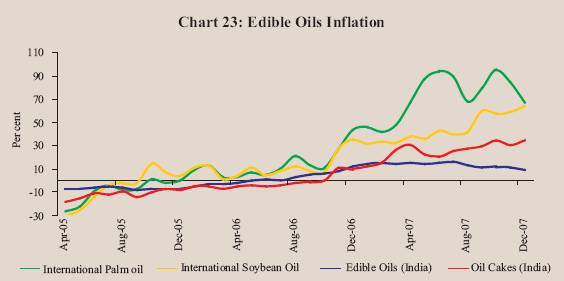
and steel prices have increased even as international steel prices remained flat during the year. Higher prices of cement could be attributed largely to the strong demand from the construction sector and high capacity utilisation rates in the cement industry [94 per cent during 2007-08 (April-December) as compared with 92 per cent a year ago]. The hardening of electrical machinery prices reflected higher input prices as well as investment demand. The firming up of domestic edible oils and oil cakes prices reflected stagnant domestic production, increased demand and rise in international prices (Chart 23). It may be noted that India imported a record 4.7 million tonnes of edible and non-edible oils during the year November 2006-October 2007 according to the Solvent Extractors’ Association of India. Edible oils and oil cakes along with oilseeds accounted for more than one-fourth of headline inflation on January 5, 2008.
Overall, manufactured products were the major driver of annual year-on-year WPI inflation as on January 5, 2008 (with weighted contribution of 54.9 per cent), followed by primary articles (24.5 per cent) and the fuel group (21.2 per cent) (Chart 24).
In order to contain inflationary pressures, the Government initiated a number of fiscal and supply-augmenting measures during 2007-08. On April 3, 2007, the Government decided to exempt import of portland cement from countervailing duty and special additional customs duty; it was earlier exempted from basic customs duty in January 2007. As per the principle of equitable burden sharing among the different stakeholders, the Government, on October 11, 2007, decided to bear the burden to the extent of 42.7 per cent of the under-recoveries in the retail sale of petroleum products by oil marketing companies through issuance of oil bonds. Furthermore, the subsidy schemes 
for kerosene and LPG, which were available through the public distribution system (PDS) till March 2007, were extended till March 2010.
The Government has also taken several measures with the aim of containing food price inflation. The Government reduced customs duty on palm oils by 10 percentage points in April 2007 and by another 5 percentage points in July 2007, and import duty on various edible oils in a range of 5-10 percentage points in July 2007 as well as withdrew the 4 per cent additional countervailing duty on all edible oils. Import of wheat at zero duty, which was available up to end-December 2006, was extended further to end-December 2007. Customs duty on import of pulses was reduced to zero on June 8, 2006 and the period of validity of import of pulses at zero duty, which was initially available up to March 2007, was first extended to August 2007 and further to March 2009. A ban was imposed on export of pulses with effect from June 22, 2006 and the period of validity of prohibition on exports of pulses, which was initially applied up to end-March 2007, was further extended up to end-March 2008. In order to increase the availability of onion, the National Agricultural Cooperative Marketing Federation of India Ltd. (NAFED) increased the minimum export price (MEP) by US $ 100 per tonne for all destinations from August 20, 2007 and by another US $ 50 per tonne with effect from October 2007 for restricting exports and augmenting availability in the domestic market. The minimum support price (MSP) for paddy has been raised by Rs. 65 per quintal (with an additional incentive bonus of Rs. 100) and for wheat by Rs. 250 per quintal for this year. These measures have supplemented the various pre-emptive monetary measures undertaken by the Reserve Bank since mid-2004 and helped in containing inflation and inflationary expectations. Consumer Price Inflation
Inflation based on year-on-year variation in consumer price indices (CPIs) also eased during November/December 2007 (from a year ago) but continued to remain above the WPI inflation, mainly reflecting the impact of food prices and their higher weights in the CPI vis-à-vis WPI (Table 34). The measures of
Table 34: Consumer Price Inflation : Major Groups |
(Year-on-year variation in per cent) |
CPI Measure |
Weight |
March |
March |
March |
March |
March |
June |
Sep. |
Oct. |
Nov. |
Dec. |
|
|
2003 |
2004 |
2005 |
2006 |
2007 |
2007 |
2007 |
2007 |
2007 |
2007 |
1 |
2 |
3 |
4 |
5 |
6 |
7 |
8 |
9 |
10 |
11 |
12 |
CPI-IW (Base: 2001=100)# |
General |
100.0 |
4.1 |
3.5 |
4.2 |
4.9 |
6.7 |
5.7 |
6.4 |
5.5 |
5.5 |
-- |
Food Group |
46.2 |
3.7 |
3.1 |
1.6 |
4.9 |
12.2 |
8.1 |
8.7 |
7.8 |
-- |
-- |
Pan, Supari etc. |
2.3 |
1.9 |
4.2 |
2.1 |
3.1 |
4.4 |
9.6 |
10.3 |
10.3 |
-- |
-- |
Fuel and Light |
6.4 |
6.3 |
6.5 |
4.9 |
-2.9 |
3.2 |
1.6 |
2.3 |
1.5 |
-- |
-- |
Housing |
15.3 |
5.4 |
3.9 |
20.4 |
6.6 |
4.1 |
4.1 |
4.0 |
4.0 |
-- |
-- |
Clothing, Bedding etc. |
6.6 |
1.5 |
2.1 |
2.3 |
3.0 |
3.7 |
4.4 |
5.3 |
4.4 |
-- |
-- |
Miscellaneous |
23.3 |
5.3 |
3.2 |
3.9 |
4.6 |
3.3 |
4.0 |
4.0 |
4.8 |
-- |
-- |
CPI-UNME (Base: 1984-85=100) |
General |
100.0 |
3.8 |
3.4 |
4.0 |
5.0 |
7.6 |
6.1 |
5.7 |
5.5 |
5.1 |
5.1 |
Food Group |
47.1 |
2.6 |
3.0 |
2.2 |
5.3 |
10.9 |
7.7 |
7.7 |
6.8 |
5.9 |
6.2 |
Fuel and Light |
5.5 |
3.1 |
3.2 |
9.6 |
1.9 |
6.4 |
7.2 |
7.0 |
6.6 |
6.2 |
5.4 |
Housing |
16.4 |
6.3 |
5.2 |
7.5 |
5.5 |
5.6 |
5.6 |
4.9 |
4.7 |
4.7 |
4.7 |
Clothing, Bedding etc. |
7.0 |
2.6 |
2.6 |
2.0 |
2.9 |
3.6 |
4.3 |
4.0 |
3.9 |
4.2 |
4.1 |
Miscellaneous |
24.0 |
6.0 |
2.8 |
4.4 |
5.1 |
4.4 |
3.7 |
3.2 |
3.2 |
3.4 |
3.8 |
CPI-AL (Base: 1986-87=100) |
General |
100.0 |
4.9 |
2.5 |
2.4 |
5.3 |
9.5 |
7.8 |
7.9 |
7.0 |
6.2 |
5.9 |
Food Group |
69.2 |
6.0 |
1.6 |
2.2 |
5.5 |
11.8 |
8.8 |
8.8 |
7.8 |
6.4 |
6.2 |
Pan, Supari etc. |
3.8 |
3.5 |
4.7 |
-1.3 |
6.6 |
5.7 |
9.1 |
11.1 |
10.8 |
11.0 |
11.3 |
Fuel and Light |
8.4 |
4.8 |
3.0 |
3.0 |
4.3 |
6.9 |
7.4 |
7.2 |
6.9 |
6.6 |
6.3 |
Clothing, Bedding etc. |
7.0 |
3.0 |
4.1 |
2.5 |
2.2 |
3.5 |
2.7 |
1.9 |
1.6 |
1.3 |
1.3 |
Miscellaneous |
11.7 |
3.1 |
2.7 |
5.5 |
5.5 |
6.8 |
6.7 |
5.5 |
5.5 |
5.2 |
5.2 |
CPI-RL (Base: 1986-87=100) |
General |
100.0 |
4.8 |
2.5 |
2.4 |
5.3 |
9.2 |
7.5 |
7.6 |
6.7 |
5.9 |
5.6 |
Food Group |
66.8 |
5.6 |
1.9 |
1.9 |
5.8 |
11.5 |
8.5 |
8.8 |
7.6 |
6.2 |
6.2 |
Pan, Supari etc. |
3.7 |
3.5 |
4.7 |
-1.0 |
6.3 |
5.7 |
9.3 |
11.6 |
11.0 |
11.1 |
11.5 |
Fuel and Light |
7.9 |
4.8 |
3.0 |
2.9 |
4.0 |
6.9 |
7.4 |
7.2 |
6.9 |
6.9 |
6.3 |
Clothing, Bedding etc. |
9.8 |
3.3 |
3.4 |
2.8 |
2.7 |
3.1 |
2.6 |
2.1 |
2.1 |
2.3 |
2.6 |
Miscellaneous |
11.9 |
3.1 |
3.0 |
5.5 |
5.2 |
6.3 |
6.2 |
5.3 |
5.3 |
5.2 |
5.0 |
Memo: |
WPI Inflation (End of period) |
|
6.5 |
4.6 |
5.1 |
4.1 |
5.9 |
4.4 |
3.4 |
3.1 |
3.0 |
3.5 |
GDP Deflator based Inflation* |
|
3.9 |
3.7 |
4.2 |
4.4 |
5.3 |
5.2 |
4.2 |
|
|
-- |
# : Data prior to January 2006 are based on the old series (Base: 1982=100)
* : Data for March pertain to full year.
IW : Industrial Workers.
UNME : Urban Non-Manual Employees.
AL : Agricultural Labourers.
RL : Rural Labourers. |

consumer price inflation were placed in the range of 5.1-5.9 per cent during November/December 2007 as compared with 5.7-7.9 per cent in September 2007 (and 6.7-9.5 per cent in March 2007). Disaggregated data show that food group inflation in various CPI measures (except for industrial workers) eased to 6.2 per cent during December 2007 from 7.7-8.8 per cent in September 2007; it was in the range of 10.9-12.2 per cent in March 2007.
Asset Prices
Domestic equity prices recorded further gains during the third quarter of 2007-08, amidst intermittent corrections (see Chapter V). This reflected a number of factors such as strong domestic growth, healthy corporate performance, liquidity support from both FIIs and domestic mutual funds. Bullion prices also firmed up during the third quarter in line with international trends (Chart 25). Domestic gold prices have increased by about 10 per cent since September 2007 to an average of around Rs. 10,298 per 10 grams in December 2007 (these were Rs. 9,369 per 10 grams in March 2007) in line with movement in international prices, which increased by almost 13 per cent over the same period. International gold prices touched a high of US $ 840 per ounce on November 9, 2007, reflecting weakening of US dollar, hardening of oil prices and uncertainties surrounding the global financial markets. International gold prices rose further to a peak of US $ 893 per ounce on January 16, 2008. |


