The Central Statistical Organisation (CSO) has released the 'Quick Estimates of National Income, Consumption Expenditure, Saving and Capital Formation, 2006-07' on January 31, 2008. These estimates provide the data on various macro-economic aggregates for the years 1999-2000 to 2006-07. Subsequently, the CSO has also released the 'Revised Estimates of National Income, 2007-08' on May 31, 2008 providing the estimate of the rate of growth of Gross Domestic Product for the year 2007-08. This article reviews the trends in various macro-economic aggregates as given in the Quick and Revised Estimates.
1. Gross Domestic Product
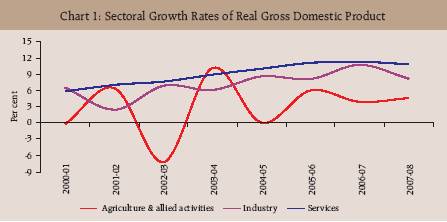
As per the Quick Estimates of National Income 2006-07, the real Gross Domestic Product (GDP) at factor cost, registered a growth of 9.6 per cent in 2006-07 as compared with 9.4 per cent in 2005-06. Subsequently, for the year 2007-08, the Revised Estimates placed the growth of real GDP at 9.0 per cent (Table 1, Chart 1), revising upward the Advance Estimates of 8.7 per cent, released in February 2008.
1.1 Sectoral Growth and Composition of Real Gross Domestic Product
Some moderation was witnessed in the real GDP growth rate for the year 2007-08 vis-à-vis 2006-07. This can be explained by the fact that notwithstanding improved growth performance in sectors, like 'agriculture and allied activities' , 'electricity, gas and water supply', 'trade, hotels, transport and communication', and 'community, social and personal services', all other sectors witnessed moderated growth performance in the year 2007-08 as compared with 2006-07 (Table 1).
At the sectoral level, 'agriculture and allied activities' registered a growth rate of 4.5 per cent in 2007-08 as compared with 3.8 per cent in 2006-07.
The growth rate of GDP originating from industry is estimated at 8.1 per cent in 2007-08 lower than that of 10.6 per cent in 2006-07 reflecting deceleration in the growth of its two sub-sectors viz., 'manufacturing' (8.8 per cent in 2007-08 from 12.0 per cent in 2006-07) and 'mining and quarrying' (4.7 per cent in 2007-08 from 5.7 per cent in 2006-07) while 'electricity, gas and water supply' has witnessed some rise in the growth rate (6.3 per cent in 2007-08 from 6.0 per cent in 2006-07). The services sector is estimated to register a growth of 10.7 per cent in 2007-08 as compared with 11.2 per cent in 2006-07. This is due to the fact that the 'construction' sub-sector has recorded a deceleration in its growth to 9.8 per cent in 2007-08 from 12.0 per cent in 2006-07, notwithstanding the higher growth of sub-sectors, viz., 'trade, hotels, transport, storage and communication' to 12.0 per cent in 2007-08 from 11.8 per cent in 2006-07 and 'community, social and personal services' to 7.3 per cent in 2007-08 from 6.9 per cent in 2006-07 (Table 1 and Statement 1).
As per the Revised Estimates, the share of 'agriculture and allied activities'
Table 1: Sectoral Growth Rates of Gross Domestic Product at factor cost
|
(At 1999-00 Prices) ( Per cent) |
Sector |
2000-01 |
2001-02 |
2002-03 |
2003-04 |
2004-05 |
2005-06@ |
2006-07* |
2007-08# |
1 |
2 |
3 |
4 |
5 |
6 |
7 |
8 |
9 |
I |
Agriculture, forestry & fishing |
-0.2 |
6.3 |
-7.2 |
10.0 |
0.0 |
5.9 |
3.8 |
4.5 |
II |
Industry |
6.4 |
2.4 |
6.8 |
6.0 |
8.5 |
8.0 |
10.6 |
8.1 |
|
(i) |
Mining & quarrying |
2.4 |
1.8 |
8.8 |
3.1 |
8.2 |
4.9 |
5.7 |
4.7 |
|
(ii) |
Manufacturing |
7.7 |
2.5 |
6.8 |
6.6 |
8.7 |
9.0 |
12.0 |
8.8 |
|
(iii) |
Electricity. gas & water supply |
2.1 |
1.7 |
4.7 |
4.8 |
7.9 |
4.7 |
6.0 |
6.3 |
III |
Services |
5.7 |
6.9 |
7.5 |
8.8 |
9.9 |
11.0 |
11.2 |
10.7 |
|
(i) |
Construction |
6.2 |
4.0 |
7.9 |
12.0 |
16.1 |
16.5 |
12.0 |
9.8 |
|
(ii) |
Trade, hotels & restaurant |
5.2 |
9.6 |
6.9 |
10.1 |
7.7 |
9.4 |
8.5(11.8)^ |
12.0^ |
|
(iii) |
Transport, storage & |
|
|
|
|
|
|
|
|
|
|
communication |
11.2 |
8.4 |
14.1 |
15.3 |
15.6 |
14.6 |
16.6 |
.. |
|
(iv) |
Financing, insurance, real estate |
|
|
|
|
|
|
|
|
|
|
& business services |
4.1 |
7.3 |
8.0 |
5.6 |
8.7 |
11.4 |
13.9 |
11.8 |
|
(v) |
Community, social & |
|
|
|
|
|
|
|
|
|
|
personal services |
4.7 |
4.1 |
3.9 |
5.4 |
6.9 |
7.2 |
6.9 |
7.3 |
IV |
Gross domestic product at |
4.4 |
5.8 |
3.8 |
8.5 |
7.5 |
9.4 |
9.6 |
9.0 |
|
factor cost |
|
|
|
|
|
|
|
|
@ : Provisional * : Quick estimates # : Revised estimates ^ : Includes Transport, storage and communication
.:Not available
Source :Central Statistical Organisation. |
is estimated to decline to 17.8 per cent in 2007-08 from 18.5 per cent in 2006-07. The share of industry declined fractionally to 19.4 per cent in the year 2007-08 from 19.5 per cent in 2006-07. The share of services in real GDP is, however, estimated to rise at 62.9 per cent from 61.9 per cent during the same period. This rise in the share of services is mainly reflective of increase in the share of 'financing, insurance, real estate & business services' to 14.7 per cent in 2007-08 from 14.3 per cent in 2006-07 (Table 2).
Table 2: Sectoral Composition of Gross Domestic Product at factor cost
(At 1999-00 Prices)
|
( Per cent) |
Sector |
2000-01 |
2001-02 |
2002-03 |
2003-04 |
2004-05 |
2005-06@ |
2006-07* |
2007-08# |
1 |
2 |
3 |
4 |
5 |
6 |
7 |
8 |
9 |
I |
Agriculture and allied activities |
23.9 |
24.0 |
21.4 |
21.7 |
20.2 |
19.6 |
18.5 |
17.8 |
II |
Industry |
20.0 |
19.3 |
19.9 |
19.4 |
19.6 |
19.4 |
19.5 |
19.4 |
|
(i) |
Mining & quarrying |
2.3 |
2.2 |
2.3 |
2.2 |
2.2 |
2.1 |
2.0 |
2.0 |
|
(ii) |
Manufacturing |
15.3 |
14.8 |
15.2 |
15.0 |
15.1 |
15.1 |
15.4 |
15.4 |
|
(iii) |
Electricity, gas & water supply |
2.4 |
2.3 |
2.4 |
2.3 |
2.3 |
2.2 |
2.1 |
2.1 |
|
|
|
|
|
|
|
|
|
|
|
III |
Services |
56.1 |
56.7 |
58.7 |
58.9 |
60.2 |
61.1 |
61.9 |
62.9 |
|
(i) |
Construction |
5.8 |
5.7 |
5.9 |
6.1 |
6.6 |
7.1 |
7.2 |
7.3 |
|
(ii) |
Trade, hotels & restaurant |
14.3 |
14.9 |
15.3 |
15.5 |
15.5 |
15.5 |
15.4 |
25.1^ |
|
(iii) |
Transport, storage & |
|
|
|
|
|
|
|
|
|
|
communication |
8.0 |
8.2 |
9.0 |
9.5 |
10.2 |
10.7 |
11.4 |
.. |
|
(iv) |
Financing, insurance, real |
|
|
|
|
|
|
|
|
|
|
estate & business services |
13.0 |
13.2 |
13.7 |
13.4 |
13.5 |
13.8 |
14.3 |
14.7 |
|
(v) |
Community, social & |
|
|
|
|
|
|
|
|
|
|
personal services |
15.0 |
14.7 |
14.8 |
14.3 |
14.2 |
14.0 |
13.6 |
13.4 |
IV |
Gross domestic product at |
|
|
|
|
|
|
|
|
|
factor cost |
100.0 |
100.0 |
100.0 |
100.0 |
100.0 |
100.0 |
100.0 |
100.0 |
Note : @ Provisional ^ : Includes Transport, storage and communication |
* : Quick estimates.# : Revised Estimates... : Not Available
Sectoral rates may not add up to GDP share due to rounding off.
Source: Central Statistical Organisation |
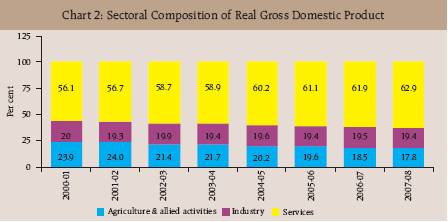
The share of 'agriculture and allied activities' has been showing continuous decline while services sector is witnessing a continuous rise during the period 2000-01 to 2007-08. While the share of 'industry' in GDP decreased to 19.4 per cent in 2007-08 from 20.0 per cent in 2000-01, the share of 'services' in GDP increased to 62.9 per cent in 2007-08 from 56.1 per cent in 2000-01 and the share of 'agriculture' decreased to 17.8 per cent from 23.9 per cent during the same period (Table 2 and Chart 2). 1.2 Sectoral Contribution to the Growth of Real Gross Domestic Product
In 2007-08, the sectoral contributions to growth worked out to 9.3 per cent for 'agriculture and allied activities', 17.5 per cent for industry and 73.2 per cent for the services sector in 2007-08 as against the contributions of 7.6 per cent, 21.4 per cent and 71.0 per cent, respectively in 2006-07 (Chart 3 and Table 3). 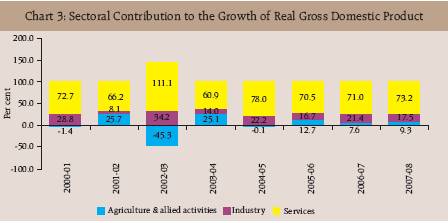
Table 3: Sectoral Contribution to the Growth of Real Gross Domestic Product at factor cost |
(Per cent) |
Sector |
2000-01 |
2001-02 2002-03 |
2003-04 |
2004-05 |
2005-06@ |
2006-07* |
2007-08# |
|
1 |
|
2 |
3 |
4 |
5 |
6 |
7 |
8 |
9 |
I. |
Agriculture & allied activities |
-0.1 |
1.5 |
-1.7 |
2.1 |
0.0 |
1.2 |
0.7 |
0.8 |
|
|
|
|
|
|
|
|
|
|
|
II. |
Industry |
1.3 |
0.5 |
1.3 |
1.2 |
1.7 |
1.6 |
2.1 |
1.6 |
|
(i) |
Mining & quarrying |
0.1 |
0.0 |
0.2 |
0.1 |
0.2 |
0.1 |
0.1 |
0.1 |
|
(ii) |
Manufacturing |
1.1 |
0.4 |
1.0 |
1.0 |
1.3 |
1.4 |
1.8 |
1.4 |
|
(iii) |
Electrical, gas & water supply |
0.1 |
0.0 |
0.1 |
0.1 |
0.2 |
0.1 |
0.1 |
0.1 |
|
|
|
|
|
|
|
|
|
|
|
III. |
Services |
3.2 |
3.8 |
4.3 |
5.2 |
5.8 |
6.6 |
6.8 |
6.6 |
|
(i) |
Construction |
0.4 |
0.2 |
0.5 |
0.7 |
1.0 |
1.1 |
0.8 |
0.7 |
|
(ii) |
Trade, hotels & restaurant |
0.7 |
1.4 |
1.0 |
1.5 |
1.2 |
1.5 |
1.3 |
3.2^ |
|
(iii) |
Transport, storage & |
|
|
|
|
|
|
|
|
|
|
communication |
0.8 |
0.7 |
1.2 |
1.4 |
1.5 |
1.5 |
1.8 |
.. |
|
(iv) |
Financing, insurance, real |
|
|
|
|
|
|
|
|
|
|
estate & business services |
0.5 |
0.9 |
1.1 |
0.8 |
1.2 |
1.5 |
1.9 |
1.7 |
|
(v) |
Community, social & |
|
|
|
|
|
|
|
|
|
|
personal services |
0.7 |
0.6 |
0.6 |
0.8 |
1.0 |
1.0 |
1.0 |
1.0 |
IV. |
Gross domestic product |
4.4 |
5.8 |
3.8 |
8.5 |
7.5 |
9.4 |
9.6 |
9.0 |
Note :@ : Provisional ^ : Includes Transport, storage and communication.
* : Quick Estimates.# : Revised estimates.
..: Not Available.
Sectoral rates may not add up to GDP growth due to rounding off.
Source:Central Statistical Organisation. |
2. Trends in Domestic Saving As per the Quick Estimates, the Gross Domestic Savings (GDS) in India at current market prices has increased to 34.8 per cent in 2006-07 from 34.3 per cent in 2005-06 mainly due to improvement in saving performance by the private corporate and public sectors. The public sector saving increased to 3.2 per cent in 2006-07 from 2.6 per cent in 2005-06 and private corporate savings increased to 7.8 per cent from 7.5 per cent, while there was a modest decline in household sectors saving to 23.8 per cent from 24.2 per cent during the same period (Table 4). It is significant to note that the Indian economy has witnessed a continuous increase in the rate of GDS, particularly from 2001-02 onwards. During this period, the public sector saving has witnessed a turn-around since 2003-04, with its rate of saving increasing to 3.2 per cent in 2006-07 from (-) 2.0 per cent in 2001-2002. It is important to note that the household sector has been the largest contributor to the GDS. An analysis of the composition of GDS shows that the share of household sector has decreased to 68.4 per cent in 2006-07 from 91.1 per cent from 2000-01. The private corporate sector, on the other hand, which occupied the second largest share in the GDS, increased its share to 22.4 per cent in 2006-07 from 16.2 per cent in 2000-01 on account of rise in its profitability. As mentioned earlier, the public sector savings turned from dis-savings to a savings generating sector constituting 9.3 per cent of GDS in 2006-07 from (-) 7.4 per cent in 2000-01 (Chart 4).
Table 4: Saving and Capital Formation by Institutions |
(Per cent of GDP at current market prices) |
Item |
2001-02 |
2002-03 |
2003-04 |
2004-05 |
2005-06 * |
2006-07 # |
1 |
2 |
3 |
4 |
5 |
6 |
7 |
1 |
Gross Domestic Saving |
23.5 |
26.4 |
29.8 |
31.8 |
34.3 |
34.8 |
|
(i) |
Household Sector |
22.1 |
23.2 |
24.4 |
23.0 |
24.2 |
23.8 |
|
|
(a) Financial Assets |
10.9 |
10.3 |
11.4 |
10.1 |
11.8 |
11.3 |
|
|
(b) Physical Assets |
11.3 |
12.9 |
13.0 |
12.9 |
12.5 |
12.5 |
|
(ii) |
Private Corporate Sector |
3.4 |
3.9 |
4.4 |
6.6 |
7.5 |
7.8 |
|
|
of which: Joint Stock Companies |
3.1 |
3.5 |
4.1 |
6.2 |
7.2 |
7.5 |
|
(iii) |
Public Sector |
-2.0 |
-0.6 |
1.1 |
2.2 |
2.6 |
3.2 |
|
|
of which : Non-department |
|
|
|
|
|
|
|
|
commercial Enterprises |
3.5 |
4.0 |
4.2 |
4.2 |
4.0 |
4.0 |
2 |
Gross Capital Formation |
24.2 |
25.2 |
26.8 |
31.6 |
34.5 |
36.0 |
|
(i) |
Household Sector |
11.3 |
12.9 |
13.0 |
12.9 |
12.5 |
12.5 |
|
(ii) |
Private Corporate Sector |
5.4 |
5.7 |
6.6 |
10.5 |
13.3 |
14.5 |
|
(iii) |
Public Sector |
6.9 |
6.1 |
6.3 |
6.9 |
7.6 |
7.8 |
|
(iv) |
Valuables |
0.6 |
0.6 |
0.9 |
1.3 |
1.2 |
1.2 |
3 |
Gross Domestic Capital Formation (GDCF)## |
22.8 |
25.2 |
28.2 |
32.2 |
35.5 |
35.9 |
4 |
Saving -Investment Balance |
0.7 |
1.2 |
1.6 |
-0.4 |
-1.2 |
-1.1 |
|
(i) |
Household Sector |
10.9 |
10.3 |
11.4 |
10.1 |
11.8 |
11.3 |
|
(ii) |
Private Corporate Sector |
-2.1 |
-1.9 |
-2.2 |
-4.0 |
-5.8 |
-6.8 |
|
(iii) |
Public Sector |
-8.9 |
-6.7 |
-5.3 |
-4.7 |
-5.0 |
-4.5 |
## : Adjusted for errors and omissions. * : Provisional.
# : Quick estimates.
Note: Sectoral share may not add up to total due to rounding off.
Source:Central Statistical Organisation. |
3. Trends in Domestic Capital Formation
The rate of Gross Domestic Capital Formation (GDCF) continued its rising trend and rose to 35.9 per cent in 2006-07 from 35.5 per cent in 2005-06. The saving-investment gap (i.e. rate of GDS less rate of GDCF) decreased to (-) 1.1 per cent in 2006-07 from (-) 1.2 per cent in 2005-06. Of the three contributing sectors, the rate of capital formation in the household sector, a corollary of 
household sector saving in physical assets, remained constant at 12.5 per cent in 2005-06 and 2006-07. The rate of capital formation in private corporate sector increased to 14.5 per cent in 2006-07 from 13.3 per cent in 2005-06, while that in public sector increased to 7.8 per cent from 7.6 per cent during the same period (Table 4 and Statement 3). The saving-investment gaps at the sectoral level are indicated in Table 4.
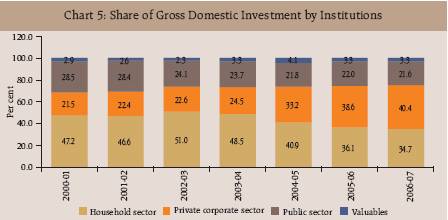
The composition of Gross Capital Formation (GCF) by type of institution reveals that the share of public sector in gross capital formation marginally decreased to 21.6 per cent in 2006-07 from 22.0 per cent in 2005-06 and for the household sector it decreased to 34.7 per cent from 36.1 per cent during the same period. The share of private corporate sector in gross capital formation rose to 40.4 per cent in 2006-07 from 38.6 per cent in 2005-06 (Chart 5). The breakup of GCF by industry indicates that the compositional share of capital formation was the highest in industrial sector. It increased to 51.9 per cent in 2006-07 from 37.0 per cent in 2000-01. The share of capital formation in the services sector decreased to 41.1 per cent in 2006-07 from 53.3 per cent in 2000-01. The share of capital formation in 'agriculture and allied activities', which was the lowest among all three sectors, decreased to 7.0 per cent in 2006-07 from 9.7 per cent in 2000-01 (Chart 6, Statement 4). 4. Other Macro-economic Aggregates
As a share of GDP at current market prices, total final consumption expenditure has declined to 65.5 per cent in 2007-08 from 66.1 per cent in 2006-07 reflecting mainly a decline in the share of private final consumption expenditure (PFCE) to 55.3 per cent in 2006-07 from 55.8 per cent in 2006-07. Gross fixed capital formation as a proportion of GDP increased to 33.9 per cent in 2007-08 from 32.5 per cent in 2006-07, while 'change in 
stock' remained at 2.3 per cent for both the years and that of 'valuables' increased to 1.3 per cent in 2007-08 from 1.2 per cent in 2006-07. The shares of both exports and imports in GDP have decreased to 21.3 per cent and 24.4 per cent in 2007-08 from 22.1 per cent and 25.1 per cent, respectively in 2006-07. As a result, net exports as a proportion of GDP at current market prices increased to (-) 3.1 per cent in 2007-08 from (-) 3.0 per cent in 2006-07(Statement 5a).
The other macro-economic aggregates, such as Net Domestic Product (NDP), Net National Product (NNP), Gross National Product (GNP), etc. are basically variants of Gross Domestic Product at factor cost. The real Net National Product at factor cost, which is defined as National Income, is estimated to grow at 9.4 per cent in 2007-08 more than double of 3.7 per cent in 2000-01. Accordingly, the per capita income (i.e. per capita Net National Product at factor cost) is estimated to show a growth of 7.8 per cent in 2007-08 from 1.8 per cent in 2000-01 (Statement 5b). It may be mentioned that some 'Discrepancies' arise due to the difference between the GDP estimated by economic activity marked up by net indirect taxes (indirect taxes less subsidies) to arrive at GDP at market prices and the GDP estimated from the expenditure side. Discrepancies during 2007-08 are estimated at 0.2 per cent of GDP at current market prices as against the corresponding rate of 1.0 per cent in 2006-07.
To sum up, with the latest estimates released by CSO for the years 2007-08 (RE) and 2006-07(QE), the Indian economy continued to be on the high growth trajectory with an average growth rate of 8.8 per cent during the last five years (2003-04 to 2007-08) aided by investment, financed predominantly by domestic savings.
Statement 1: Trends in Sectoral Growth and Share of Gross Domestic Product at Factor cost(Contd.) |
(Amount in Rs. crore and growth rate in per cent) |
(1999-2000 Prices) |
|
2000-01 |
2001-02 |
2002-03 |
2003-04 |
Item |
Amount |
Growthrate |
Amount |
Growthrate |
Amount |
Growthrate |
Amount |
Growthrate |
1 |
2 |
3 |
4 |
5 |
6 |
7 |
8 |
9 |
|
|
|
|
|
|
|
|
|
|
I |
Agriculture & allied |
|
|
|
|
|
|
|
|
|
activities |
445403 |
-0.2 |
473249 |
6.3 |
438966 |
-7.2 |
482676 |
10.0 |
|
|
(23.9) |
|
(24.0) |
|
(21.4) |
|
(21.7) |
|
|
|
|
|
|
|
|
|
|
|
II |
Industry |
372599 |
6.4 |
381366 |
2.4 |
407276 |
6.8 |
431724 |
6.0 |
|
|
(20.0) |
|
(19.3) |
|
(19.9) |
|
(19.4) |
|
|
|
|
|
|
|
|
|
|
|
i) |
Mining & quarrying |
42589 |
2.4 |
43335 |
1.8 |
47168 |
8.8 |
48626 |
3.1 |
|
|
(2.3) |
|
(2.2) |
|
(2.3) |
|
(2.2) |
|
|
|
|
|
|
|
|
|
|
|
ii) |
Manufacturing |
284571 |
7.7 |
291803 |
2.5 |
311685 |
6.8 |
332363 |
6.6 |
|
|
(15.3) |
|
(14.8) |
|
(15.2) |
|
(15.0) |
|
|
|
|
|
|
|
|
|
|
|
iii) |
Electricity , gas & |
|
|
|
|
|
|
|
|
|
water supply |
45439 |
2.1 |
46228 |
1.7 |
48423 |
4.7 |
50735 |
4.8 |
|
|
(2.4) |
|
(2.3) |
|
(2.4) |
|
(2.3) |
|
|
|
|
|
|
|
|
|
|
|
III |
Services |
1046299 |
5.7 |
1117991 |
6.9 |
1202045 |
7.5 |
1308358 |
8.8 |
|
|
(56.1) |
|
(56.7) |
|
(58.7) |
|
(58.9) |
|
|
|
|
|
|
|
|
|
|
|
i) |
Construction |
108362 |
6.2 |
112692 |
4.0 |
121650 |
7.9 |
136224 |
12.0 |
|
|
(5.8) |
|
(5.7) |
|
(5.9) |
|
(6.1) |
|
|
|
|
|
|
|
|
|
|
|
ii) |
Trade, hotels & |
|
|
|
|
|
|
|
|
|
restaurant |
267326 |
5.2 |
293075 |
9.6 |
313221 |
6.9 |
344743 |
10.1 |
|
|
(14.3) |
|
(14.9) |
|
(15.3) |
|
(15.5) |
|
|
|
|
|
|
|
|
|
|
|
iii) |
Transport, storage & |
|
|
|
|
|
|
|
|
|
communication |
148324 |
11.2 |
160772 |
8.4 |
183471 |
14.1 |
211627 |
15.3 |
|
|
(8.0) |
|
(8.2) |
|
(9.0) |
|
(9.5) |
|
|
|
|
|
|
|
|
|
|
|
iv) |
Financing, insurance, |
|
|
|
|
|
|
|
|
|
real estate & business |
|
|
|
|
|
|
|
|
|
services |
243048 |
4.1 |
260737 |
7.3 |
281550 |
8.0 |
297250 |
5.6 |
|
|
(13.0) |
|
(13.2) |
|
(13.7) |
|
(13.4) |
|
|
|
|
|
|
|
|
|
|
|
v) |
Community, social |
|
|
|
|
|
|
|
|
|
& personal , services |
279239 |
4.7 |
290715 |
4.1 |
302153 |
3.9 |
318514 |
5.4 |
|
|
(15.0) |
|
(14.7) |
|
(14.8) |
|
(14.3) |
|
|
|
|
|
|
|
|
|
|
|
iv) |
GDP at factor cost |
1864300 |
4.4 |
1972606 |
5.8 |
2048287 |
3.8 |
2222758 |
8.5 |
|
|
(100.0) |
|
(100.0) |
|
(100.0) |
|
(100.0) |
|
Statement 1: Trends in Sectoral Growth and Share of Gross Domestic Product at Factor cost (Concld.)
|
|
(Amount in Rs. crore and growth rate in per cent)
|
|
(1999-2000 Prices)
|
|
2004-05 |
2005-06@ |
2006-07* |
2007-08# |
Item |
Amount |
Growthrate |
Amount |
Growthrate |
Amount |
Growthrate |
Amount |
Growthrate |
1 |
10 |
11 |
12 |
13 |
14 |
15 |
16 |
17 |
I |
Agriculture & allied |
|
|
|
|
|
|
|
|
|
activities |
482446 |
0.0 |
511013 |
5.9 |
530236 |
3.8 |
554336 |
4.5 |
|
|
(20.2) |
|
(19.6) |
|
(18.5) |
|
(17.8) |
|
II |
Industry |
468451 |
8.5 |
506016 |
8.0 |
559801 |
10.6 |
605061 |
8.1 |
|
|
(19.6) |
|
(19.4) |
|
(19.5) |
|
(19.4) |
|
i) |
Mining & quarrying |
52591 |
8.2 |
55150 |
4.9 |
58294 |
5.7 |
61061 |
4.7 |
|
|
(2.2) |
|
(2.1) |
|
(2.0) |
|
(2.0) |
|
ii) |
Manufacturing |
361115 |
8.7 |
393557 |
9.0 |
440770 |
12.0 |
479456 |
8.8 |
|
|
(15.1) |
|
(15.1) |
|
(15.4) |
|
(15.4) |
|
iii) |
Electricity , gas & |
|
|
|
|
|
|
|
|
|
water supply |
54745 |
7.9 |
57309 |
4.7 |
60737 |
6.0 |
64544 |
6.3 |
|
|
(2.3) |
|
(2.2) |
|
(2.1) |
|
(2.1) |
|
III |
Services |
1437487 |
9.9 |
1595818 |
11.0 |
1774272 |
11.2 |
1963462 |
10.7 |
|
|
(60.2) |
|
(61.1) |
|
(61.9) |
|
(62.9) |
|
i) |
Construction |
158217 |
16.1 |
184255 |
16.5 |
206338 |
12.0 |
226579 |
9.8 |
|
|
(6.6) |
|
(7.1) |
|
(7.2) |
|
(7.3) |
|
ii) |
Trade, hotels & |
|
|
|
|
|
|
|
|
|
restaurant |
371155 |
7.7 |
406203 |
9.4 |
440677 |
8.5 |
860212^ |
12.0^ |
|
|
(15.5) |
|
(15.5) |
|
(15.4) |
|
25.1^ |
|
iii) |
Transport,storage & |
|
|
|
|
|
|
|
|
|
communication |
244693 |
15.6 |
280535 |
14.6 |
327207 |
16.6 |
.. |
.. |
|
|
(10.2) |
|
(10.7) |
|
(11.4) |
|
|
|
iv) |
Financing, insurance, |
|
|
|
|
|
|
|
|
|
real estate & business |
|
|
|
|
|
|
|
|
|
services |
323080 |
8.7 |
359942 |
11.4 |
410030 |
13.9 |
458364 |
11.8 |
|
|
(13.5) |
|
(13.8) |
|
(14.3) |
|
(14.7) |
|
v) |
Community, social & |
|
|
|
|
|
|
|
|
|
personal , services |
340342 |
6.9 |
364883 |
7.2 |
390020 |
6.9 |
418307 |
7.3 |
|
|
(14.2) |
|
(14.0) |
|
(13.6) |
|
(13.4) |
|
iv) |
GDP at factor cost |
2388384 |
7.5 |
2612847 |
9.4 |
2864310 |
9.6 |
3122862 |
9.0 |
|
|
(100.0) |
|
(100.0) |
|
(100.0) |
|
(100.0) |
|
Note:Figures in the parentheses are share as per cent of GDP.
* :Quick Estimates
^ :Includes 'Transport storage and communication'
# :Revised Estimates
.. :Not Available
@ : Provisional
Source:Central Statistical Organisation |
Statement 2 : Domestic Saving by Type of Institutions (at current prices) |
(Amount in Rs. crore) |
Item |
2000-01 |
2001-02 |
2002-03 |
2003-04 |
2004-05 |
2005-06@ |
2006-07* |
1 |
|
2 |
3 |
4 |
5 |
6 |
7 |
8 |
|
|
|
|
|
|
|
|
|
I |
Household sector |
|
454853 |
504165 |
569134 |
670776 |
725110 |
866756 |
985822 |
|
|
|
|
(21.6) |
(22.1) |
(23.2) |
(24.4) |
(23.0) |
(24.2) |
(23.8) |
|
|
|
|
|
|
|
|
|
|
|
|
(i) Financial saving |
|
215219 |
247476 |
253255 |
313260 |
318264 |
420841 |
467985 |
|
|
|
|
(10.2) |
(10.9) |
(10.3) |
(11.4) |
(10.1) |
(11.8) |
(11.3) |
|
|
|
|
|
|
|
|
|
|
|
|
(ii) Physical Saving |
|
239634 |
256689 |
315879 |
357516 |
406846 |
445915 |
517837 |
|
|
|
|
(11.4) |
(11.3) |
(12.9) |
(13.0) |
(12.9) |
(12.5) |
(12.5) |
|
|
|
|
|
|
|
|
|
|
|
II |
Private corporate sector |
|
81062 |
76906 |
94772 |
120730 |
206363 |
268329 |
322242 |
|
|
|
|
(3.9) |
(3.4) |
(3.9) |
(4.4) |
(6.6) |
(7.5) |
(7.8) |
|
|
|
|
|
|
|
|
|
|
|
III |
Public sector |
|
|
-36882 |
-46186 |
-15936 |
29521 |
68951 |
92263 |
133359 |
|
|
|
|
-(1.8) |
-(2.0) |
-(0.6) |
(1.1) |
(2.2) |
(2.6) |
(3.2) |
|
|
|
|
|
|
|
|
|
|
|
IV |
Gross Domestic Saving |
|
499033 |
534885 |
647970 |
821026 |
1000424 |
1227348 |
1441423 |
|
(I+II+III) |
|
|
(23.7) |
(23.5) |
(26.4) |
(29.8) |
(31.8) |
(34.3) |
(34.8) |
|
|
|
|
|
|
|
|
|
|
|
Note : Figures in the parentheses are share as per cent of GDP.
* : Quick Estimates @: Provisional
Source : Central Statistical Organisation. |
Statement 3 : Capital Formation by Type of Institutions
|
(Amount in Rs. crore) |
Item |
2000-01 |
2001-02 |
2002-03 |
2003-04 |
2004-05 |
2005-06 @ |
2006-07* |
1 |
2 |
3 |
4 |
5 |
6 |
7 |
8 |
(At Current Prices) |
I |
Gross capital formation (GCF) |
508009 |
551041 |
619490 |
737472 |
995943 |
1236800 |
1492313 |
|
|
(24.2) |
(24.2) |
(25.2) |
(26.8) |
(31.6) |
(34.5) |
(36.0) |
|
(i) Public sector |
144638 |
156537 |
149399 |
174579 |
216962 |
272002 |
321753 |
|
|
(6.9) |
(6.9) |
(6.1) |
(6.3) |
(6.9) |
(7.6) |
(7.8) |
|
(ii) Private corporate sector |
109013 |
123628 |
140255 |
180804 |
331081 |
477490 |
603014 |
|
|
(5.2) |
(5.4) |
(5.7) |
(6.6) |
(10.5) |
(13.3) |
(14.5) |
|
(iii) Household sector |
239634 |
256689 |
315879 |
357517 |
406846 |
445916 |
517837 |
|
|
(11.4) |
(11.3) |
(12.9) |
(13.0) |
(12.9) |
(12.5) |
(12.5) |
|
(iv) Valuables |
14724 |
14187 |
13957 |
24572 |
41054 |
41392 |
49709 |
|
|
(0.7) |
(0.6) |
(0.6) |
(0.9) |
(1.3) |
(1.2) |
(1.2) |
II |
Gross fixed capital formation |
477818 |
538179 |
584242 |
687016 |
894674 |
1109160 |
1346501 |
|
|
(22.7) |
(23.6) |
(23.8) |
(24.9) |
(28.4) |
(31.0) |
(32.5) |
III |
Change in stock |
15467 |
-1325 |
21291 |
25884 |
60215 |
86248 |
96103 |
|
|
(0.7) |
-(0.1) |
(0.9) |
(0.9) |
(1.9) |
(2.4) |
(2.3) |
IV |
Valuables |
14724 |
14187 |
13957 |
24572 |
41054 |
41392 |
49709 |
|
|
(0.7) |
(0.6) |
(0.6) |
(0.9) |
(1.3) |
(1.2) |
(1.2) |
V |
Errors & omissions |
3779 |
-30386 |
-5 |
38175 |
17818 |
35153 |
-4527 |
|
|
(0.2) |
-(1.3) |
(0.0) |
(1.4) |
(0.6) |
(1.0) |
-(0.1) |
VI |
Gross domestic capital formation # |
511788 |
520655 |
619485 |
775647 |
1013761 |
1271953 |
1487786 |
|
(II+III+IV+V) |
(24.3) |
(22.8) |
(25.2) |
(28.2) |
(32.2) |
(35.5) |
(35.9) |
|
|
|
(At Constant Prices) |
|
|
|
I |
Gross capital formation (GCF) |
485049 |
502115 |
555291 |
632621 |
781583 |
923828 |
1056532 |
|
|
(23.9) |
(23.5) |
(25.0) |
(26.3) |
(30.0) |
(32.5) |
(33.9) |
|
(i) Public sector |
140315 |
144540 |
134468 |
145578 |
166989 |
202884 |
227308 |
|
|
(6.9) |
(6.8) |
(6.1) |
(6.1) |
(6.4) |
(7.1) |
(7.3) |
|
(ii) Private corporate sector |
102912 |
111726 |
126124 |
156736 |
268172 |
364854 |
439419 |
|
|
(5.1) |
(5.2) |
(5.7) |
(6.5) |
(10.3) |
(12.8) |
(14.1) |
|
(iii) Household sector |
227566 |
232360 |
281769 |
308766 |
312549 |
322950 |
351714 |
|
|
(11.2) |
(10.9) |
(12.7) |
(12.9) |
(12.0) |
(11.4) |
(11.3) |
|
(iv) Valuables |
14256 |
13489 |
12930 |
21541 |
33873 |
33140 |
38091 |
|
|
(0.7) |
(0.6) |
(0.6) |
(0.9) |
(1.3) |
(1.2) |
(1.2) |
II |
Gross fixed capital formation |
456380 |
490009 |
522592 |
593964 |
705945 |
828986 |
954350 |
|
|
(22.5) |
(22.9) |
(23.6) |
(24.7) |
(27.1) |
(29.2) |
(30.6) |
III |
Change in stock |
14413 |
-1383 |
19769 |
17116 |
41765 |
61702 |
64091 |
|
|
(0.7) |
-(0.1) |
(0.9) |
(0.7) |
(1.6) |
(2.2) |
(2.1) |
IV |
Valuables |
14256 |
13489 |
12930 |
21541 |
33873 |
33140 |
38091 |
|
|
(0.7) |
(0.6) |
(0.6) |
(0.9) |
(1.3) |
(1.2) |
(1.2) |
V |
Errors & omissions |
3609 |
-27667 |
-4 |
33004 |
14059 |
26274 |
-3209 |
|
|
(0.2) |
-(1.3) |
(0.0) |
(1.4) |
(0.5) |
(0.9) |
-(0.1) |
VI |
Gross domestic capital formation # |
488658 |
474448 |
555287 |
665625 |
795642 |
950102 |
1053323 |
|
(II+III+IV+V) |
(24.1) |
(22.2) |
(25.0) |
(27.7) |
(30.6) |
(33.4) |
(33.8) |
Note : Figures in the parentheses are share as
per cent of GDP.
* : Quick Estimates # : Adjusted for errors and omissions. @ : Provisional.
Source : Central Statistical Organisation. |
Statement 4: Gross Capital Formation by Industry at constant prices (Contd.) |
(Amountin Rs. crore and rate as percentage of GDP) |
Item |
2000-01 |
2001-02 |
2002-03 |
2003-04 |
|
Amount |
Rate |
Amount |
Rate |
Amount |
Rate |
Amount |
Rate |
1 |
2 |
3 |
4 |
5 |
6 |
7 |
8 |
9 |
I. |
Agriculture & allied activities |
45480 |
2.2 |
56979 |
2.7 |
55668 |
2.5 |
53541 |
2.2 |
|
|
|
(9.7) |
|
(11.7) |
|
(10.3) |
|
(8.8) |
|
II. |
Industry |
174369 |
8.6 |
158480 |
7.4 |
203544 |
9.2 |
253758 |
10.6 |
|
|
|
(37.0) |
|
(32.4) |
|
(37.5) |
|
(41.5) |
|
|
(i) |
Mining & quarrying |
5810 |
0.3 |
8384 |
0.4 |
8393 |
0.4 |
14193 |
0.6 |
|
|
|
(1.2) |
|
(1.7) |
|
(1.5) |
|
(2.3) |
|
|
(ii) |
Manufacturing |
128988 |
6.4 |
106207 |
5.0 |
154652 |
7.0 |
189873 |
7.9 |
|
|
|
(27.4) |
|
(21.7) |
|
(28.5) |
|
(31.1) |
|
|
(iii) |
Electricity, gas |
39571 |
1.9 |
43889 |
2.1 |
40499 |
1.8 |
49692 |
2.1 |
|
|
& water supply |
(8.4) |
|
(9.0) |
|
(7.5) |
|
(8.1) |
|
III. |
Services |
250944 |
12.4 |
273167 |
12.8 |
283149 |
12.8 |
303781 |
12.6 |
|
|
|
(53.3) |
|
(55.9) |
|
(52.2) |
|
(49.7) |
|
|
(i) |
Construction |
9074 |
0.4 |
15846 |
0.7 |
16947 |
0.8 |
21564 |
0.9 |
|
|
|
(1.9) |
|
(3.2) |
|
(3.1) |
|
(3.5) |
|
|
(ii) |
Trade, hotels & |
27921 |
1.4 |
16437 |
0.8 |
9679 |
0.4 |
24463 |
1.0 |
|
|
restaurants |
(5.9) |
|
(3.4) |
|
(1.8) |
|
(4.0) |
|
|
(iii) |
Transport,storage |
76297 |
3.8 |
60348 |
2.8 |
74215 |
3.3 |
72308 |
3.0 |
|
|
& communication |
(16.2) |
|
(12.4) |
|
(13.7) |
|
(11.8) |
|
|
(iv) |
Financing, insurance, |
79976 |
3.9 |
109135 |
5.1 |
103662 |
4.7 |
104441 |
4.3 |
|
|
real estate |
(17.0) |
|
(22.3) |
|
(19.1) |
|
(17.1) |
|
|
(v) |
Community, social & |
57676 |
2.8 |
71401 |
3.3 |
78646 |
3.5 |
81005 |
3.4 |
|
|
services |
(12.3) |
|
(14.6) |
|
(14.5) |
|
(13.3) |
|
(IV) |
Gross capital formation |
470793 |
23.2 |
488626 |
22.9 |
542361 |
24.5 |
611080 |
25.4 |
|
( IV= I+II+III) |
(100.0) |
|
(100.0) |
|
(100.0) |
|
(100.0) |
|
Statement 4: Gross Capital Formation by Industryat constant prices (Concld.) |
(Amount in Rs. crore and rate as percentage of GDP) |
Item |
2004-05 |
2005-06 @ |
2006-07* |
| |
Amount |
Rate |
Amount |
Rate |
Amount |
Rate |
1 |
10 |
11 |
12 |
13 |
14 |
15 |
I. |
Agriculture & allied activities |
57759 |
2.2 |
64511 |
2.3 |
71208 |
2.3 |
|
|
|
(7.7) |
|
(7.2) |
|
(7.0) |
|
II. |
Industry |
363293 |
14.0 |
457865 |
16.1 |
528594 |
17.0 |
|
|
|
(48.6) |
|
(51.4) |
|
(51.9) |
|
|
(i) |
Mining & quarrying |
21848 |
0.8 |
27838 |
1.0 |
27269 |
0.9 |
|
|
|
(2.9) |
|
(3.1) |
|
(2.7) |
|
|
(ii) |
Manufacturing |
295879 |
11.4 |
371702 |
13.1 |
438333 |
14.1 |
|
|
|
(39.6) |
|
(41.7) |
|
(43.0) |
|
|
(iii) |
Electricity, gas |
45566 |
1.8 |
58325 |
2.1 |
62992 |
2.0 |
|
|
& water supply |
(6.1) |
|
(6.5) |
|
(6.2) |
|
III. |
Services |
326658 |
12.6 |
368312 |
13.0 |
418639 |
13.4 |
|
|
|
(43.7) |
|
(41.4) |
|
(41.1) |
|
|
(i) |
Construction |
25818 |
1.0 |
31395 |
1.1 |
34604 |
1.1 |
|
|
|
(3.5) |
|
(3.5) |
|
(3.4) |
|
|
(ii) |
Trade, hotels & restaurants |
25943 |
1.0 |
27902 |
1.0 |
29783 |
1.0 |
|
|
|
(3.5) |
|
(3.1) |
|
(2.9) |
|
|
(iii) |
Transport,storage |
83169 |
3.2 |
74130 |
2.6 |
84512 |
2.7 |
|
|
& communication |
(11.1) |
|
(8.3) |
|
(8.3) |
|
|
(iv) |
Financing, insurance, |
92524 |
3.6 |
108507 |
3.8 |
114094 |
3.7 |
|
|
real estate |
(12.4) |
|
(12.2) |
|
(11.2) |
|
|
(v) |
Community, social & |
99204 |
3.8 |
126378 |
4.4 |
155646 |
5.0 |
|
|
services |
(13.3) |
|
(14.2) |
|
(15.3) |
|
IV. |
Gross capital formation (GCF) |
747710 |
28.7 |
890688 |
31.3 |
1018441 |
32.7 |
|
( IV= I+II+III) |
(100.0) |
|
(100.0) |
|
(100.0) |
|
Note : Figures in the parentheses are share as per cent of GCF.
* : Quick Estimates @:Provisional
Source: Central Statistical Organisation |
Statement 5a: Select Macroeconomic Aggregates (at current prices) (Contd.) |
(Amount in Rs. crore and growth rate in per cent) |
|
2000-01 |
2001-02 |
2002-03 |
2003-04 |
Item |
Amount |
Growthrate |
Amount |
Growthrate |
Amount |
Growthrate |
Amount |
Growthrate |
1 |
2 |
3 |
4 |
5 |
6 |
7 |
8 |
9 |
| I Product Aggregates |
1 |
GDP at factor cost |
1925017 |
7.8 |
2097726 |
9.0 |
2261415 |
7.8 |
2538171 |
12.2 |
2 |
GDP at market prices |
2102314 |
7.7 |
2278952 |
8.4 |
2454561 |
7.7 |
2754621 |
12.2 |
3 |
NDP at market prices |
1900497 |
7.3 |
2050654 |
7.9 |
2204084 |
7.5 |
2474639 |
12.3 |
4 |
GNP at factor cost |
1902284 |
7.4 |
2077658 |
9.2 |
2244725 |
8.0 |
2519921 |
12.3 |
5 |
NNP at factor cost |
1700467 |
7.0 |
1849360 |
8.8 |
1994248 |
7.8 |
2239939 |
12.3 |
6 |
GNP at market prices |
2079581 |
7.4 |
2258884 |
8.6 |
2437871 |
7.9 |
2736371 |
12.2 |
7 |
NNP at market prices |
1877764 |
7.0 |
2030586 |
8.1 |
2187394 |
7.7 |
2456389 |
12.3 |
8 |
Per capita GNP at |
|
|
|
|
|
|
|
|
|
factor cost |
18668 |
5.5 |
19977 |
7.0 |
21257 |
6.4 |
23507 |
10.6 |
9 |
Per capita NNP at |
|
|
|
|
|
|
|
|
|
factor cost |
16688 |
5.1 |
17782 |
6.6 |
18885 |
6.2 |
20895 |
10.6 |
II Demand Aggregates |
1 |
Total final consumption |
|
|
|
|
|
|
|
|
|
expenditure |
1604362 |
6.5 |
1748981 |
9.0 |
1842343 |
5.3 |
2009783 |
9.1 |
|
|
(76.3) |
|
(76.7) |
|
(75.1) |
|
(73.0) |
|
2 |
Private final |
|
|
|
|
|
|
|
|
|
consumption |
1339274 |
6.8 |
1467195 |
9.6 |
1551365 |
5.7 |
1699486 |
9.5 |
|
expenditure |
(63.7) |
|
(64.4) |
|
(63.2) |
|
(61.7) |
|
3 |
Government final |
|
|
|
|
|
|
|
|
|
consumption |
|
|
|
|
|
|
|
|
|
expenditure |
265088 |
4.9 |
281786 |
6.3 |
290978 |
3.3 |
310297 |
6.6 |
|
|
(12.6) |
|
(12.4) |
|
(11.9) |
|
(11.3) |
|
4 |
Exports of goods & |
|
|
|
|
|
|
|
|
|
services |
278126 |
22.1 |
290757 |
4.5 |
355556 |
22.3 |
407803 |
14.7 |
|
|
(13.2) |
|
(12.8) |
|
(14.5) |
|
(14.8) |
|
5 |
Imports of goods & |
|
|
|
|
|
|
|
|
|
services |
297523 |
12.0 |
311050 |
4.5 |
379981 |
22.2 |
443398 |
16.7 |
|
|
(14.2) |
|
(13.6) |
|
(15.5) |
|
(16.1) |
|
6 |
Gross fixed capital |
|
|
|
|
|
|
|
|
|
formation |
477818 |
-5.6 |
538179 |
12.6 |
584242 |
8.6 |
687016 |
17.6 |
|
|
(22.7) |
|
(23.6) |
|
(23.8) |
|
(24.9) |
|
7 |
Change in stock |
15467 |
|
-1325 |
|
21291 |
|
25884 |
|
|
|
(0.7) |
|
-(0.1) |
|
(0.9) |
|
(0.9) |
|
8 |
Valuables |
14724 |
|
14187 |
|
13957 |
|
24572 |
|
|
|
(0.7) |
|
(0.6) |
|
(0.6) |
|
(0.9) |
|
9 |
Discrepancy |
9340 |
|
-777 |
|
17153 |
|
42961 |
|
|
|
(0.4) |
|
(0.0) |
|
(0.7) |
|
(1.6) |
|
Statement 5a: Select Macroeconomic Aggregates (at current prices) (Concld.) |
(Amount in Rs. crore and growth rate in per cent) |
|
2004-05 |
2005-06 @ |
2006-07* |
2007-08# |
Item |
Amount |
Growthrate |
Amount |
Growthrate |
Amount |
Growthrate |
Amount |
Growthrate |
1 |
10 |
11 |
12 |
13 |
14 |
15 |
16 |
17 |
| I Product Aggregates |
1 |
GDP at factor cost |
2877706 |
13.4 |
3275670 |
13.8 |
3790063 |
15.7 |
4303654 |
13.6 |
2 |
GDP at market prices |
3149412 |
14.3 |
3580344 |
13.7 |
4145810 |
15.8 |
4713148 |
13.7 |
3 |
NDP at market prices |
2820489 |
14.0 |
3201540 |
13.5 |
3711342 |
15.9 |
.. |
.. |
4 |
GNP at factor cost |
2855331 |
13.3 |
3249554 |
13.8 |
3760285 |
15.7 |
4281795 |
13.9 |
5 |
NNP at factor cost |
2526408 |
12.8 |
2870750 |
13.6 |
3325817 |
15.9 |
3789482 |
13.9 |
6 |
GNP at market prices |
3127037 |
14.3 |
3554228 |
13.7 |
4116032 |
15.8 |
.. |
.. |
7 |
NNP at market prices |
2798114 |
13.9 |
3175424 |
13.5 |
3681564 |
15.9 |
.. |
.. |
8 |
Per capita GNP at |
|
|
|
|
|
|
|
|
|
factor cost |
26220 |
11.5 |
29381 |
12.1 |
33514 |
14.1 |
.. |
.. |
9 |
Per capita NNP at |
|
|
|
|
|
|
|
|
|
factor cost |
23199 |
11.0 |
25956 |
11.9 |
29642 |
14.2 |
33299 |
12.3 |
| II Demand Aggregates |
1 |
Total final consumption expenditure |
2178458 |
8.4 |
2428463 |
11.5 |
2739112 |
12.8 |
3085281 |
12.6 |
|
|
(69.2) |
|
(67.8) |
|
(66.1) |
|
(65.5) |
|
2 |
Private final |
|
|
|
|
|
|
|
|
|
consumption |
1840406 |
8.3 |
2055387 |
11.7 |
2312105 |
12.5 |
2607584 |
12.8 |
|
expenditure |
(58.4) |
|
(57.4) |
|
(55.8) |
|
(55.3) |
|
3 |
Government final |
|
|
|
|
|
|
|
|
|
consumption |
|
|
|
|
|
|
|
|
|
expenditure |
338052 |
8.9 |
373076 |
10.4 |
427007 |
14.5 |
477697 |
11.9 |
|
|
(10.7) |
|
(10.4) |
|
(10.3) |
|
(10.1) |
|
4 |
Exports of goods & |
|
|
|
|
|
|
|
|
|
services |
569051 |
39.5 |
712087 |
25.1 |
915674 |
28.6 |
1005065 |
9.8 |
|
|
(18.1) |
|
(19.9) |
|
(22.1) |
|
(21.3) |
|
5 |
Imports of goods & |
|
|
|
|
|
|
|
|
|
services |
625945 |
41.2 |
813466 |
30.0 |
1040797 |
27.9 |
1151739 |
10.7 |
|
|
(19.9) |
|
(22.7) |
|
(25.1) |
|
(24.4) |
|
6 |
Gross fixed capital |
|
|
|
|
|
|
|
|
|
formation |
894674 |
30.2 |
1109160 |
24.0 |
1346501 |
21.4 |
1598078 |
18.7 |
|
|
(28.4) |
|
(31.0) |
|
(32.5) |
|
(33.9) |
|
7 |
Change in stock |
60215 |
|
86248 |
|
96103 |
|
109321 |
|
|
|
(1.9) |
|
(2.4) |
|
(2.3) |
|
(2.3) |
|
8 |
Valuables |
41054 |
|
41392 |
|
49709 |
|
59211 |
|
|
|
(1.3) |
|
(1.2) |
|
(1.2) |
|
(1.3) |
|
9 |
Discrepancy |
31905 |
|
16460 |
|
39508 |
|
7930 |
|
|
|
(1.0) |
|
(0.5) |
|
(1.0) |
|
(0.2) |
|
|
|
|
|
|
|
|
|
|
|
Note : Figures in parentheses are share in GDP at market prices
* : Quick Estimates #: Revised Estimates.
..: Not Available
@: Provisional
Source : CSO |
Statement 5b: Select Macroeconomic Aggregates ( at constant prices) (Contd.) |
(Amount in Rs. crore and growth rate in per cent) |
|
2000-01 |
2001-02 |
2002-03 |
2003-04 |
Item |
Amount |
Growthrate |
Amount |
Growthrate |
Amount |
Growthrate |
Amount |
Growthrate |
1 |
2 |
3 |
4 |
5 |
6 |
7 |
8 |
9 |
| IProduct Aggregates |
|
|
|
|
|
|
|
|
|
|
1 |
GDP at factor cost |
1864300 |
4.4 |
1972606 |
5.8 |
2048287 |
3.8 |
2222758 |
8.5 |
|
|
|
|
|
|
|
|
|
|
2 |
GDP at market prices |
2030710 |
4.0 |
2136651 |
5.2 |
2217134 |
3.8 |
2402727 |
8.4 |
|
|
|
|
|
|
|
|
|
|
3 |
NDP at market prices |
1836858 |
3.7 |
1928182 |
5.0 |
1993482 |
3.4 |
2161358 |
8.4 |
|
|
|
|
|
|
|
|
|
|
4 |
GNP at factor cost |
1841755 |
4.0 |
1951935 |
6.0 |
2029482 |
4.0 |
2204913 |
8.6 |
|
|
|
|
|
|
|
|
|
|
5 |
NNP at factor cost |
1647903 |
3.7 |
1743466 |
5.8 |
1805830 |
3.6 |
1963544 |
8.7 |
|
|
|
|
|
|
|
|
|
|
6 |
GNP at market prices |
2008165 |
3.7 |
2115980 |
5.4 |
2198329 |
3.9 |
2384882 |
8.5 |
|
|
|
|
|
|
|
|
|
|
7 |
NNP at market prices |
1814313 |
3.4 |
1907511 |
5.1 |
1974677 |
3.5 |
2143513 |
8.6 |
|
|
|
|
|
|
|
|
|
|
8 |
Per capita GNP at |
|
|
|
|
|
|
|
|
|
factor cost |
18074 |
2.2 |
18769 |
3.8 |
19219 |
2.4 |
20568 |
7.0 |
|
|
|
|
|
|
|
|
|
|
9 |
Per capita NNP at |
|
|
|
|
|
|
|
|
|
factor cost |
16172 |
1.8 |
16764 |
3.7 |
17101 |
2.0 |
18317 |
7.1 |
|
|
|
|
|
|
|
|
|
|
| II Demand Aggregates |
|
|
|
|
|
|
|
|
|
|
1 |
Total final consumption |
|
|
|
|
|
|
|
|
|
expenditure |
1548909 |
2.8 |
1634234 |
5.5 |
1669920 |
2.2 |
1758637 |
5.3 |
|
|
(76.3) |
|
(76.5) |
|
(75.3) |
|
(73.2) |
|
|
|
|
|
|
|
|
|
|
|
2 |
Private final |
|
|
|
|
|
|
|
|
|
consumption |
1293822 |
3.2 |
1373355 |
6.1 |
1409960 |
2.7 |
1492038 |
5.8 |
|
expenditure |
(63.7) |
|
(64.3) |
|
(63.6) |
|
(62.1) |
|
|
|
|
|
|
|
|
|
|
|
3 |
Government final |
|
|
|
|
|
|
|
|
|
consumption |
255087 |
0.9 |
260879 |
2.3 |
259960 |
-0.4 |
266599 |
2.6 |
|
expenditure |
(12.6) |
|
(12.2) |
|
(11.7) |
|
(11.1) |
|
|
|
|
|
|
|
|
|
|
|
4 |
Exports of goods & |
|
|
|
|
|
|
|
|
|
services |
269241 |
18.2 |
284498 |
5.7 |
346546 |
21.8 |
366729 |
5.8 |
|
|
(13.3) |
|
(13.3) |
|
(15.6) |
|
(15.3) |
|
|
|
|
|
|
|
|
|
|
|
5 |
Imports of goods & |
|
|
|
|
|
|
|
|
|
services |
274975 |
3.5 |
284324 |
3.4 |
313775 |
10.4 |
366445 |
16.8 |
|
|
(13.5) |
|
(13.3) |
|
(14.2) |
|
(15.3) |
|
|
|
|
|
|
|
|
|
|
|
6 |
Gross fixed capital |
|
|
|
|
|
|
|
|
|
formation |
456380 |
-9.8 |
490009 |
7.4 |
522592 |
6.6 |
593964 |
13.7 |
|
|
(22.5) |
|
(22.9) |
|
(23.6) |
|
(24.7) |
|
|
|
|
|
|
|
|
|
|
|
7 |
Change in stock |
14413 |
|
-1383 |
|
19769 |
|
17116 |
|
|
|
(0.7) |
|
-(0.1) |
|
(0.9) |
|
(0.7) |
|
|
|
|
|
|
|
|
|
|
|
8 |
Valuables |
14256 |
|
13489 |
|
12930 |
|
21541 |
|
|
|
(0.7) |
|
(0.6) |
|
(0.6) |
|
(0.9) |
|
|
|
|
|
|
|
|
|
|
|
9 |
Discrepancy |
2486 |
|
127 |
|
-40848 |
|
11185 |
|
|
|
(0.1) |
|
(0.0) |
|
-(1.8) |
|
(0.5) |
|
Statement 5b: Select Macroeconomic Aggregates ( at constant prices) (Concld.) |
(Amount in Rs. crore and growth rate in per cent) |
|
2004-05 |
2005-06 @ |
2006-07* |
2007-08# |
Item |
Amount |
Growthrate |
Amount |
Growthrate |
Amount |
Growthrate |
Amount |
Growthrate |
1 |
10 |
11 |
12 |
13 |
14 |
15 |
16 |
17 |
| I Product Aggregates |
1 |
GDP at factor cost |
2388384 |
7.5 |
2612847 |
9.4 |
2864310 |
9.6 |
3122862 |
9.0 |
2 |
GDP at market prices |
2601630 |
8.3 |
2841967 |
9.2 |
3117372 |
9.7 |
3398767 |
9.0 |
3 |
NDP at market prices |
2339264 |
8.2 |
2555701 |
9.3 |
2802710 |
9.7 |
.. |
.. |
4 |
GNP at factor cost |
2366886 |
7.3 |
2593160 |
9.6 |
2845156 |
9.7 |
3109361 |
9.3 |
5 |
NNP at factor cost |
2104520 |
7.2 |
2306894 |
9.6 |
2530495 |
9.7 |
2767682 |
9.4 |
6 |
GNP at market prices |
2580132 |
8.2 |
2822280 |
9.4 |
3098217 |
9.8 |
.. |
.. |
7 |
NNP at market prices |
2317766 |
8.1 |
2536014 |
9.4 |
2783556 |
9.8 |
.. |
.. |
8 |
Per capita GNP at |
|
|
|
|
|
|
|
|
|
factor cost |
21734 |
5.7 |
23446 |
7.9 |
25358 |
8.2 |
.. |
.. |
9 |
Per capita NNP at |
|
|
|
|
|
|
|
|
|
factor cost |
19325 |
5.5 |
20858 |
7.9 |
22553 |
8.1 |
24321 |
7.8 |
| II Demand Aggregates |
1 |
Total final consumption |
|
|
|
|
|
|
|
|
|
expenditure |
1843248 |
4.8 |
1994158 |
8.2 |
2132910 |
7.0 |
2305623 |
8.1 |
|
|
(70.8) |
|
(70.2) |
|
(68.4) |
|
(67.8) |
|
2 |
Private final |
|
|
|
|
|
|
|
|
|
consumption |
1569622 |
5.2 |
1705663 |
8.7 |
1826490 |
7.1 |
1977876 |
8.3 |
|
|
(60.3) |
|
(60.0) |
|
(58.6) |
|
(58.2) |
|
3 |
Government final |
|
|
|
|
|
|
|
|
|
consumption |
|
|
|
|
|
|
|
|
|
expenditure |
273626 |
2.6 |
288495 |
5.4 |
306420 |
6.2 |
327747 |
7.0 |
|
|
(10.5) |
|
(10.2) |
|
(9.8) |
|
(9.6) |
|
4 |
Exports of goods & |
|
|
|
|
|
|
|
|
|
services |
469902 |
28.1 |
539460 |
14.8 |
641228 |
18.9 |
689636 |
7.5 |
|
|
(18.1) |
|
(19.0) |
|
(20.6) |
|
(20.3) |
|
5 |
Imports of goods & |
|
|
|
|
|
|
|
|
|
services |
425234 |
16.0 |
619076 |
45.6 |
770961 |
24.5 |
830006 |
7.7 |
|
|
(16.3) |
|
(21.8) |
|
(24.7) |
|
(24.4) |
|
6 |
Gross fixed capital |
|
|
|
|
|
|
|
|
|
formation |
705945 |
18.9 |
828986 |
17.4 |
954350 |
15.1 |
1085618 |
13.8 |
|
|
(27.1) |
|
(29.2) |
|
(30.6) |
|
(31.9) |
|
7 |
Change in stock |
41765 |
|
61702 |
|
64091 |
|
68541 |
|
|
|
(1.6) |
|
(2.2) |
|
(2.1) |
|
(2.0) |
|
8 |
Valuables |
33873 |
|
33140 |
|
38091 |
|
43404 |
|
|
|
(1.3) |
|
(1.2) |
|
(1.2) |
|
(1.3) |
|
9 |
Discrepancy |
-67869 |
|
3597 |
|
57663 |
|
35950 |
|
|
|
-(2.6) |
|
(0.1) |
|
(1.8) |
|
(1.1) |
|
|
|
|
|
|
|
|
|
|
|
Note : Figures in parentheses are share in GDP at market prices.
* :Revised Estimates. # : Quick Estimates . ..: Not Available. @ :Provisional
Source : CSO. |
|


