 IST,
IST,


Shifting Tides: Growing Influence of Non-Bank Investors in G-Sec Market in India
by Amit Pawar, Mayank Gupta, Abhinandan Borad, Subrat Kumar Seet and Deba Prasad Rath^ Non-bank entities absorbed a significant portion of newly issued sovereign debt during the Covid-19 pandemic. Nonetheless, banks still dominate the ownership of GoI dated securities in India. The study reveals that non-banks are more responsive to changes in G-Sec yields than banks. Overall, a one per cent increase in G-Sec supply is found to be associated with a 9.5 to 10 basis points increase in long term yields. Scenario analysis indicates shallower increase in borrowing costs when non-banks absorb all new government debt compared to when it is absorbed entirely by banks, highlighting that RBI’s continued efforts to diversify the investor pool for G-Secs are well calibrated. Introduction Global sovereign debt surged in the aftermath of Covid-19 pandemic as governments across geographies extended wide ranging fiscal support to revitalize economic growth and safeguard social welfare (Gasper et. al, 2021). Globally, sovereign bond yields also increased in response to higher government borrowings. In India, total outstanding Government of India (GoI) dated securities as a percentage of nominal GDP expanded from 32.3 per cent at end-March 2020 to 38.5 per cent at end-March 2021 (Chart 1). Theoretically, the surge in government debt levels can lead to an increase in G-Sec yields as investors perceive a higher level of risk associated with the rise in debt. However, during the same period, the yields on benchmark 10-year G-Sec increased marginally from 6.14 per cent to 6.17 per cent. Timely policy measures by the Reserve Bank of India (RBI), including asset-purchase programmes and accommodative monetary policy during Covid-19 helped in orderly evolution of long-term yields (Patra et al., 2022). For advanced economies, debt-to-GDP ratio and potential growth are considered as long-run determinants of sovereign bond yields while inflation, short-term interest rates, and changes in output growth among others are regarded as short-run determinants (Poghosyan, 2014). In the Indian context, in addition to size of sovereign borrowing, G-Sec yields have also been found to be influenced by various factors such as inflation, economic growth, short-term interest rates, domestic liquidity conditions, and investor risk appetite among others (Dua et al., 2014; Akram, 2019). However, the existing empirical works for India focuses mostly only on the association between bond yields and macroeconomic determinants, without differentiating between long-run and short-run determinants of sovereign bond yields. 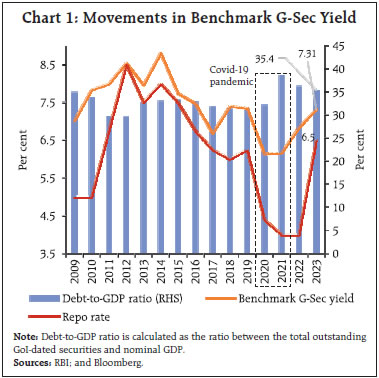 Notwithstanding the existing literature on government bond yields, the debate on short-run and long-run determinants of bond yields as well as their significant key drivers remains unsettled, especially in emerging market economies like India. Further, the impact of evolving ownership trends on sovereign borrowing cost also remains unexplored. With growing economy and evolving financial markets in India, the investor composition, i.e., the types of investors that trade, invest, and hold G-Secs, is also undergoing a change. The outstanding stock of GoI dated securities increased from ₹19.3 lakh crore (35 per cent of GDP at current prices) at end-March 2009 to ₹93.7 lakh crore (35.3 per cent of GDP at current prices) at end-December 2022. The relative holdings of investors as measured through share in the total outstanding has also undergone changes over the years. For instance, in response to nearly five-fold increase in total outstanding GoI dated securities, holdings of commercial banks increased less than four-fold from ₹9.4 lakh crore at end-March 2009 to ₹33.9 lakh crore at end-December 2022 with their share in the total outstanding declining from 46.9 per cent to 36.1 per cent during this period (Chart 2). Further, the share of insurance companies increased from 23.2 per cent at end-March 2009 to 26.1 per cent at end-December 2022. Amongst other non-bank investors, the shares of mutual funds, foreign portfolio investors (FPI) and others1 have increased, while the share of provident funds has declined during the same period. A strand of recent cross-country literature highlights the influence of investor composition on cost of sovereign borrowings especially in the context of active participation of non-bank investors in Emerging Market (EM) sovereign debt. These studies highlight that governments can secure loans at a lower cost/yield when the presence of non-bank investors is high, other things remaining constant (Fang et al., 2023). The investor base in sovereign debt market may also matter for financial stability - countries where investor base is well diversified, high debt-to-GDP ratio may matter less, and subsequently the likelihood of sudden stops/reversals in sovereign debt market is also less (Arslanalp et al., 2013). 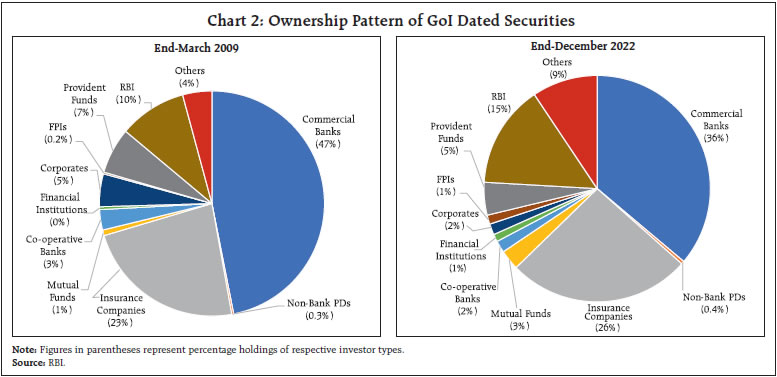 Policy measures have been undertaken in several EMEs to widen the investor base for sovereign bonds (ADB, 2013). In India, the Reserve Bank (RBI) also strove to widen the investor base for G-Sec through several measures (see Table 1 Annex A). It is apparent that such measures have begun to bear fruit especially in the Indian context. In the period spanning between the Global Financial Crisis (GFC) and the Taper Tantrum, banks remained the major players in the G-Secs market absorbing 44.8 per cent of net debt issuances. However, since the Taper Tantrum, non-bank investors have absorbed much of the issuance of new debt, which further gained strength during the Covid-19 pandemic since March 2020 when non-banks absorbed around 58.4 per cent of net debt issuances (Chart 3a). This is in contrast with other EMEs where banks’ exposure to sovereign debt has increased during the Covid-19 period (IMF, 2022 and Chart 3b). The ‘sovereign-bank nexus’ literature highlights macro-financial stability risks emanating from high exposure of banks to sovereign debt (Deghi et al., 2022). Against this background, this study aims to investigate the investor base of outstanding G-secs and its impact on sovereign yield. Cross-country research has examined the changes in the composition of government debt holders and the marginal response of each investor group to changes in outstanding government debt (Fang et al., 2023; Eren et al., 2023). However, in the Indian context, there is a notable gap in the existing literature on the analysis of ownership patterns and the cost of borrowing. The present study fills this gap on several dimensions: first, an analysis of the recent trends in the ownership pattern of G-Secs is conducted. Second, the paper estimates the absorption of new debt by major investor groups, viz., banks, non-banks, and official (RBI), with a special focus on the Covid-19 pandemic. Third, we show that sovereign debt demand of non-bank investors is more sensitive to yield changes compared to banks. Finally, the study estimates the sensitivity of Indian government bond yields with a rise in supply of total debt and how these estimates change under alternative absorption scenarios. This article is divided into five sections. Section II profiles the changing ownership of investors in the GoI dated securities market. Section III provides an overview of the related extant literature. Section IV discusses the data, methodology adopted and results. Finally, Section V concludes the study. 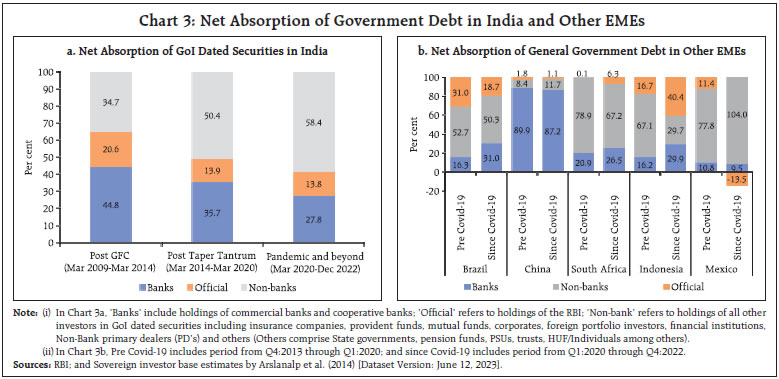 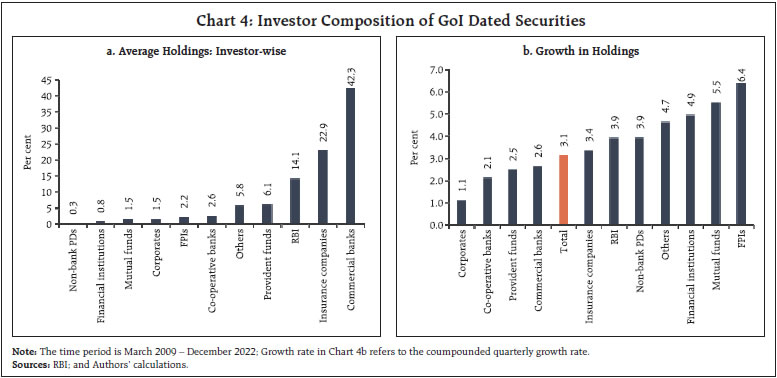 II. Investor Groups - Changing Contour of Ownership Major holders of GoI dated securities at end-December 2022 include scheduled commercial banks (₹33.9 lakh crore), insurance companies (₹24.5 lakh crore), Reserve Bank of India (₹13.8 lakh crore), provident funds (₹4.4 lakh crore), pension funds (₹3.7 lakh crore), mutual funds (₹2.7 lakh crore), among others. Commercial banks, insurance companies and the Reserve Bank have remained the largest holders of GoI dated securities (Chart 4a). Over time there has been a commensurate increase in holdings of different investor group with overall increase in outstanding marketable debt securities. However, investors such as FPIs and mutual funds, have experienced a faster growth in their holdings compared to the growth of the total outstanding debt. On the other hand, some investors such as corporates and cooperative banks have grown at a slower pace (Chart 4b). Banks’ holdings of GoI dated securities have exhibited a secular decline from around 50 per cent in March 2009 to under 40 per cent in December 2022, while the holdings of non-banks have gradually increased over this period and surpassed banks as the largest holders of GoI dated securities around March 2019 highlighting the growing diversification of government debt holders (Chart 5). On the other hand, holdings of the RBI increased post GFC since March 2009 up to the Taper Tantrum but declined thereafter to remain range bound for the rest of the sample period. 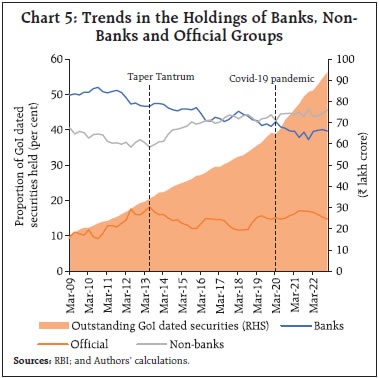 III. Survey of Extant Literature Demand and ownership of government debt and its implications for long-term yields has remained an active line of inquiry in the macro-finance literature. It is argued that tracking ownership of government debt can shed light on the potential risks in government debt markets and highlights upside risks to cost of borrowing for countries with higher share of foreign private investors as they are more vulnerable to global spillovers (Arslanalp et al., 2013). However, in the case of India, the sovereign debt is rupee-denominated and foreign investors hold relatively smaller proportion of sovereign debt. Additionally, increase in demand for sovereign debt leads to a decline in sovereign bond yields which several studies have attributed to low risk premia on government bonds (ECB, 2007). For instance, increased demand for bonds from institutional investors has been found to be associated with lower long term bond yields in Euro area (ECB, 2007) and G-20 economies (Andritzky, 2012). Further, Andritzky (2012) also reveals that a 10 per cent increase in institutional investor holdings corresponds to a reduction in yield ranging from 25 to 40 basis points. In a similar study, Poghosyan (2014) states that in the long run, government bond yields in advanced economics increase by two basis points in response to a one percentage point increase in debt-to-GDP ratio. Fang et al. (2023) suggests that non-bank private investors absorb disproportionately more sovereign debt supply than other investors. The authors note that non-bank private investors are found to be most sensitive as compared to banks and central banks. Further, for EMEs on average, a one per cent increase in debt leads to a six basis points increase in the cost of borrowings. Eren et. al. (2023) documents the sectoral composition of US government debt as evolving over time and estimates the yield elasticity of demand for sovereign debt using monetary policy surprises as an instrumental variable. The authors suggest that a one per cent increase in long-term yield results in an 11 per cent increase in demand for sovereign debt among non-bank players. In the Indian context, literature exists on the determinants of long-term yields namely, Akram et. al. (2019); Dua et. al. (2014). Additionally, Mishra et al. (2022) document the rising trend in sovereign debt in India and its macroeconomic implications. IV. Data, Methodology and Results The study uses quarterly data on ownership pattern of GoI dated securities (G-Sec) from March 2009 till December 2022. Sources of quarterly data on control variables are detailed in Table 2 of Annex A. Going forward, unless stated otherwise debt refers to outstanding stock of GoI dated securities. This section focuses on investor-wise absorption of new debt, sensitivity of investor holdings to changes in nominal G-Sec yields and finally the sensitivity of yields to a given increase in supply of total debt by the sovereign. To conduct the empirical analysis, taking cue from the approach used by Fang et al. (2023), referred to as FHL (2023) hereafter, with certain modifications2, ownership of different investor groups is combined into three broad categories: Banks, Non-banks, and Official holdings (Table 1). Against the backdrop of the evolving investor trends as alluded to in the Section II, we first shed light on marginal absorption of new debt (net). Marginal absorption of new debt refers to how much of the new supply of debt is absorbed by banks, non-banks, and official investors. We define the book value of sovereign debt held by each investor group i, as Hi. Then, the holdings can be aggregated to arrive at the total debt D such that: 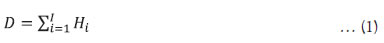 In equation (1), I is the number of investor groups, which is three in our case. Next, we use a simple model to estimate how much each investors’ holdings change in response to the changes in total debt. The following equation is estimated for each investor: 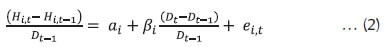 where subscript ‘t’ denotes time. The coefficients βi’s give the proportion of debt absorbed. The βi’s sum to one since all the new debt will be absorbed by some investor. Results suggest that for every additional unit of debt supplied, 49.8 per cent is absorbed by banks while 45.7 per cent is absorbed by non-banks (Table 2). The estimated share of the official group is estimated to be 4.5 per cent; however, it is not found to be statistically significant. These finding highlights that the central bank is not systematically increasing debt holdings but only participates in the G-Sec market on discretion and as a matter of policy choice. Panel B in Table 2 also reports the investor-wise average holdings of G-Secs. While the above analysis suggests how much of the additional debt is absorbed by each investor over the entire sample, it would be interesting to know if these absorptions vary across time. Particularly, it is hypothesized that marginal responses across investor groups varied during the Covid-19 pandemic as compared to the pre-pandemic sample. To test this, time interaction dummies are introduced in equation (3) as below: 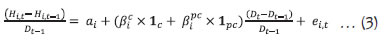 where 1c and 1pc are dummy variables which take value 1 in Covid-19 period (since March 2020) and pre-Covid period, respectively. It is evident that the marginal response of banks during the Covid-19 declined while that of non-banks increased, possibly chasing the relative safety of sovereign bonds amid pandemic induced uncertainty. In fact, non-banks absorbed more than half of the new debt during the Covid-19 period3. Additionally, the central bank’s response remains statistically insignificant as before, despite a slew of unconventional policy measures aimed at orderly evolution of the yield curve (Table 3). To examine investor-wise sensitivity to changes in yield, we use a framework that relates debt funding of sovereign to its creditor holdings and then use this structure to extract each creditor’s sensitivity to changes in yield. This approach closely follows FHL (2023), suitably adjusting it, wherever necessary (Refer Annex B for details). An empirical regression equation is specified for investor i’s holding share of debt-to-GDP as: 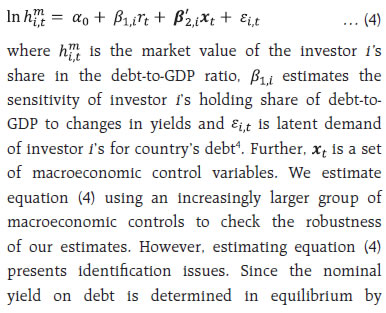 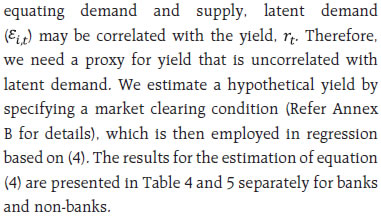 We employ a large set of control variables across specifications for checking the robustness of our estimates. Prevailing economic conditions (real GDP growth, inflation and short-term interest rates) can impact the demand for sovereign debt. Risk-return profile of investment substitutes such as equity (Nifty returns and volatility) may also impact the demand for sovereign debt. Non-resident demand for government bonds can also be driven by a flight-to-quality phenomenon, which refers to the behaviour of investors to shift their asset allocation away from riskier investments and into safer ones during financial downturns or bear markets (US 10-year treasury). The findings suggest that as yields rise, the demand for debt rises among both banks and non-banks. However, non-banks exhibit slightly greater sensitivity to yield changes compared to banks. Specifically, the sensitivity estimates of non-banks surpass those of banks by approximately 5-10 per cent, depending on the specification employed. It is evident that a one per cent increase in bond yield leads to a notable response from both banks and non-banks. Specifically, domestic banks increase their debt holdings by 9.8 to 10.2 per cent, while non-banks exhibit a higher response, increasing their holdings by 10.8 to 11.1 per cent. This divergence reflects the different regulatory environments for banks vis-à-vis non-banks. For instance, changing bond yields can have a differential impact on portfolio valuation of both groups. As per RBI regulations, the investment portfolio of banks is classified under three categories, viz., ‘Held to Maturity (HTM)’, ‘Available for Sale (AFS)’ and ‘Held for Trading (HFT)’. Among these, only AFS and HFT categories of investments are subject to mark-to-market valuation. Banks’ investments held under HTM category are not subject to mark-to-market valuation and thus provide a cushion for banks from valuation changes5. In contrast, the investments held by non-banks are generally valued at mark-to-market. Response to inflation by non-banks is also higher in magnitude as compared with banks. As higher inflation erodes the value of long-term securities, the demand for long term sovereign securities will decline. Both banks and non-banks exhibit this negative relationship. The reaction to real GDP growth6 is similar as response to inflation. A possible explanation for a negative sign is that higher growth could lead to better returns in alternative investment options like equities. As a result, there might be a reduced demand for sovereign debt. Banks are found to react to equity volatility, but non-banks exhibit significant coefficients only under one specification. However, the magnitude of coefficients is negligible in both cases. Non-banks respond more strongly to changes in external financial conditions as compared to banks as seen from significant coefficients on the 10-year US treasury. Domestic monetary policy also affects the demand for sovereign debt by both banks and non-banks. Varied business models, risk profiles and regulatory environments are possible reasons for the differential impact of various macroeconomic factors on demand for sovereign debt by banks and non-banks. Next, we examine the yield sensitivity to increase in supply of total debt. Investor pool for sovereign debt has diversified in India, so it becomes paramount to understand its impact on yield sensitivity. Therefore, we use a measure of yield sensitivity as derived by FHL (2023). This measure conveys what would happen to bond yields when the government wants to increase the debt by one per cent keeping all else constant. 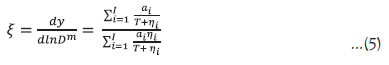 where ηi is the yield elasticity of demand by each investor group ‘i‘ as estimated in the Table 4 & 5 while αi is the change in book value holdings by investor ‘i‘ in response to changes in total debt or marginal absorptions as estimated in Table 2. ‘T’ is the maturity on debt which is 10 in our case In this section, we estimate the measure ξ using only the holdings of banks and non-banks, as it is assumed that the changes in holdings of central bank in response to change in yield is more a policy choice rather than market behavior. Additionally, a scenario analysis is conducted to arrive at alternative measures of ξ for different investor compositions by varying the marginal absorption shares across investor groups. The estimated marginal absorptions αi from Table 2 and η’s from Table 4 and 5 show that with one per cent increase in sovereign debt supply, the cost of financing, which is the yield, will increase between 9.5 to 10 basis points (Table 6). Further, another finding relates to shift in sensitivity when considering changes in the investor base. To explore this, two scenarios are examined, one where all new debt is taken up by non-banks (“No Banks” row), and another where all new debt is absorbed by banks (“No Non-banks” row). The results reveal an interesting contrast - when all the new debt is assumed to be absorbed by banks, the increase in yields is on average 8.1 per cent higher compared to the scenario where all the debt is assumed to be absorbed by non-banks, which suggests that the impact of yield changes is less pronounced when non-banks are the primary investors, as opposed to banks. In the backdrop of rising sovereign debt coupled with the increasing participation of non-banks in the ownership of G-Secs, this study assesses the impact of diversification of investor base for G-Secs on the sovereign’s cost of borrowing. Although the average ownership of banks has been historically higher compared to other investor groups, lately there has been an increasing uptake of government securities by non-bank investors. This trend was amplified during the Covid-19 period. The study finds that as compared to banks, non-bank investors are more sensitive to changes in G-Sec yields – for a 1 percentage point increase in yields, domestic banks increase their debt holdings by 9.8 to 10.2 per cent, while non-banks exhibit a higher response, increasing their holdings by 10.8 to 11.1 per cent. Different regulatory directions, idiosyncratic business models and distinctive holding objectives are probable reasons for such deviation. The study finds that a one per cent increase in supply of new debt would lead to a 9.5 to 10 basis points increase in the G-Sec yield. Further, while conducting a scenario analysis to understand the impact of changing ownership pattern on cost of borrowing, it is observed that when all the new debt is absorbed by banks, the increase in yield, is on average 8.1 per cent higher compared to the scenario where all the debt is assumed to be absorbed by non-banks. These findings highlight that the Reserve Bank’s sustained measures aimed at diversifying the investor pool for G-Secs are well calibrated and aligned with debt management objectives of cost optimisation, risk mitigation and market development. References Akram, T., & Das, A. (2019). The long-run determinants of Indian government bond yields. Asian Development Review, 36(1), 168-205. Andritzky, J. R. (2012). Government Bonds and their Investors: What Are the Facts and Do they Matter? 1. IMF Working Papers, 2012(158). Arslanalp, S. & Tsuda, T. (2014) “Tracking Global Demand for Emerging Market Sovereign Debt”, IMF Working Paper WP/14/39, Washington, DC. Arslanalp, S., & Tsuda, T. (2013, January 17). The Ties That Bond Us: What Demand For Government Debt Can Tell Us About the Risks Ahead. IMF Blog. Asian Development Bank (ADB). (2013). Broadening the Investor Base for Local Currency Bonds in ASEAN+ 2 Countries. (ADB Reports RPT15462-2). Deghi, A., Fendoglu, S., Iyer, T., Tabarraei, H. R., Xu, Y., & Yenice, M. (2022). The Sovereign-Bank Nexus in Emerging Markets in the Wake of the COVID-19 Pandemic. IMF Working Papers, 2022 (223). Dua, P., & Raje, N. (2014). Determinants of Yields on Government Securities in India. Margin: The Journal of Applied Economic Research, 8(4), 375-400. Eren, E., Schrimpf, A., & Xia, D. (2023). The demand for government debt (No. 1105). Bank for International Settlements. European Central Bank. (2007). ECB Monthly Bulletin May 2007. Fang, X., Hardy, B., & Lewis, K. K. (2022). Who holds sovereign debt and why it matters (No. w30087). National Bureau of Economic Research. Gasper, V., Medas, P., & Roberto, P. (2021, December 15). Global Debt Reaches a Record $226 Trillion. IMF Blog. International Monetary Fund (IMF) (April 2022). Global Financial Stability Report. Mishra, P & Patel, N. (2022, August 1). The Anatomy of Public Debt Reductions in India. India in Transition. Patra M., & Bhattacharyya, I. (2022). Priming Monetary Policy for the Pandemic. Economic & Political Weekly, 57(20), 41-48. Poghosyan, T. (2014). Long-run and short-run determinants of sovereign bond yields in advanced economies. Economic Systems, 38(1), 100-114. Reserve Bank of India. (2023). Financial Stability Report (FSR) June 2023. 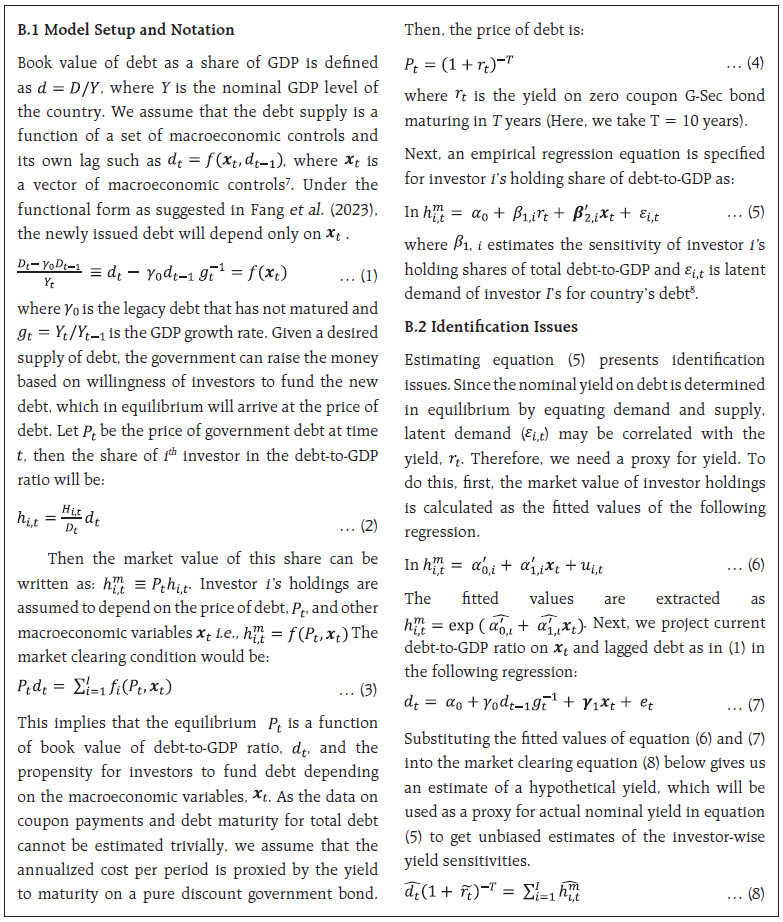 ^ The authors are from the Department of Economic and Policy Research. The views expressed in this article are those of the authors and do not represent the views of the Reserve Bank of India. 1 Includes State governments, pension funds, PSUs, trusts and HUF/individuals among others. 2 As per FHL (2023), State governments’ holdings should be classified within the Official category. But the bifurcation of State governments’ holdings within the category ‘Others’ is only available from June 2015 as per RBIs database on Indian economy (DBIE); therefore, it has been included into non-banks. 3 Mutual funds which are part of non-bank investors were also affected by a regulatory change by the SEBI in November 2020 mandating specified open ended debt schemes to hold atleast 10 per cent of their net assets in liquid assets such as cash, G-Sec, T-bills and Repo on G-Sec. 4 Parameters in bold face are vectors. 5 Bank’s investments under HTM category is limited to 25 per cent of total investments. However, it can exceed 25 per cent if (i) the excess comprises of SLR securities and (ii) total SLR in HTM does not exceed a certain percentage (currently 23 per cent) of net demand and time liabilities (FSR, 2023). 6 Economic theory suggests government bond yields are also affected by potential growth (Poghosyan, 2014). Instead of Real GDP growth, potential growth rate is employed for robustness. The results broadly remain similar. 7 As in FHL (2023), we replace Pt with rt since the Pt is a monotonic transformation of rt. 8 Parameters in bold face are vectors. |

ಈ ಪುಟವನ್ನು ಹಂಚಿಕೊಳ್ಳಿ:


ಭಾರತೀಯ ರಿಸರ್ವ್ ಬ್ಯಾಂಕ್ ಮೊಬೈಲ್ ಅಪ್ಲಿಕೇಶನ್ ಅನ್ನು ಇನ್ಸ್ಟಾಲ್ ಮಾಡಿ ಮತ್ತು ಇತ್ತೀಚಿನ ಸುದ್ದಿಗಳಿಗೆ ತ್ವರಿತ ಅಕ್ಸೆಸ್ ಪಡೆಯಿರಿ!
ನಮ್ಮ ಅಪ್ಲಿಕೇಶನ್ ಅನ್ನು ಸ್ಥಾಪಿಸಲು QR ಕೋಡ್ ಅನ್ನು ಸ್ಕ್ಯಾನ್ ಮಾಡಿ


ಪೇಜ್ ಕೊನೆಯದಾಗಿ ಅಪ್ಡೇಟ್ ಆದ ದಿನಾಂಕ:


